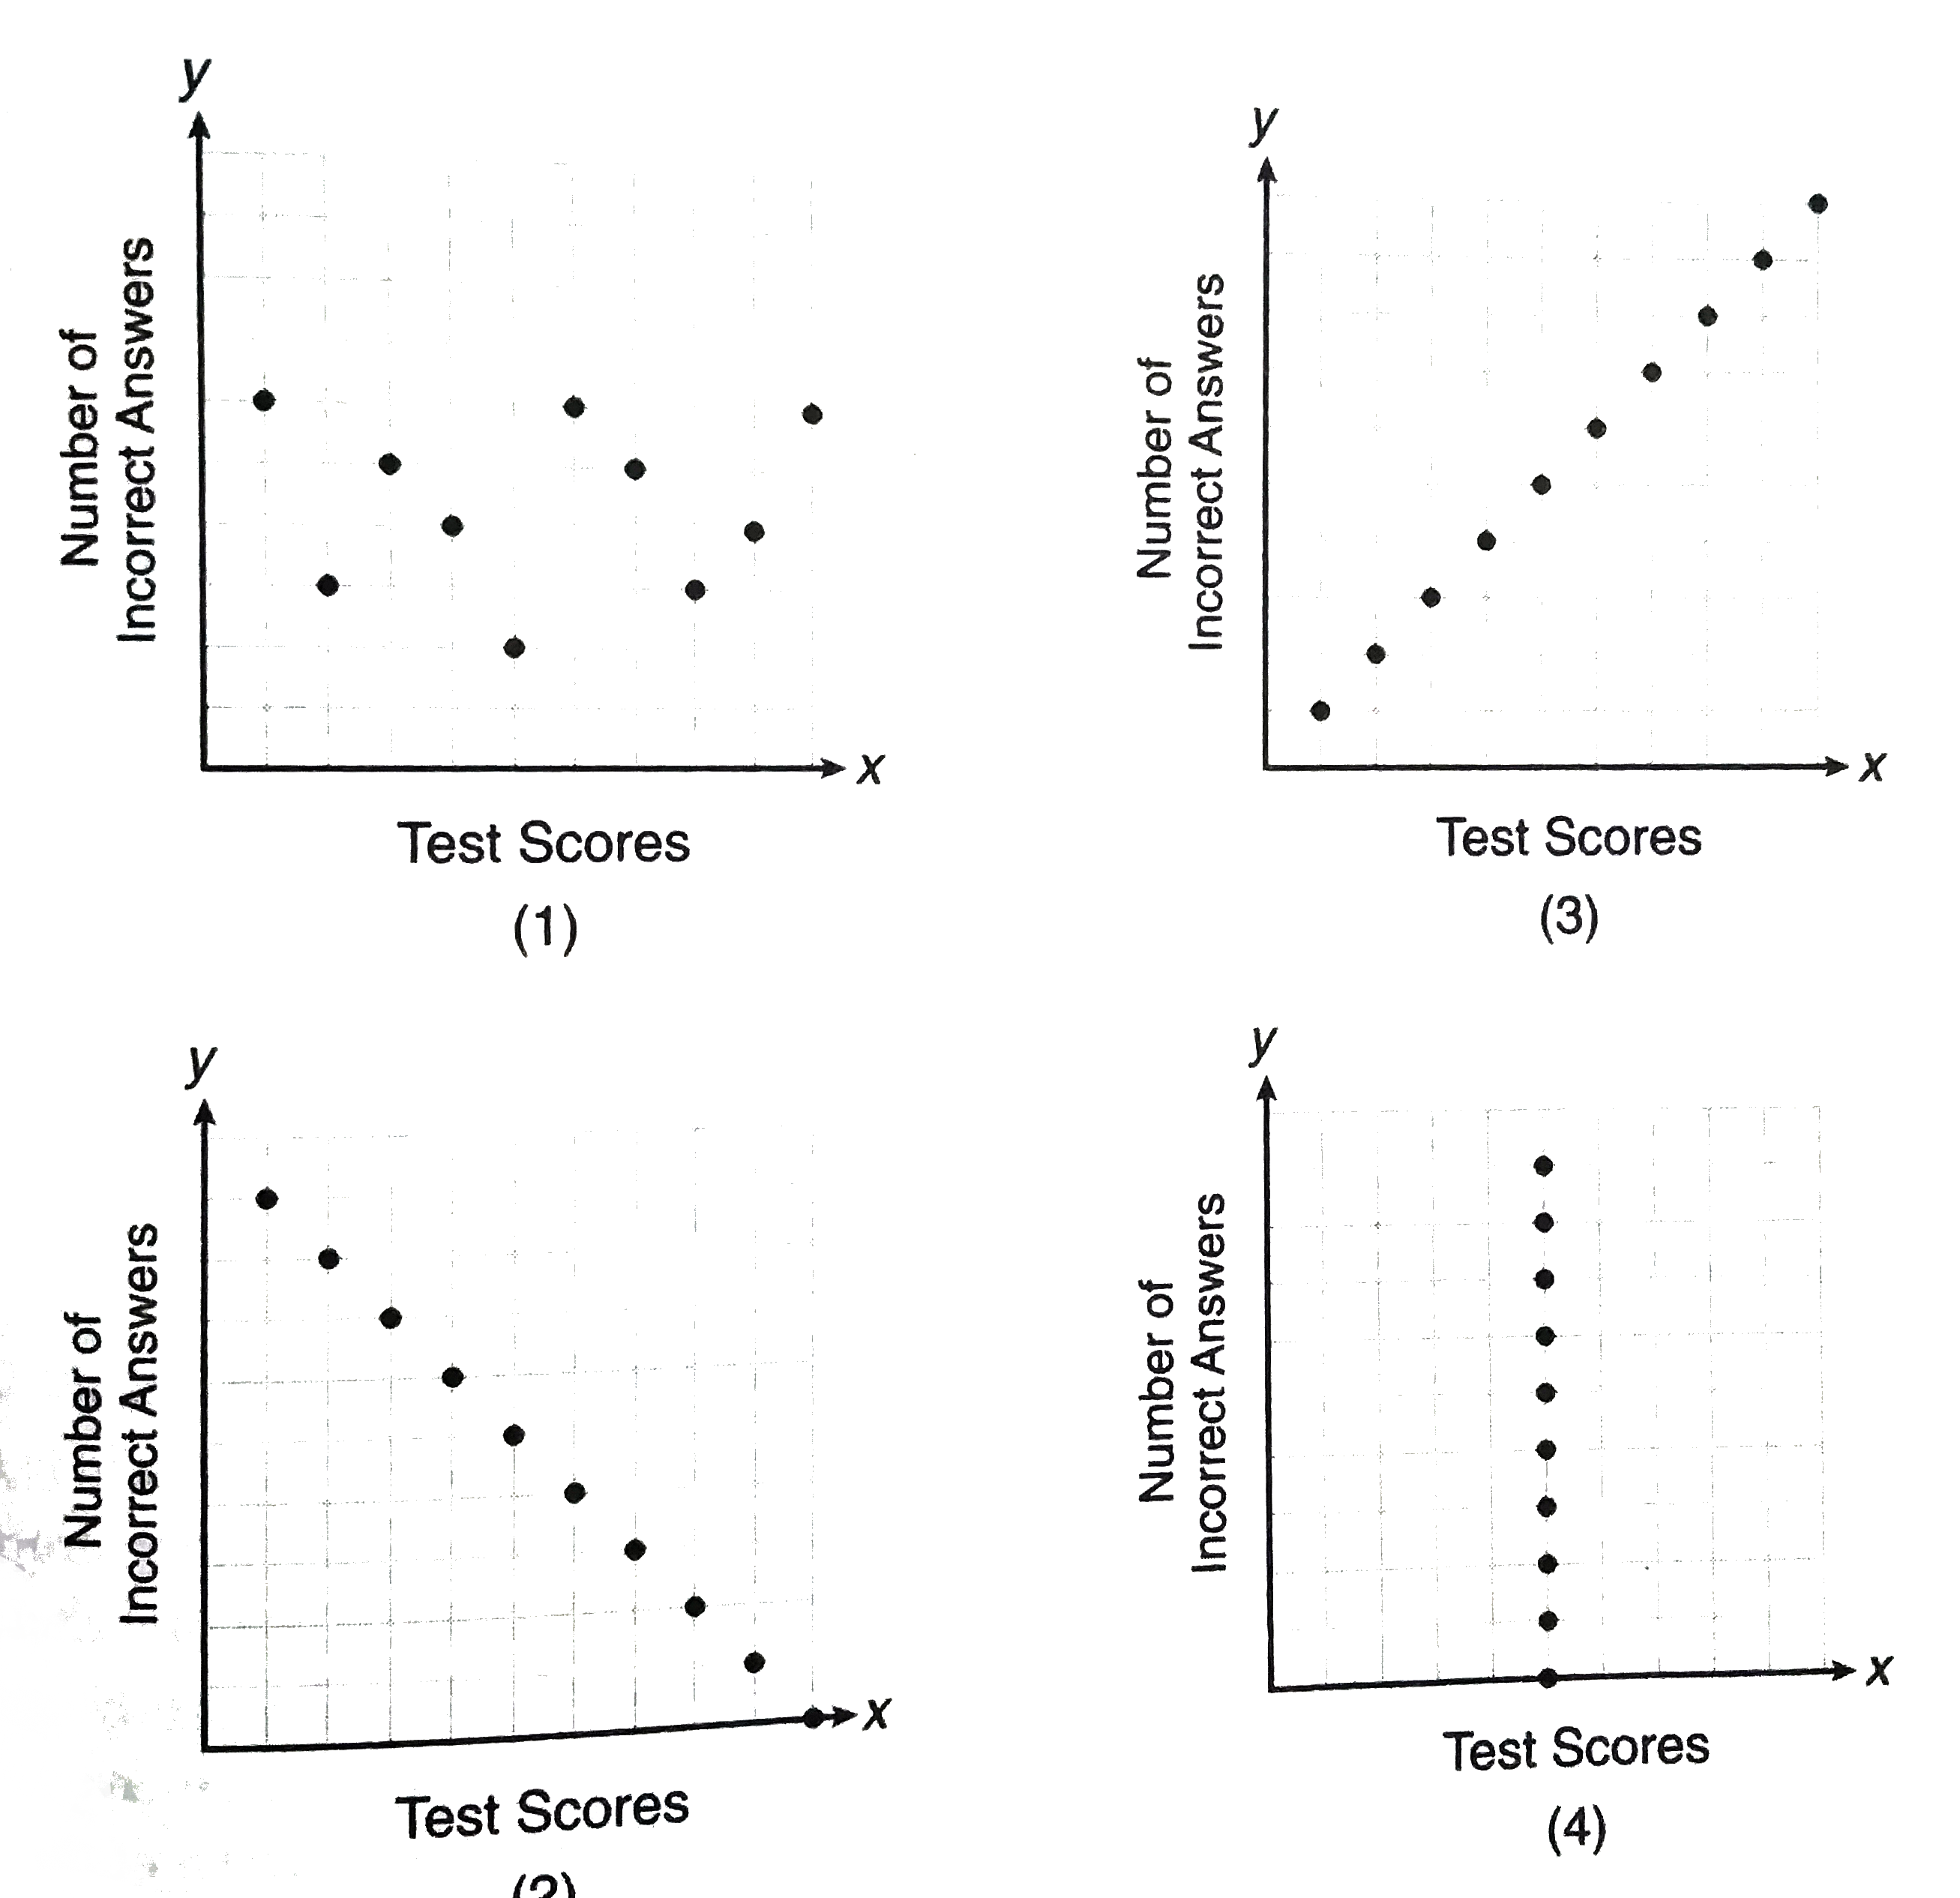
Which of the four graphs above best shows the relationship between x and y if x represents a student score on a test and y represents the number of incorrect answers a student received on the same test?
Graph (1)
Graph (2)
Graph (3)
Graph (4)
The correct Answer is:B
Step by step video, text & image solution for Which of the four graphs above best shows the relationship between x and y if x represents a student score on a test and y represents the number of incorrect answers a student received on the same test? by Maths experts to help you in doubts & scoring excellent marks in Class 12 exams.
Topper's Solved these Questions
Similar Questions
Knowledge Check
- Question 1 - Select One
Which of the following graphs shows a stong positive association between x and y?
A B
B C
C D
D
- Question 2 - Select One
Which of the following graphs represents the soution set for 5x−10y>6 ?
A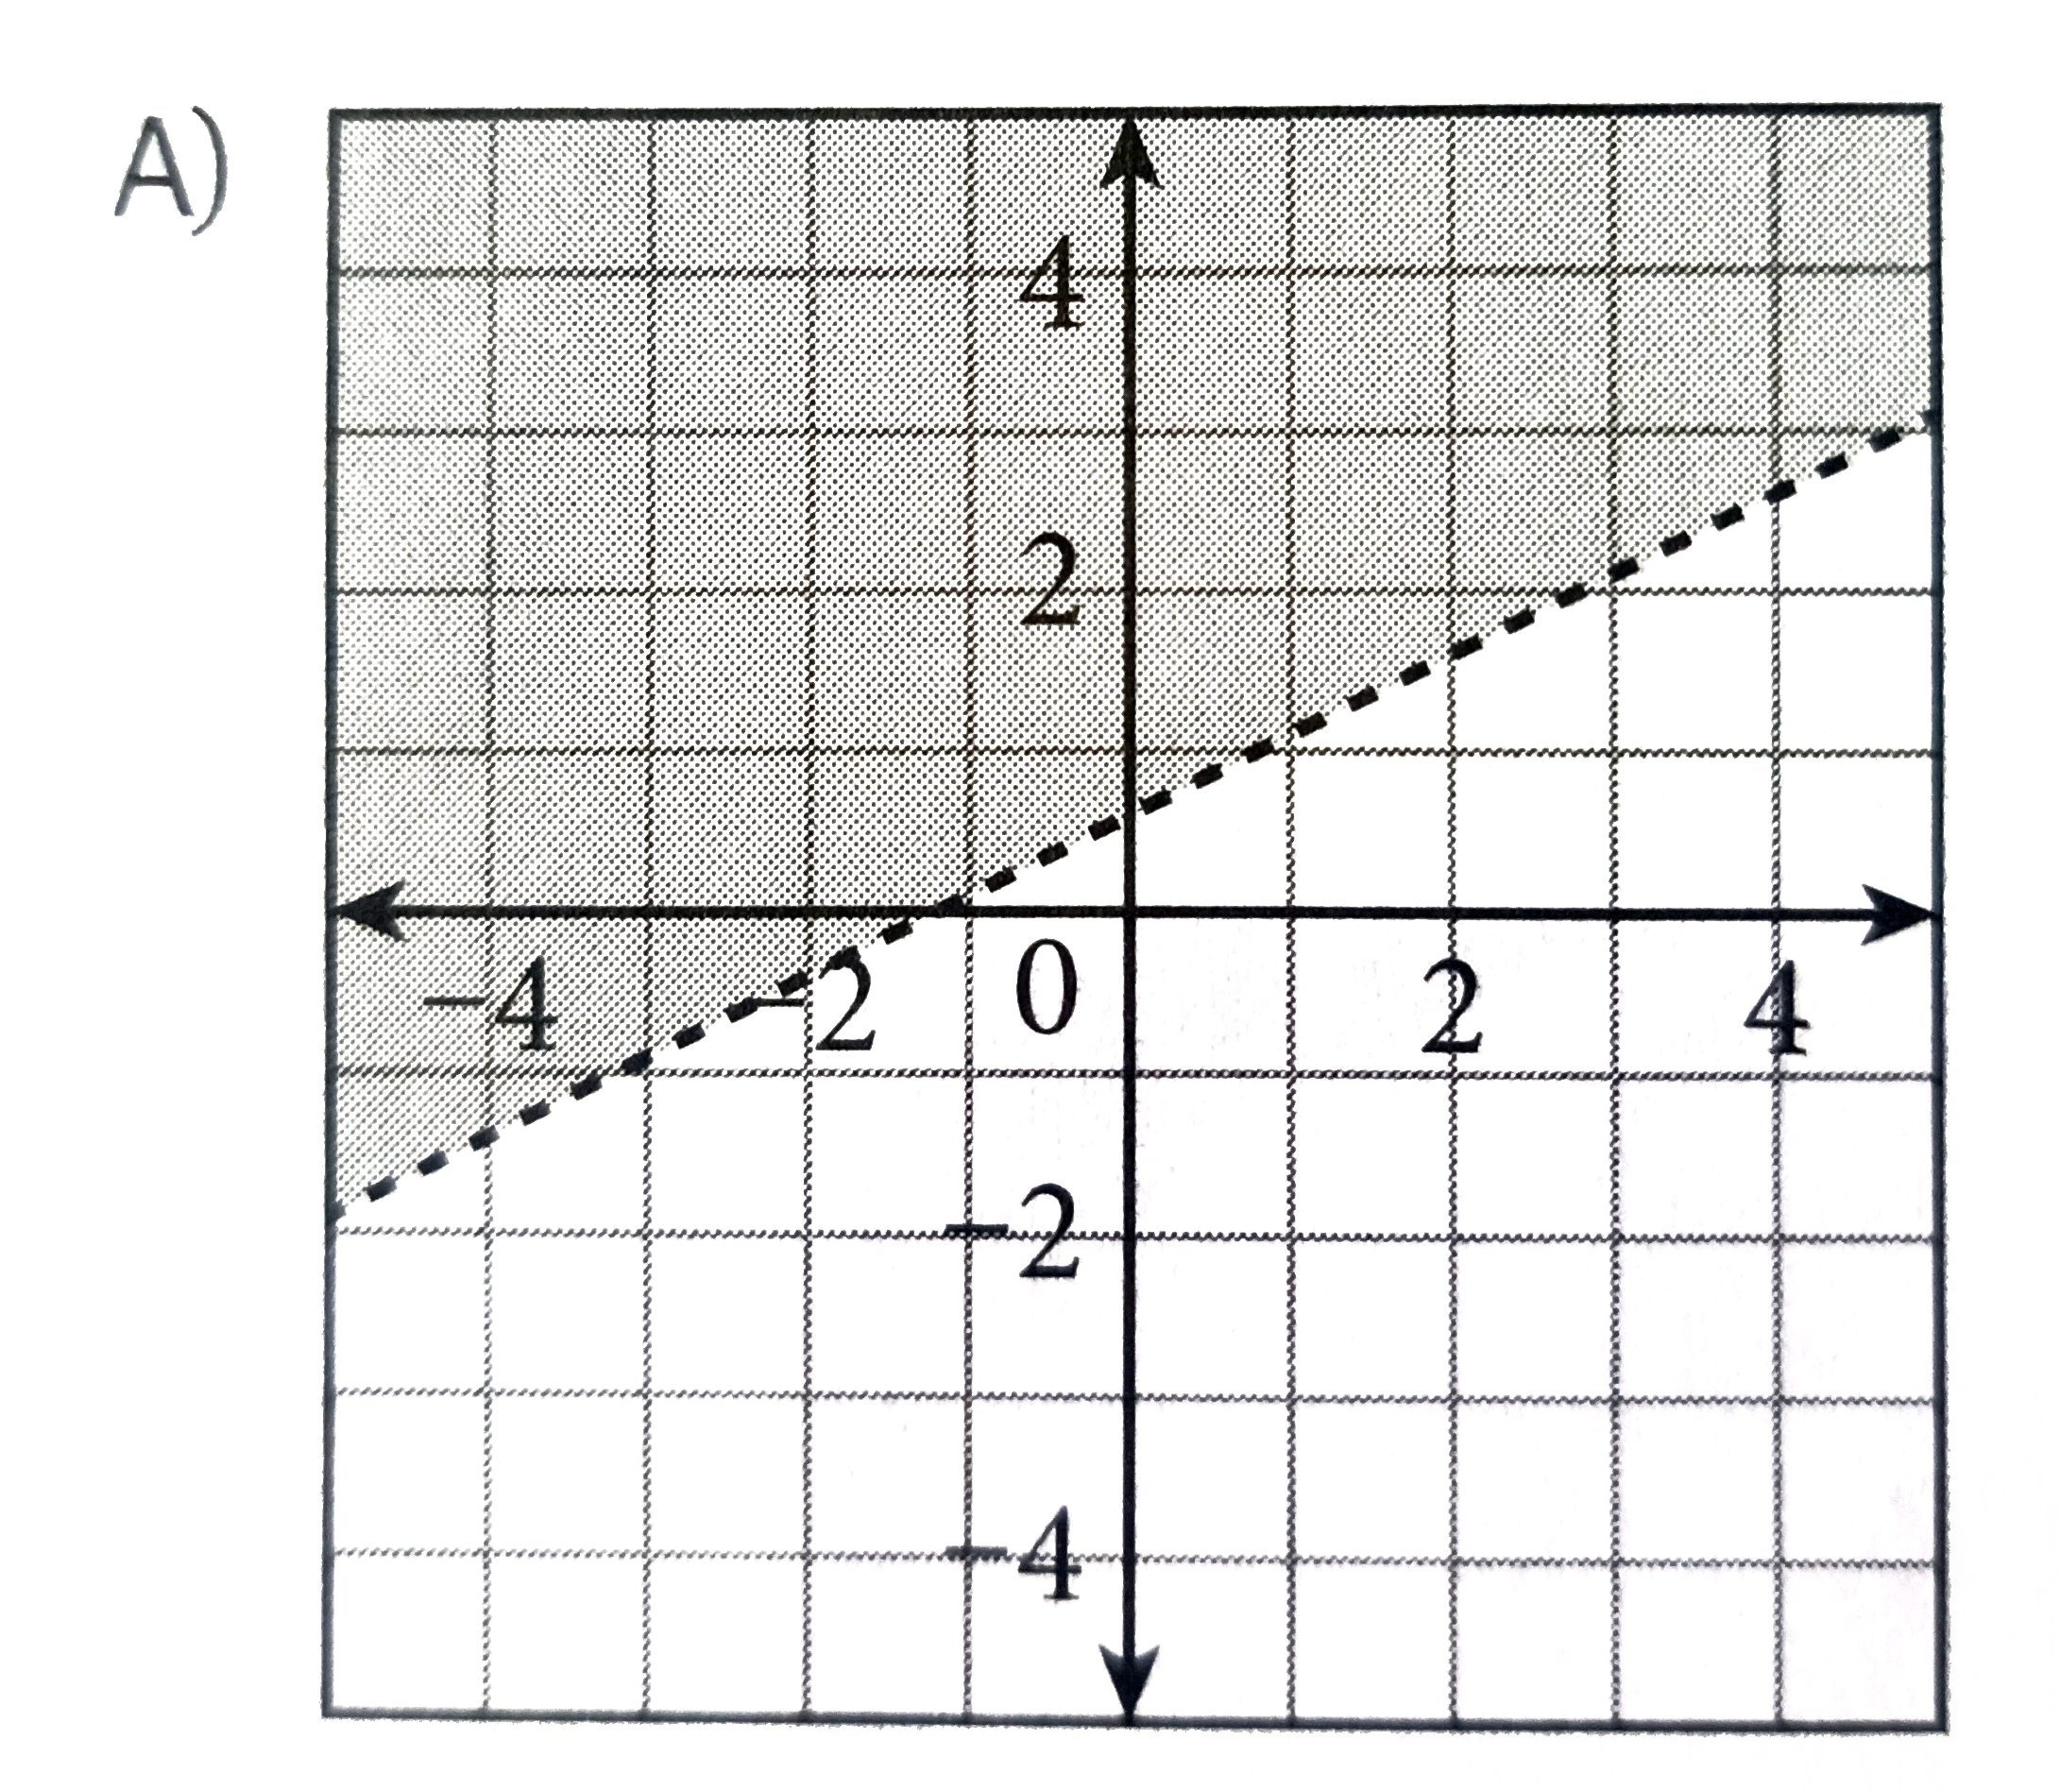 B
B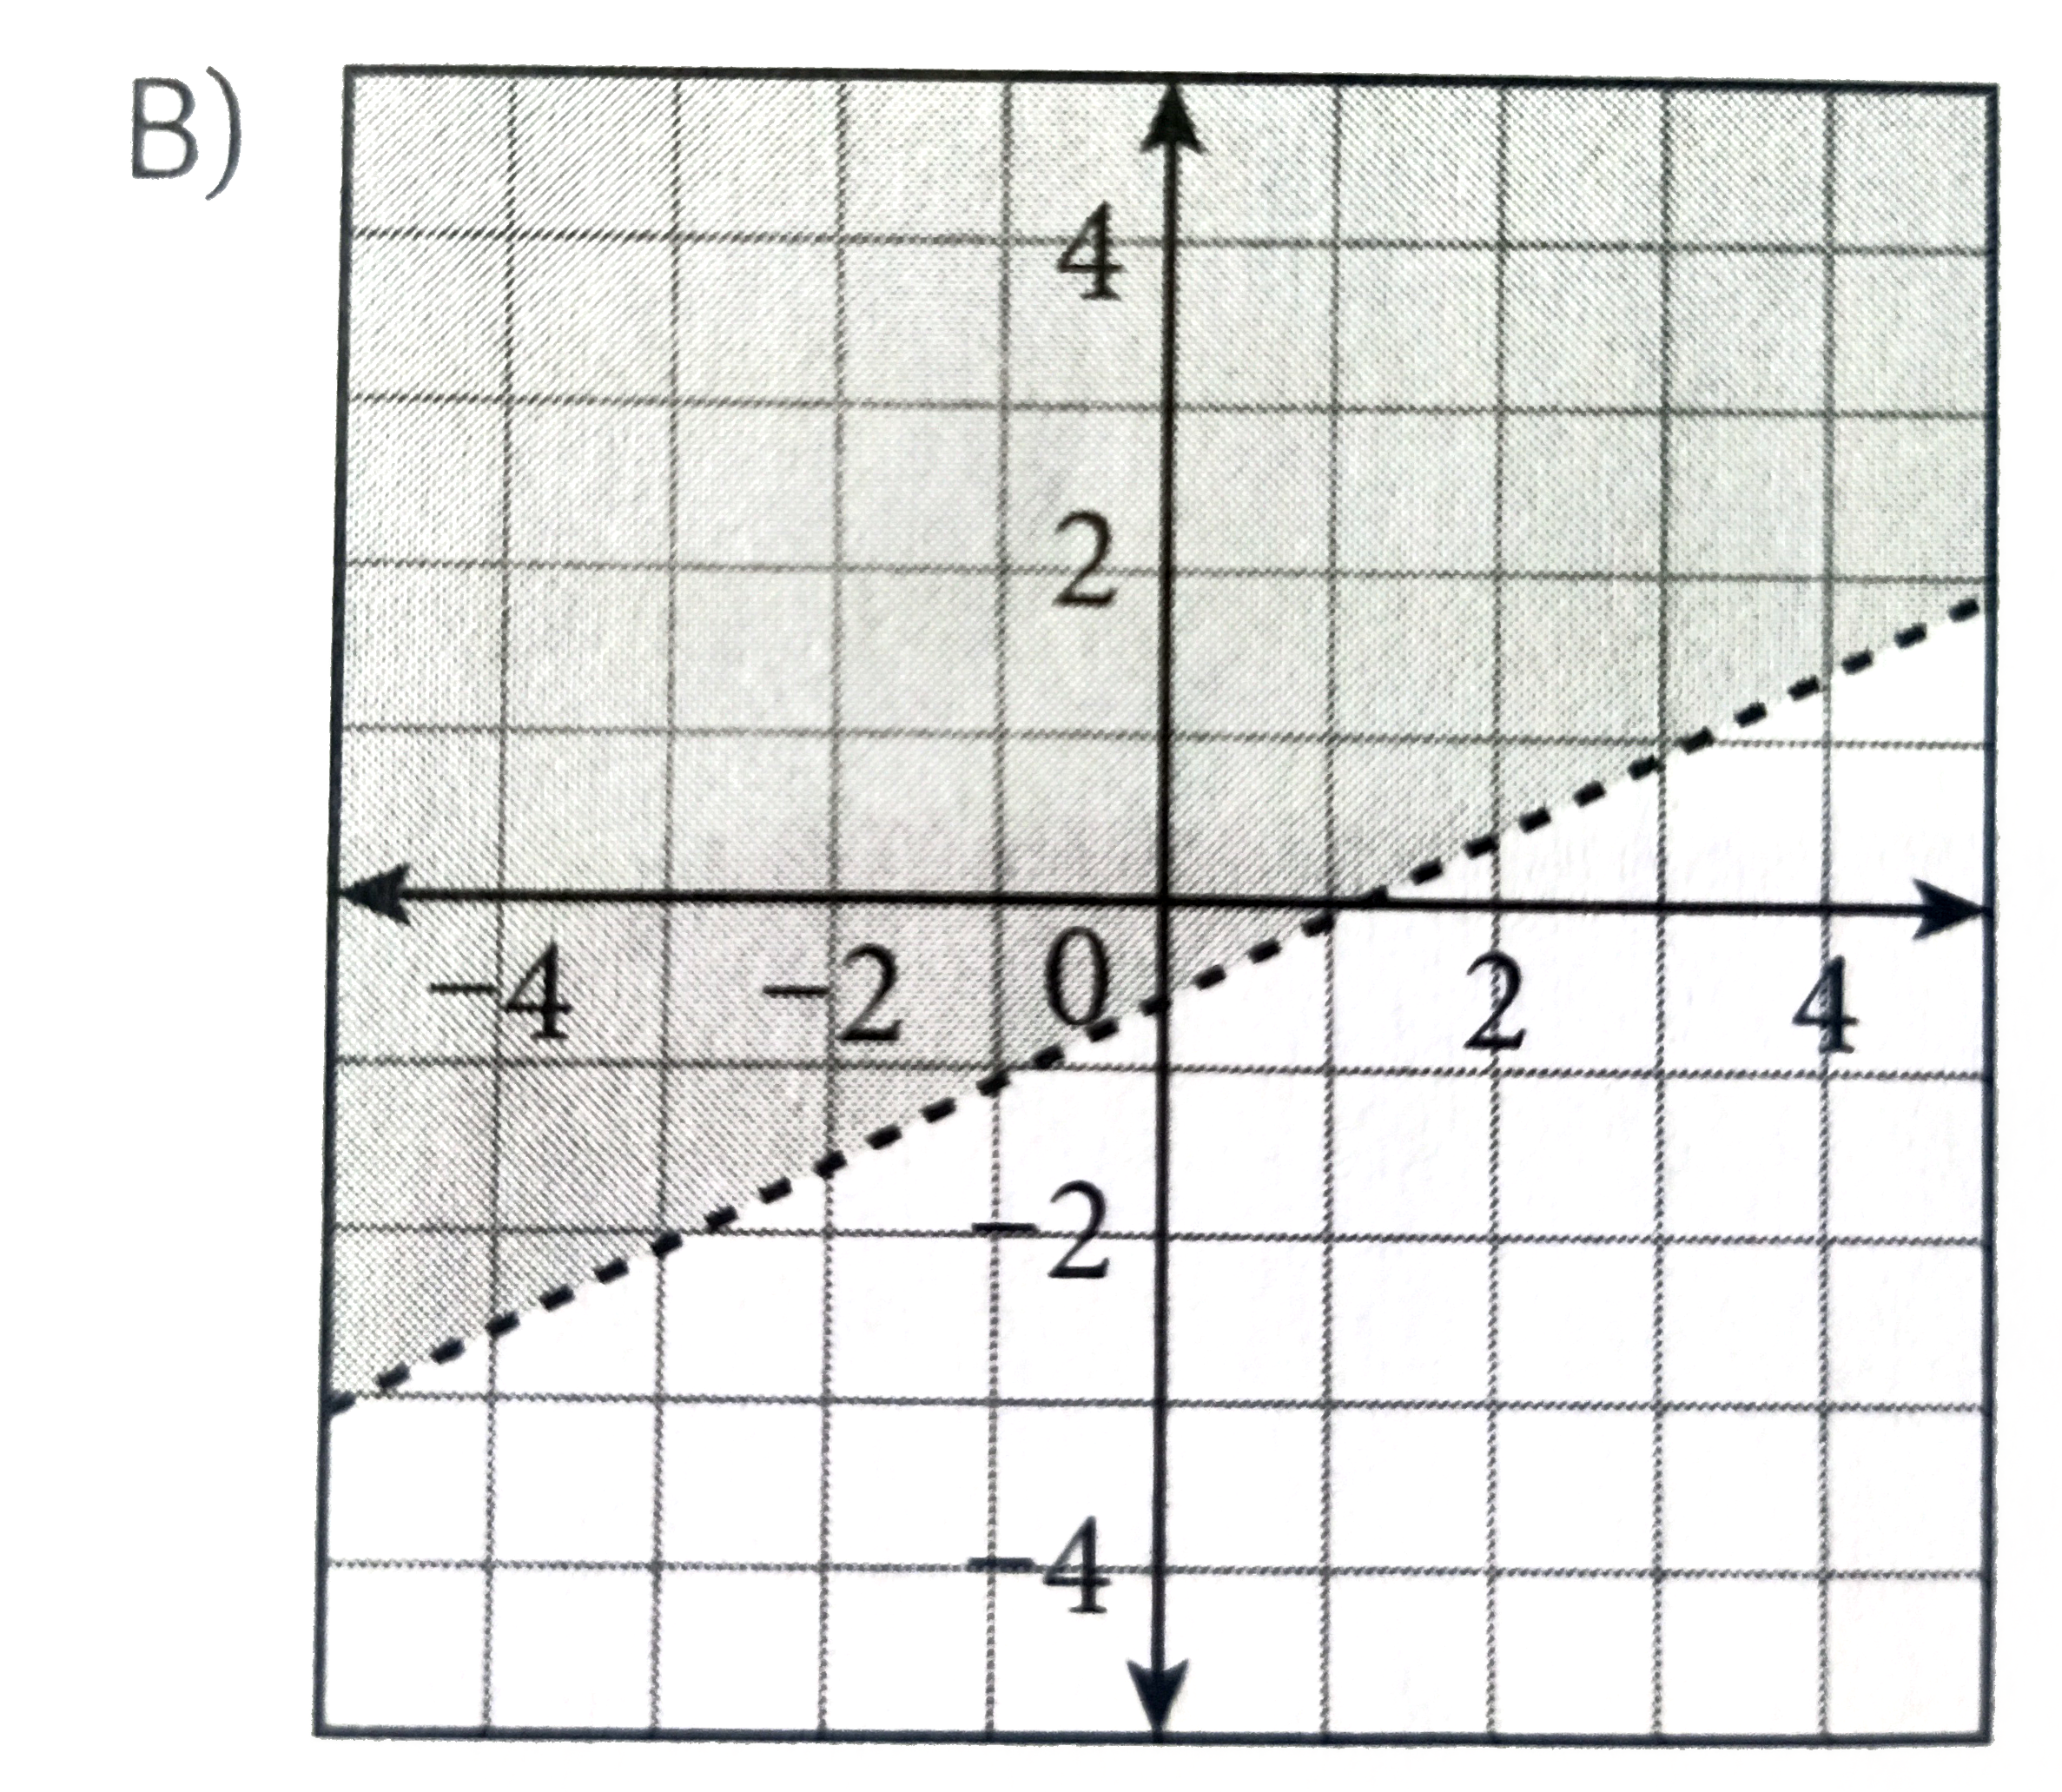 C
C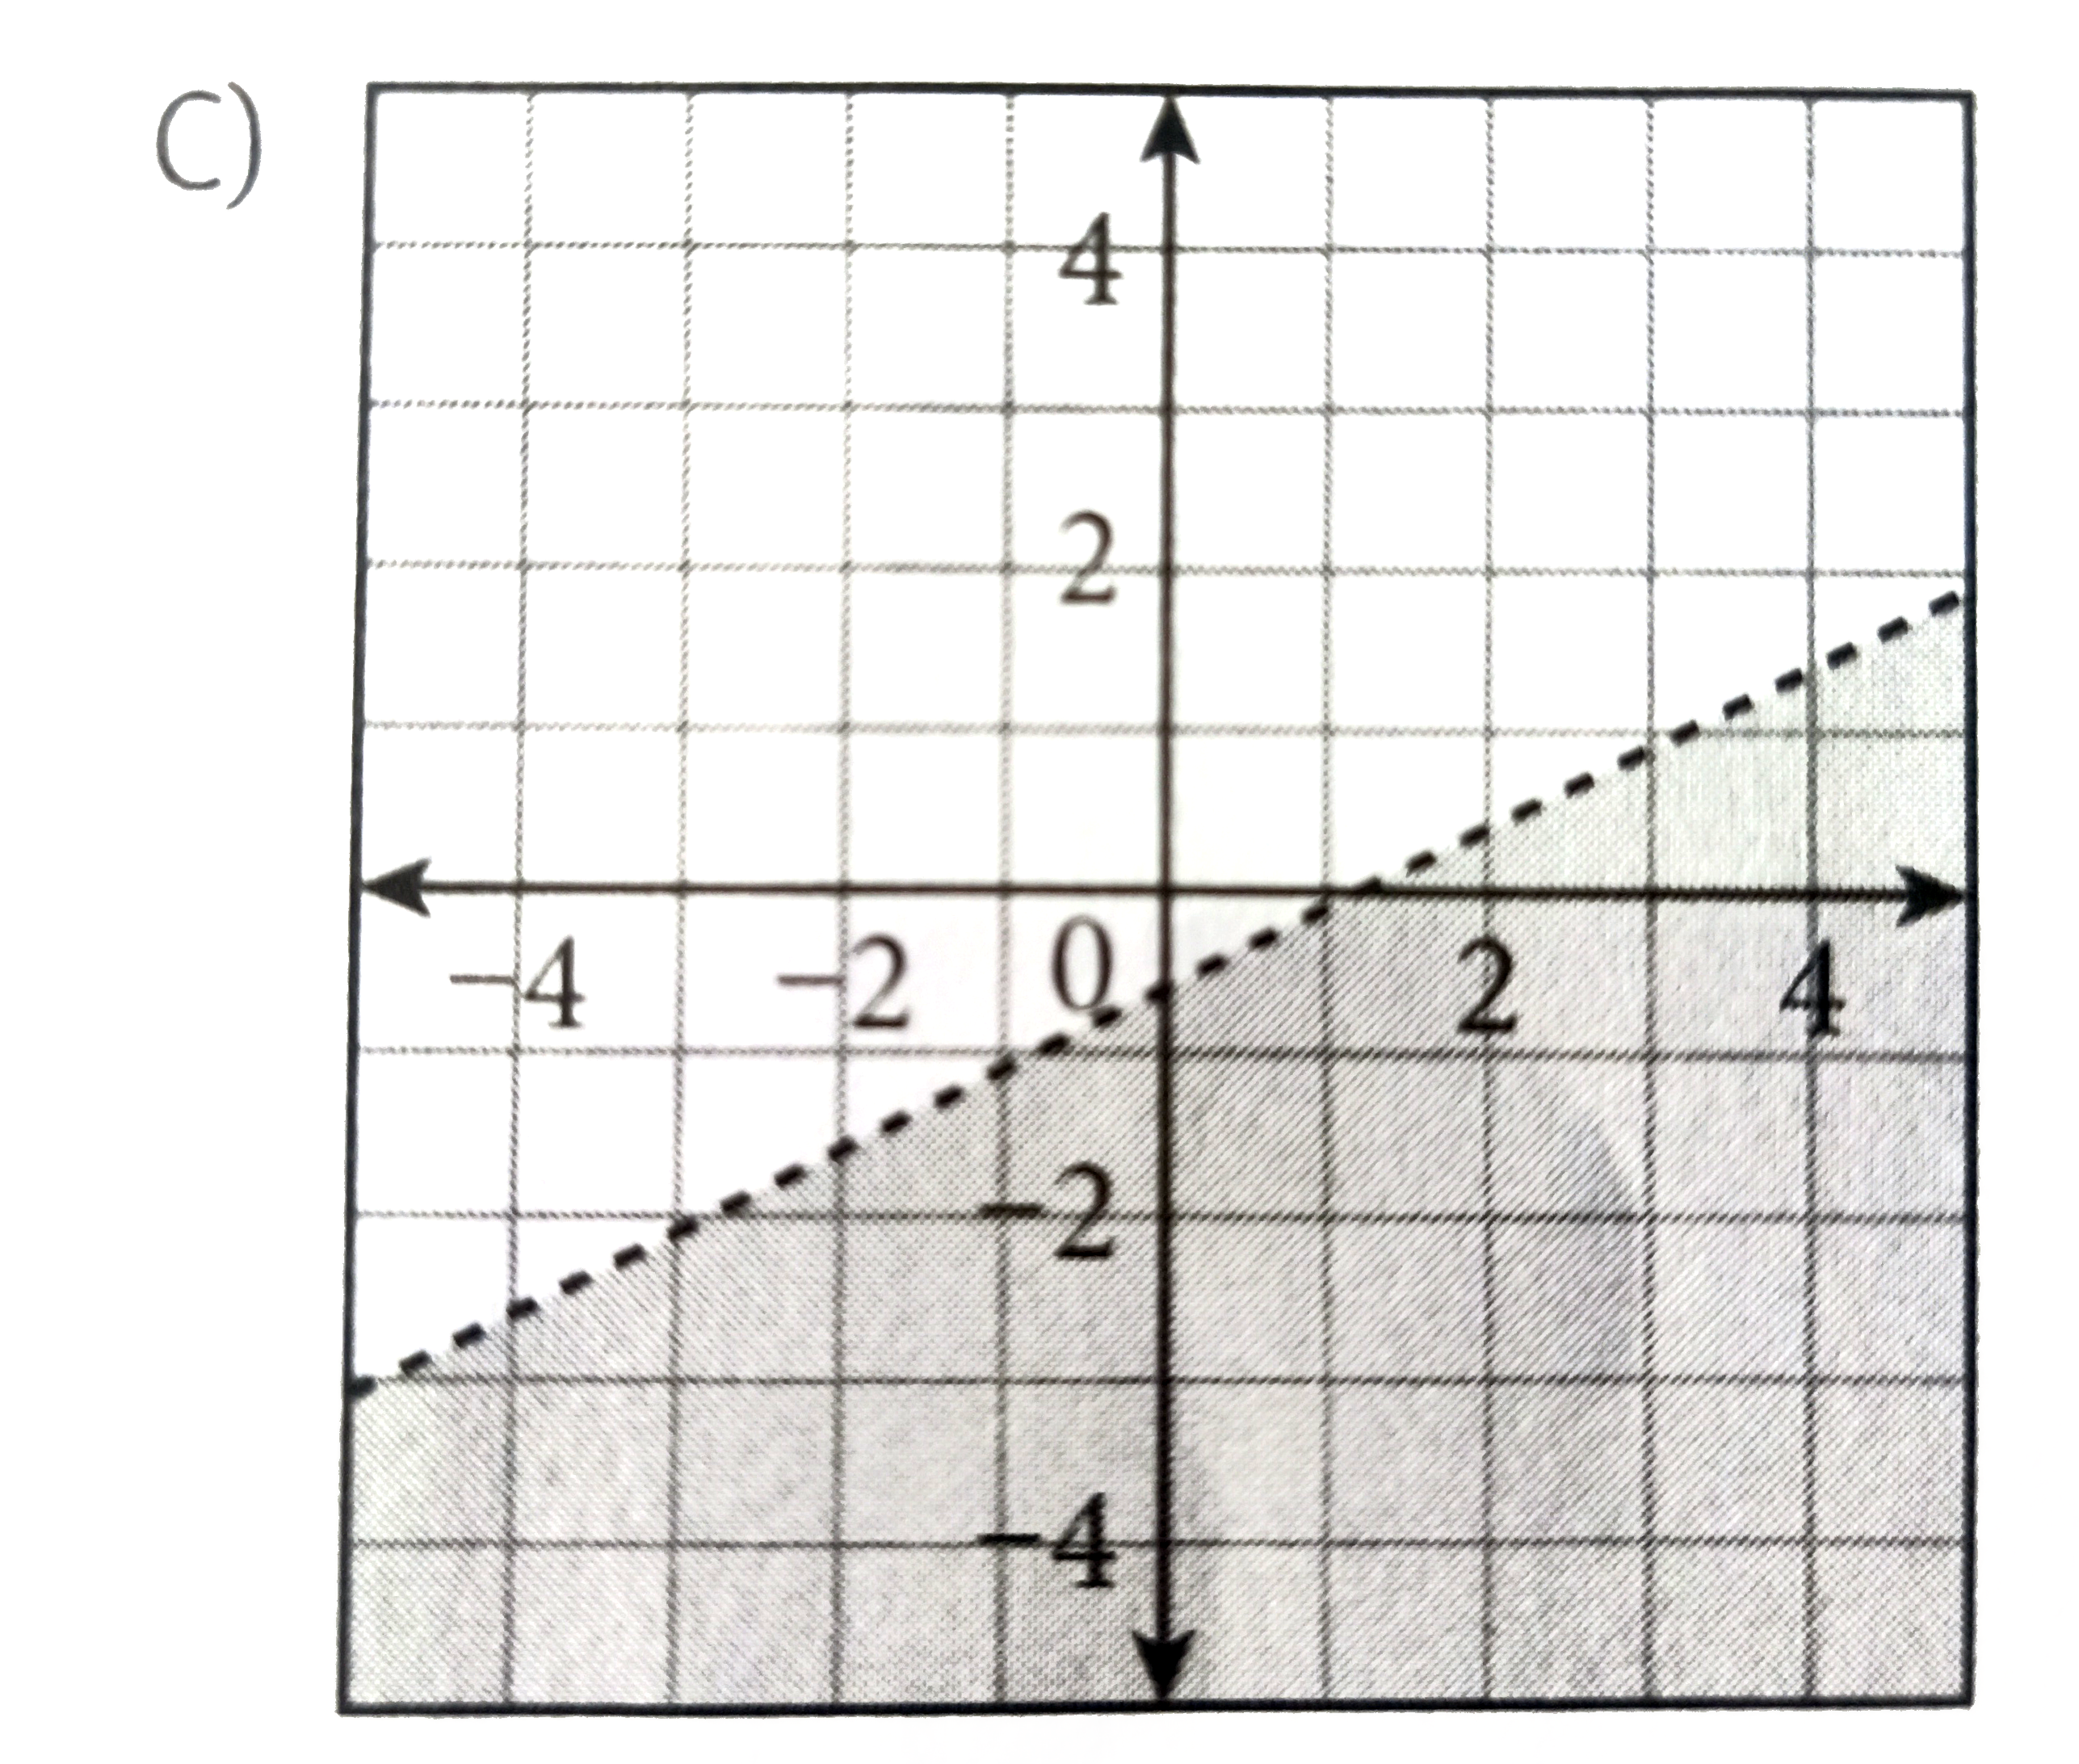 D
D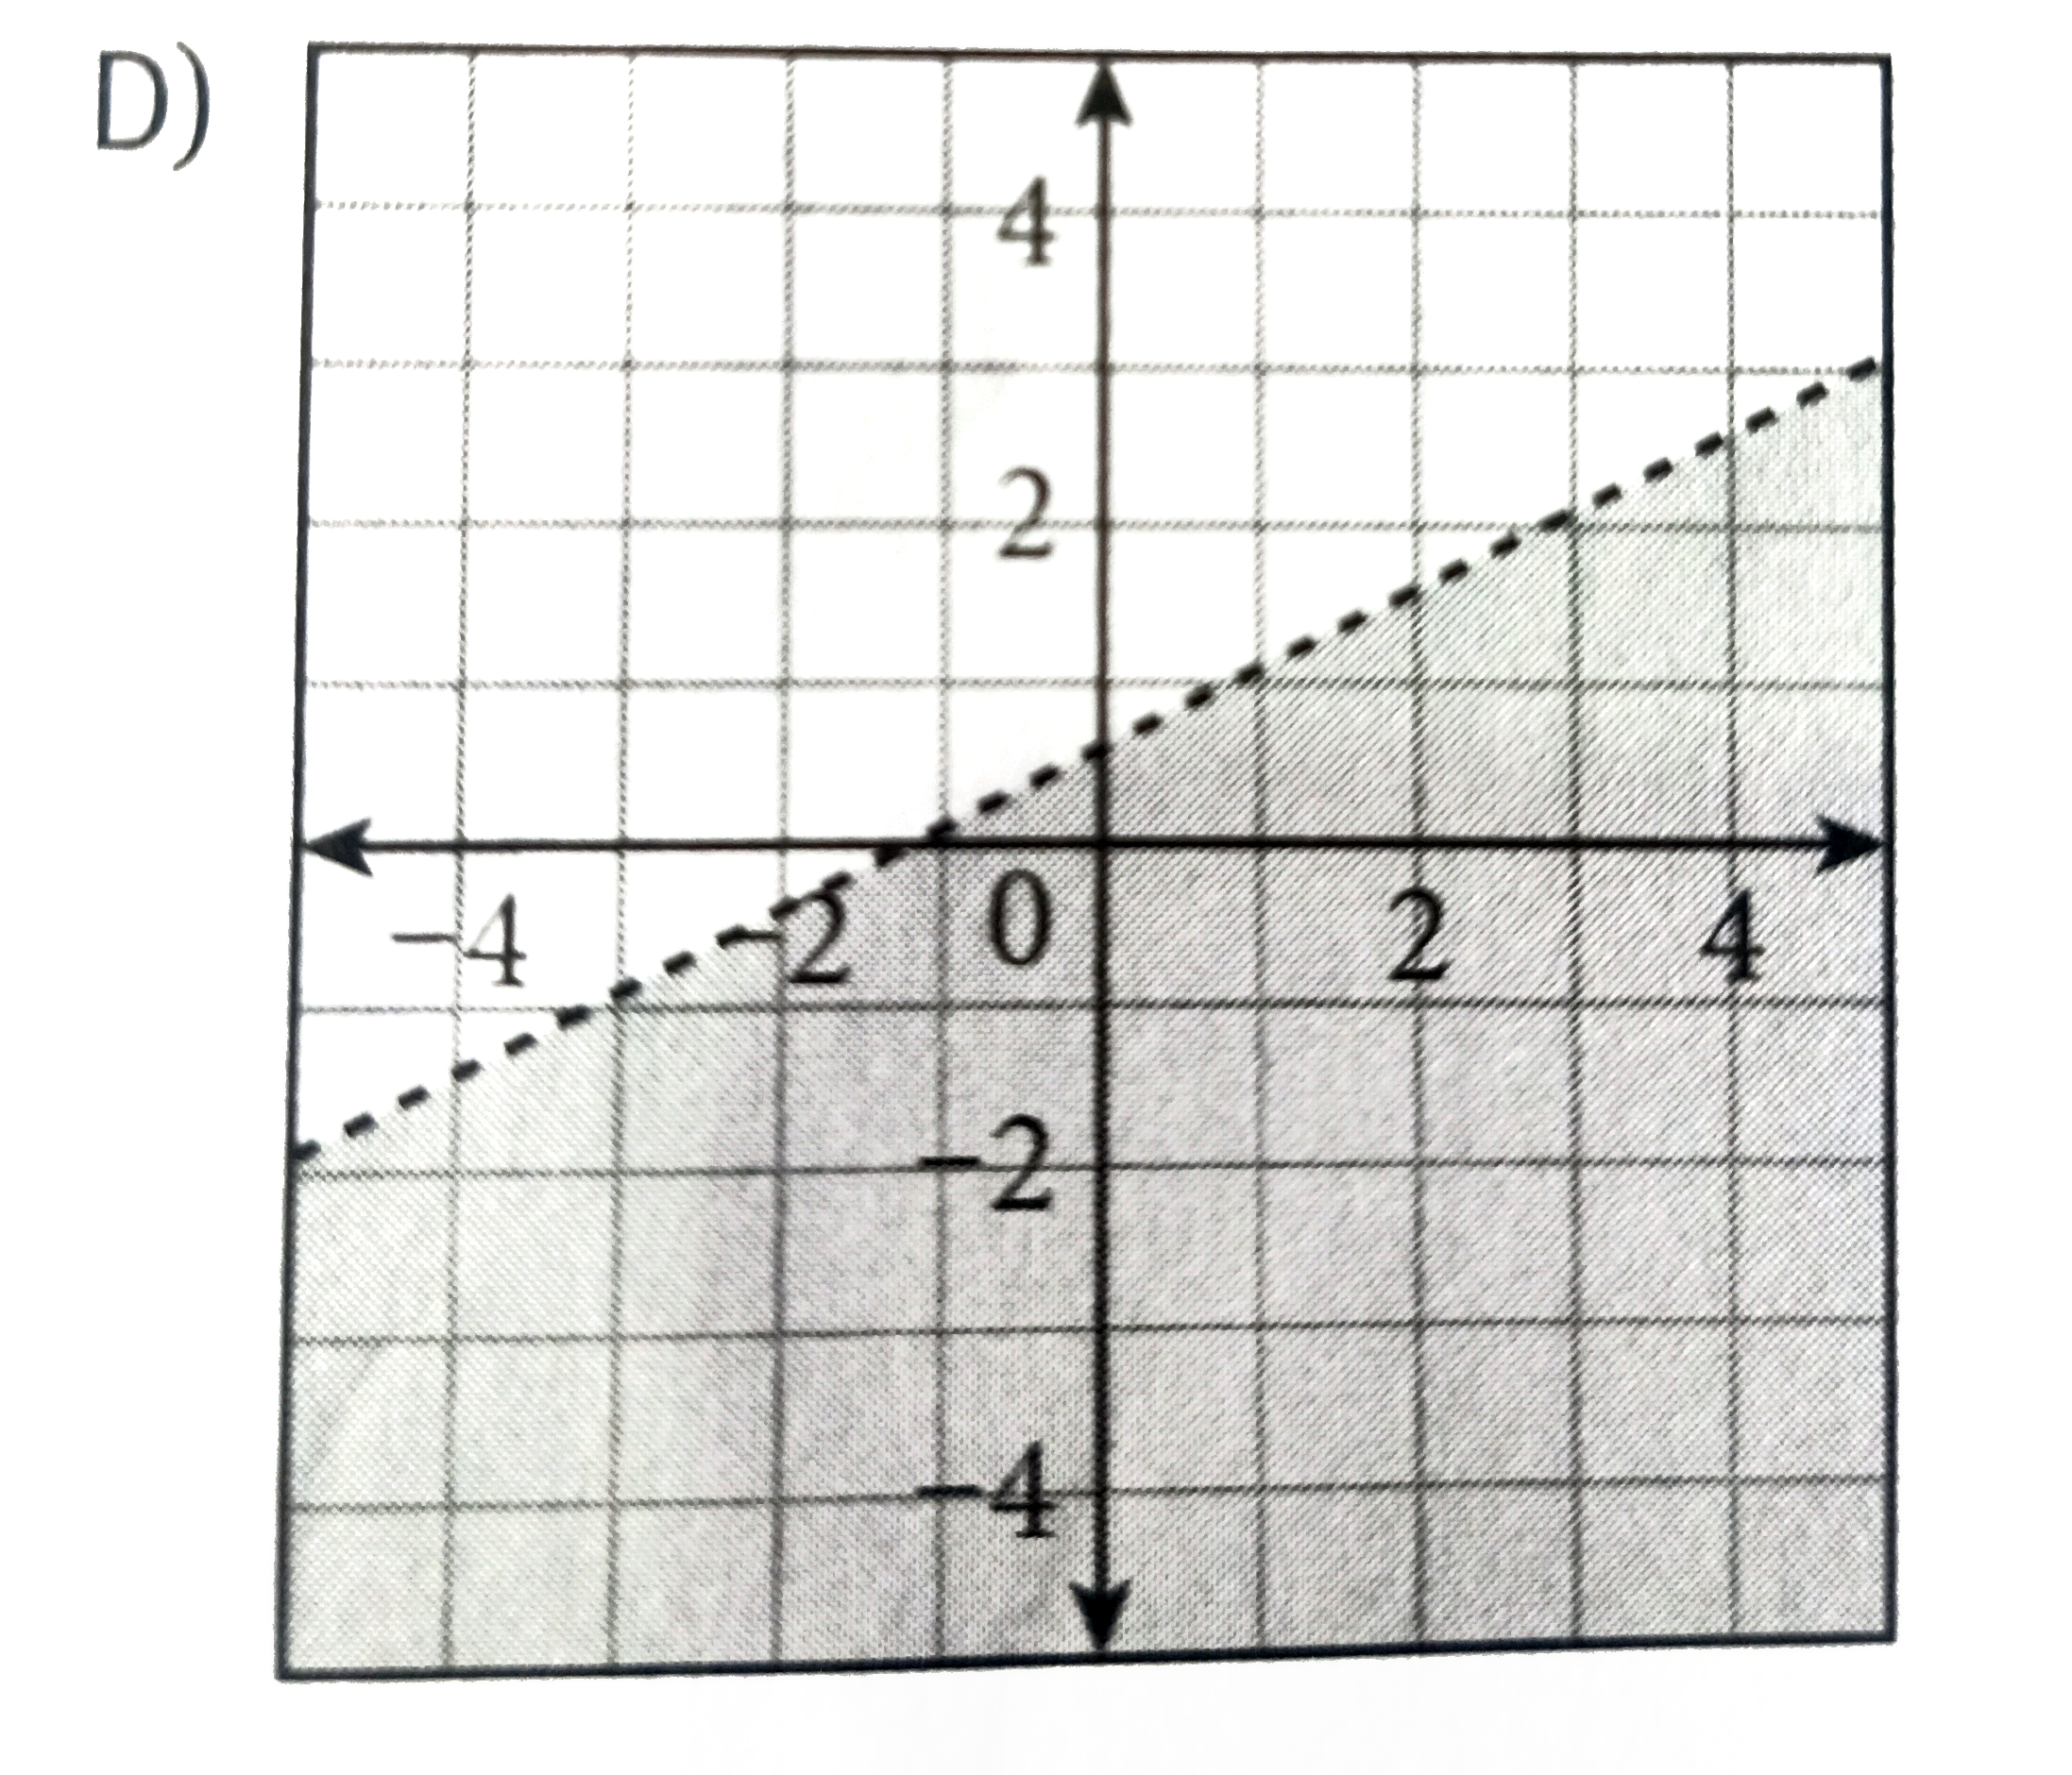
- Question 3 - Select One
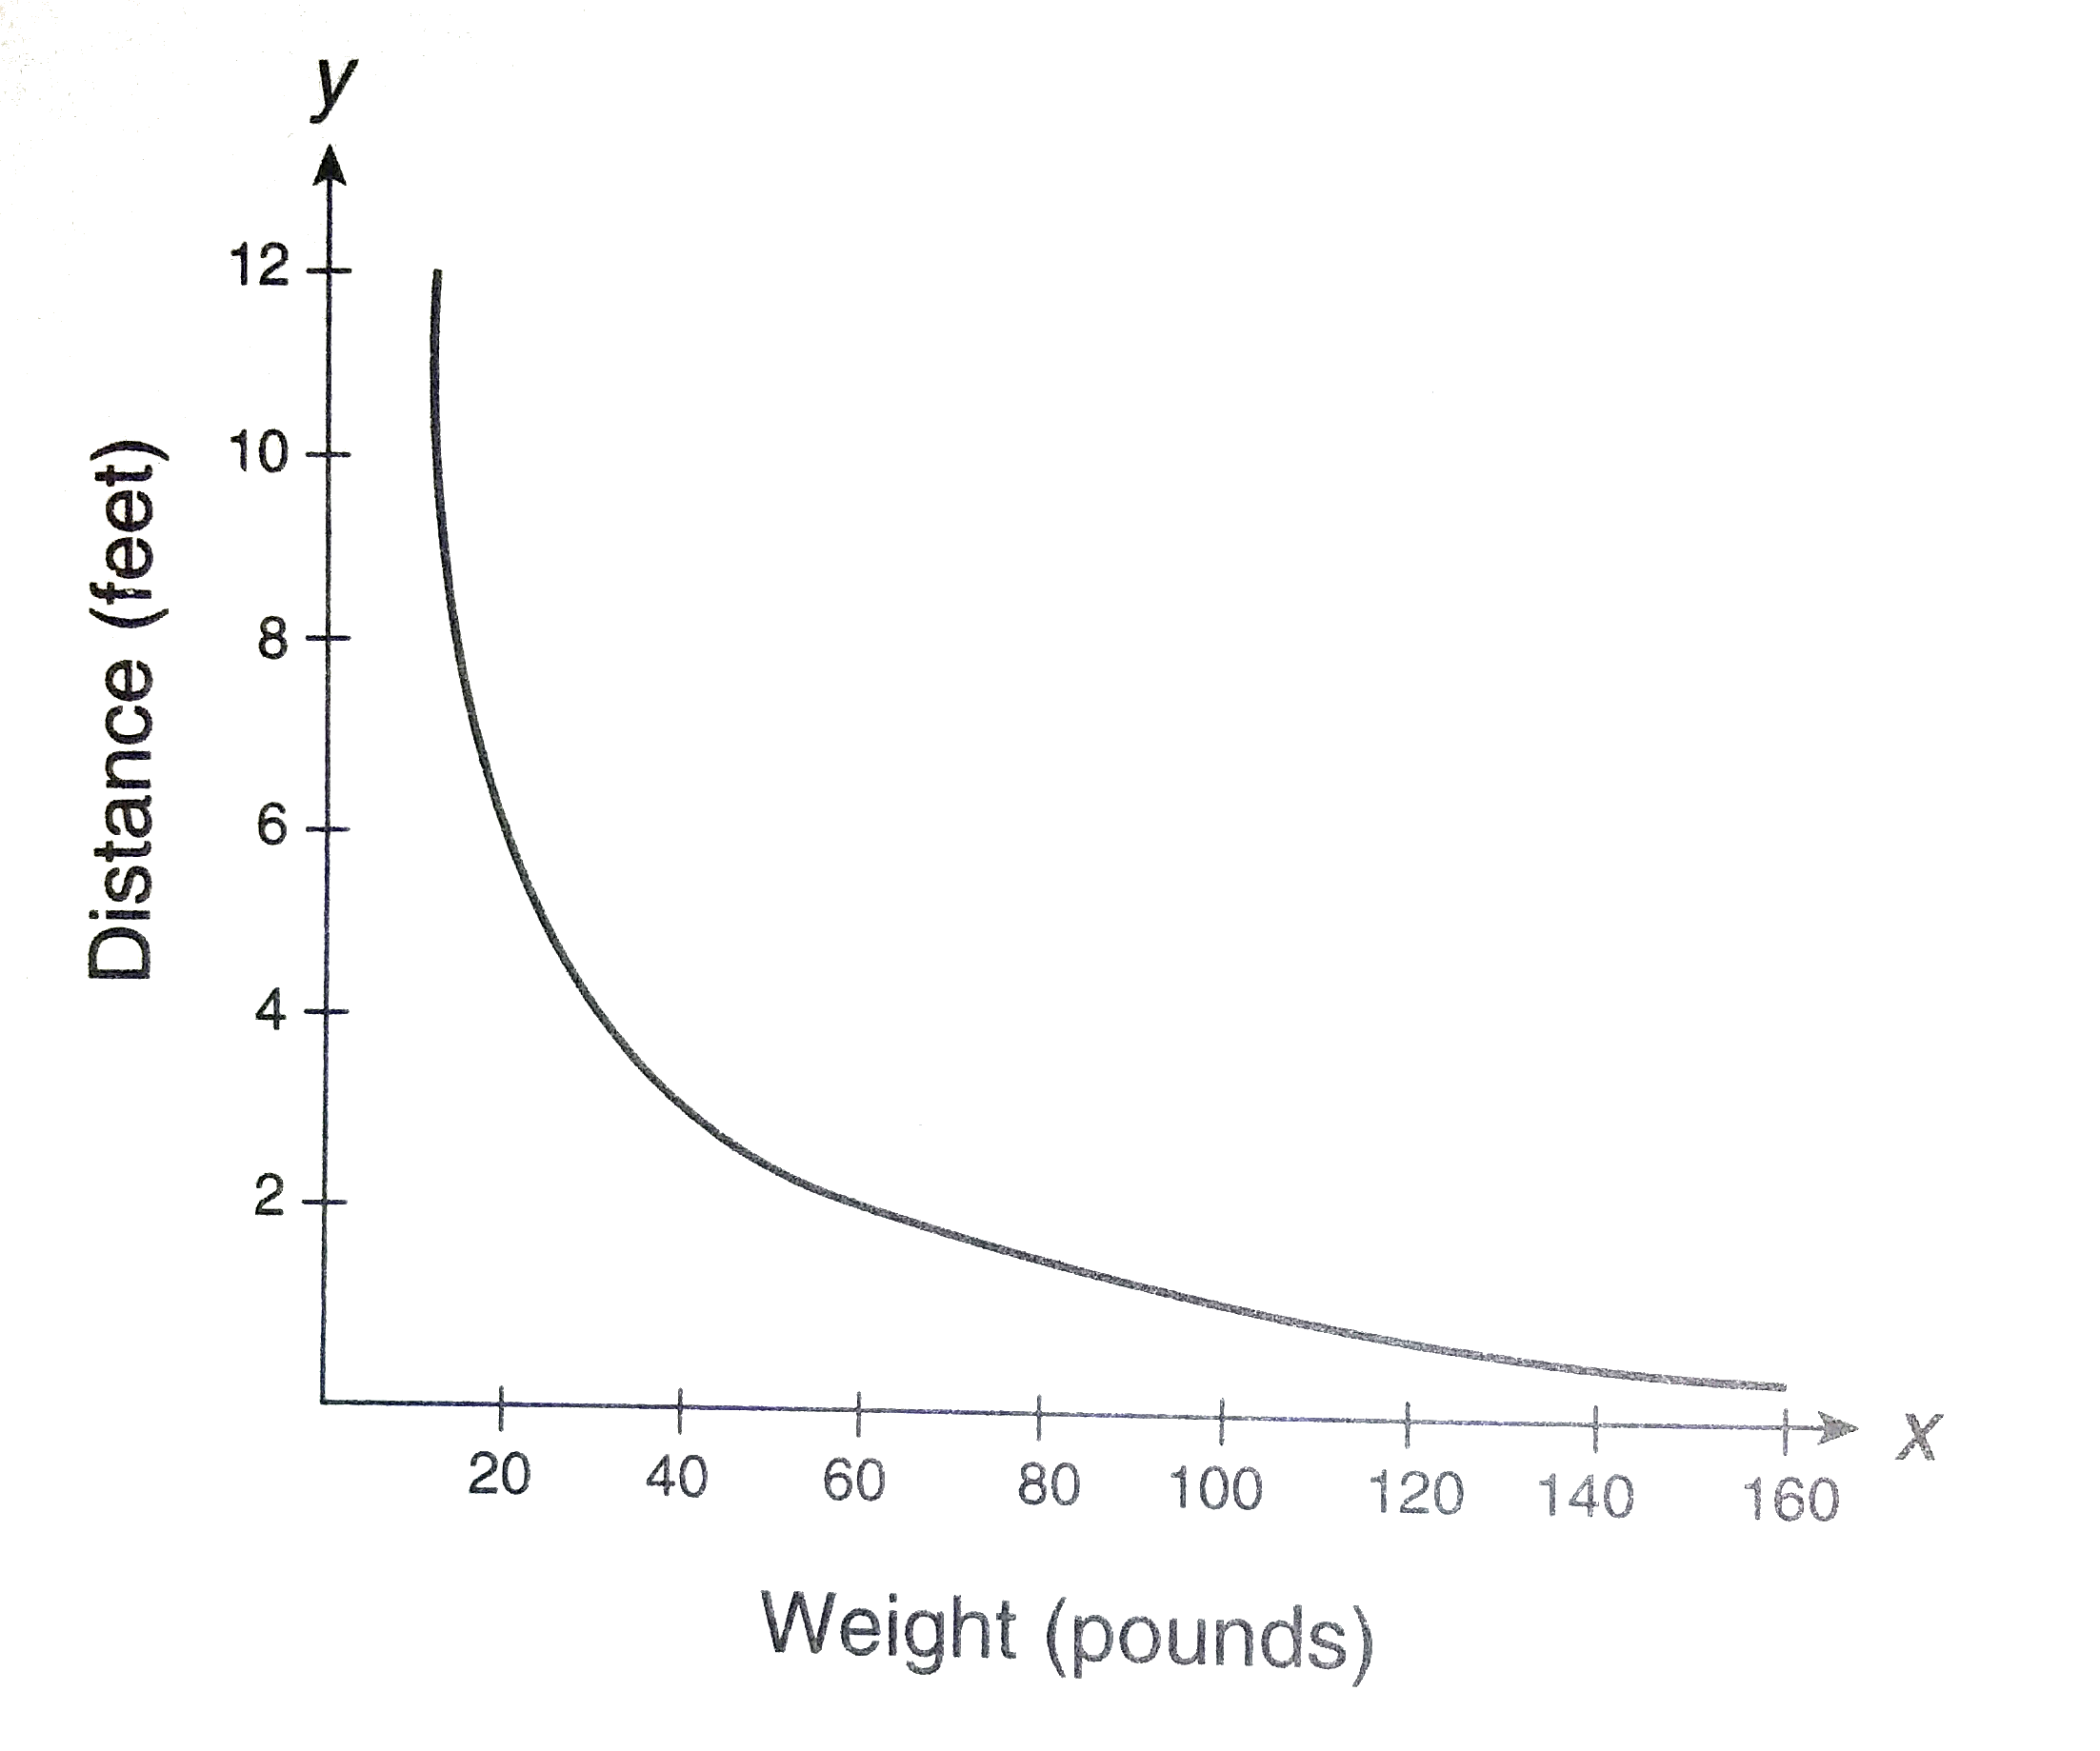
The graph above shows the relationship between a person's weight and the distance that the person must sit from the center of seesaw to make it balanced. Which of the following best represents the equation of this graph?Ay=12x2By=−120xCy=120(12)xDy=120x
Which of the following graphs best represents the variation of acceleration 'a' with displacement x?
View SolutionThe equation √x=2y, represents that graph between x and y is a :-
View Solution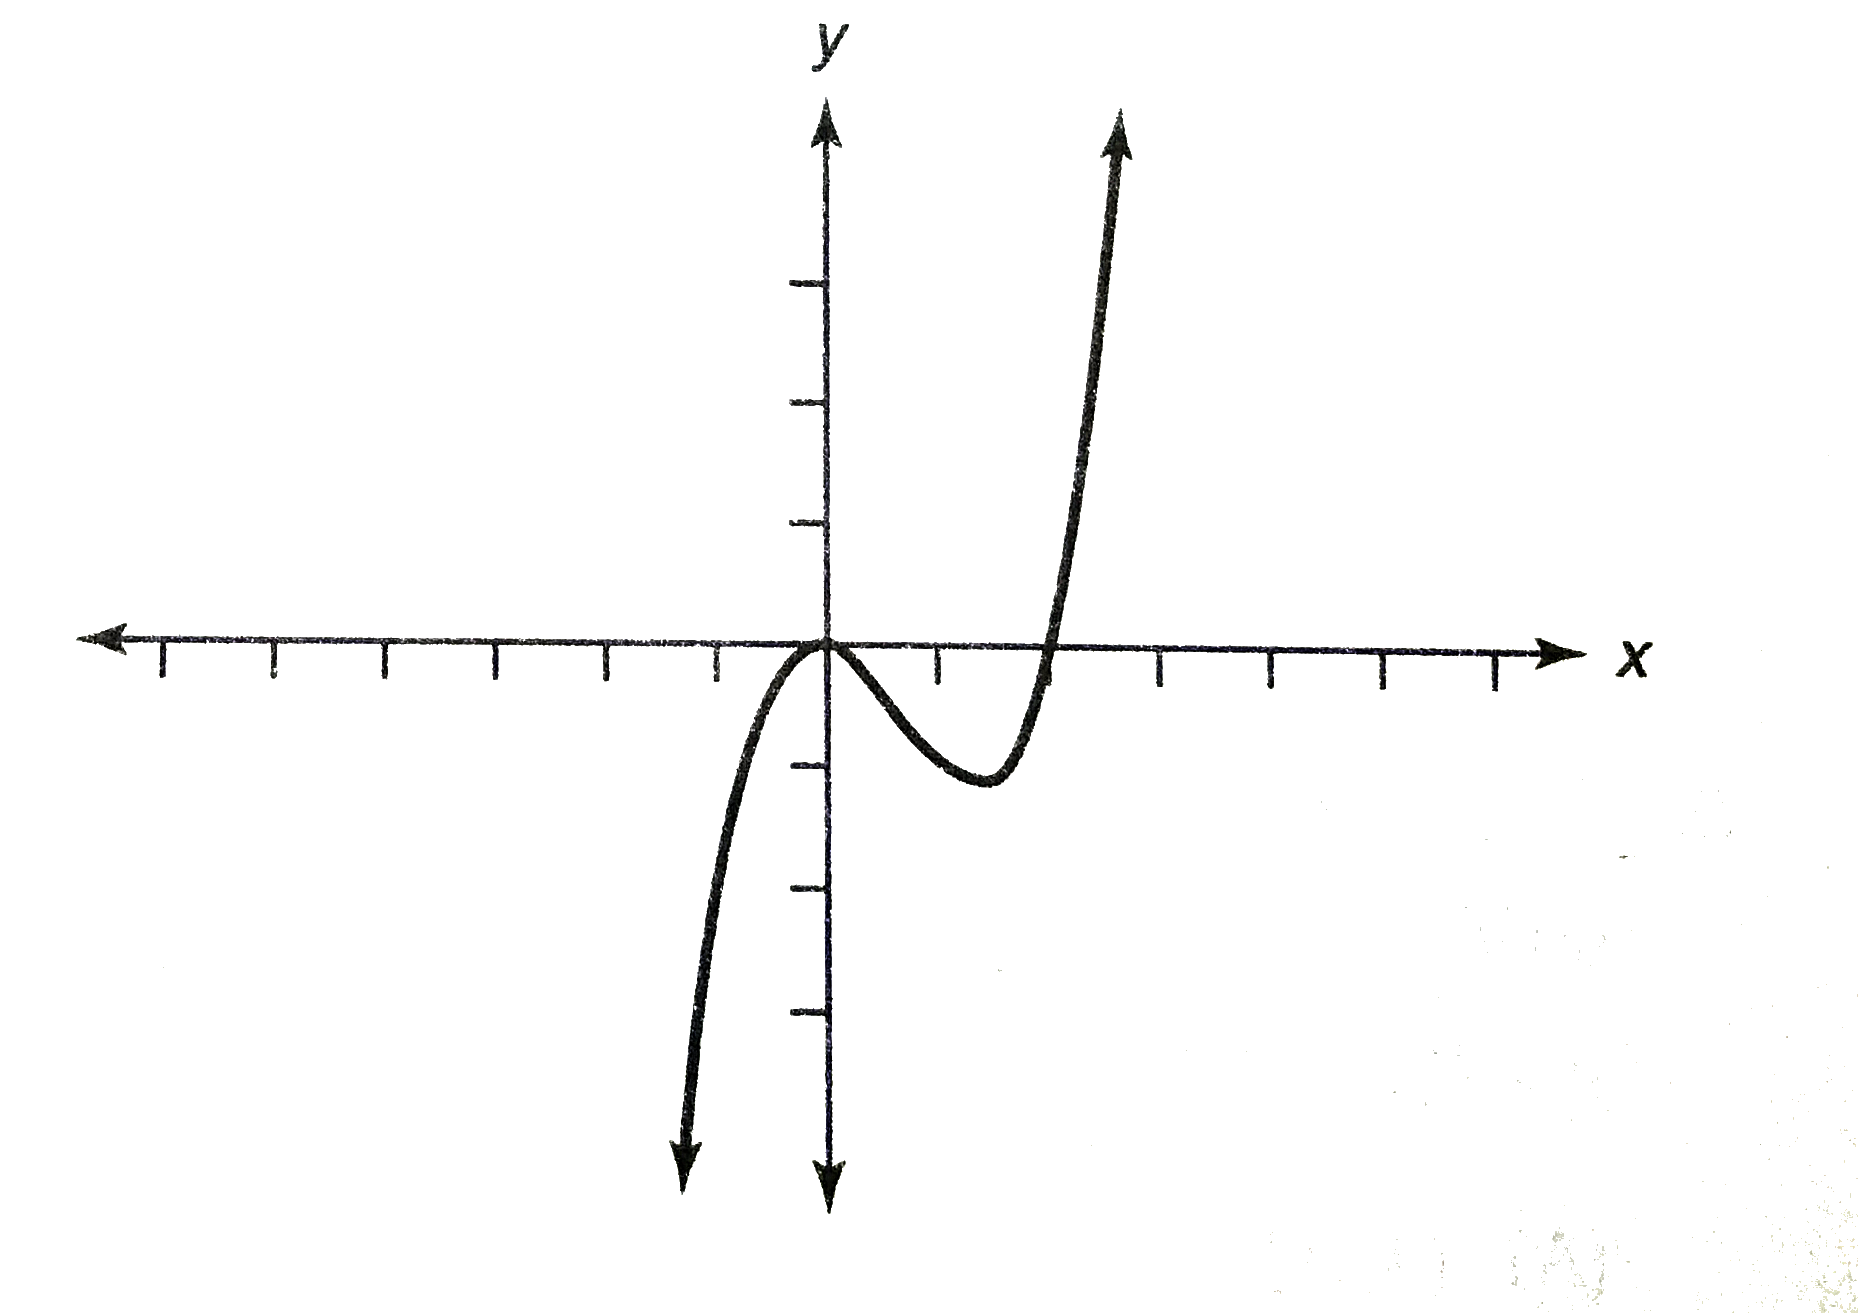
The figure above shows the graph of function f. If g(x)=−f(x), which graph represents function g?View Solution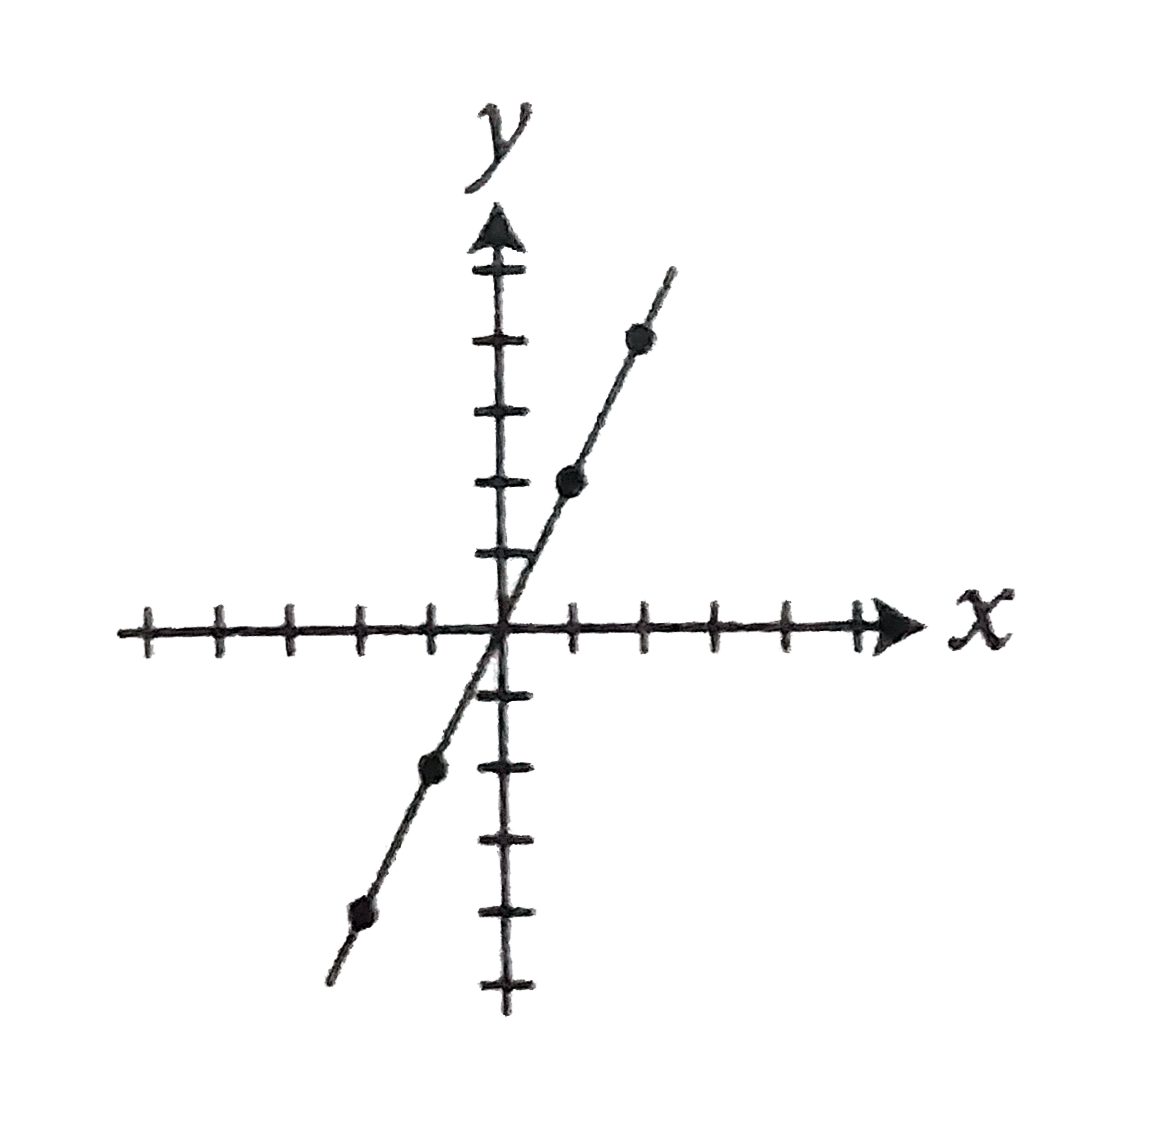
The graph above shows y=2x. Which of the following graphs represents y=|2x|?View SolutionTickets to the annual Follies Show at Littleton High School are $4 for adults and $2.50 for students. There is a cost of $750 to produce the show. If the x-axis represents the number of adult tickets sold and the y-axis represents the number of student tickets sold, which graph represents all the possible combinations of ticket sales that allow the junior class to at least cover the cost of the show ?
View Solution

