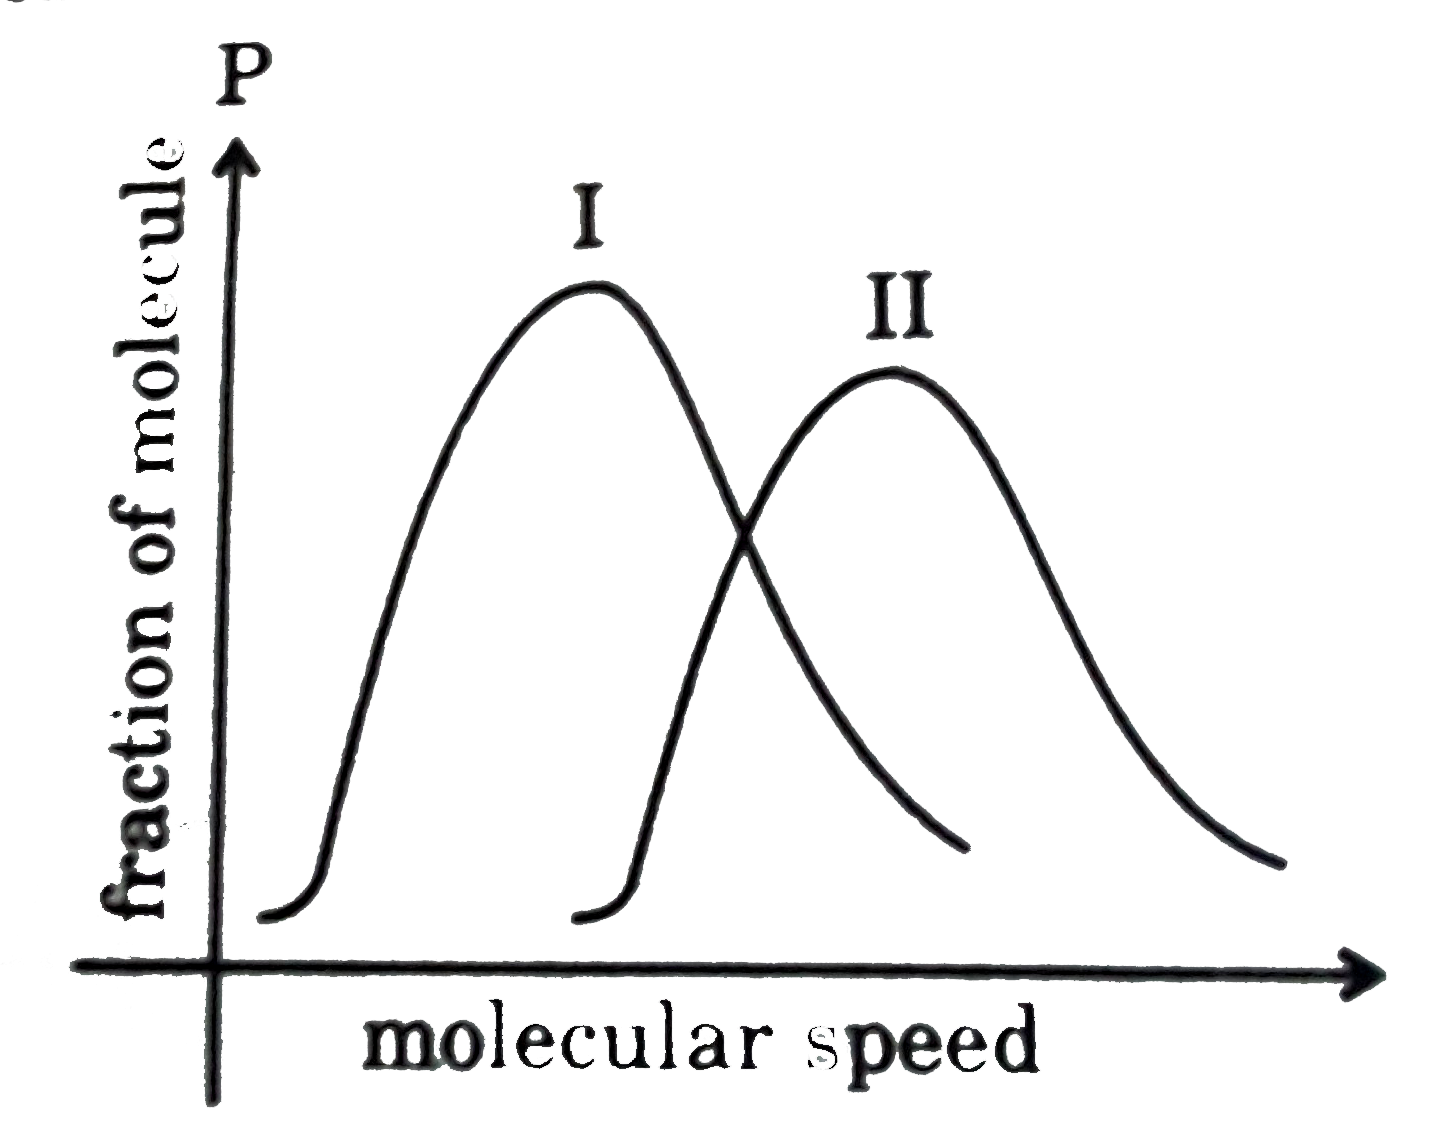
The graphs representing distribution of molecular speeds at 300 K for gases CI2 and N2 are as shown below (Atomic mass N=14,CI=35.5):

I graph is for N2 and II is for CI2
II graph is for N2 and I is for CI2
either graph can be taken for N2 or CI2
information is not sufficient
The correct Answer is:B
Topper's Solved these Questions
- GRAPHICAL INTERPRETATIONBOOK - GRB PUBLICATIONCHAPTER - GRAPHICAL INTERPRETATIONEXERCISE - C. Atomic Sturcture
1 Videos
- GRAPHICAL INTERPRETATIONBOOK - GRB PUBLICATIONCHAPTER - GRAPHICAL INTERPRETATIONEXERCISE - Atomic Sturcture
9 Videos
- GRAPHICAL INTERPRETATIONBOOK - GRB PUBLICATIONCHAPTER - GRAPHICAL INTERPRETATIONEXERCISE - B. Gaseous State
1 Videos
- F-BLOCK ELEMENTSBOOK - GRB PUBLICATIONCHAPTER - F-BLOCK ELEMENTSEXERCISE - Subjective type
7 Videos
- HYDROCARBON (ALIPHATIC)BOOK - GRB PUBLICATIONCHAPTER - HYDROCARBON (ALIPHATIC)EXERCISE - Previous years jee questions
28 Videos
Similar Questions
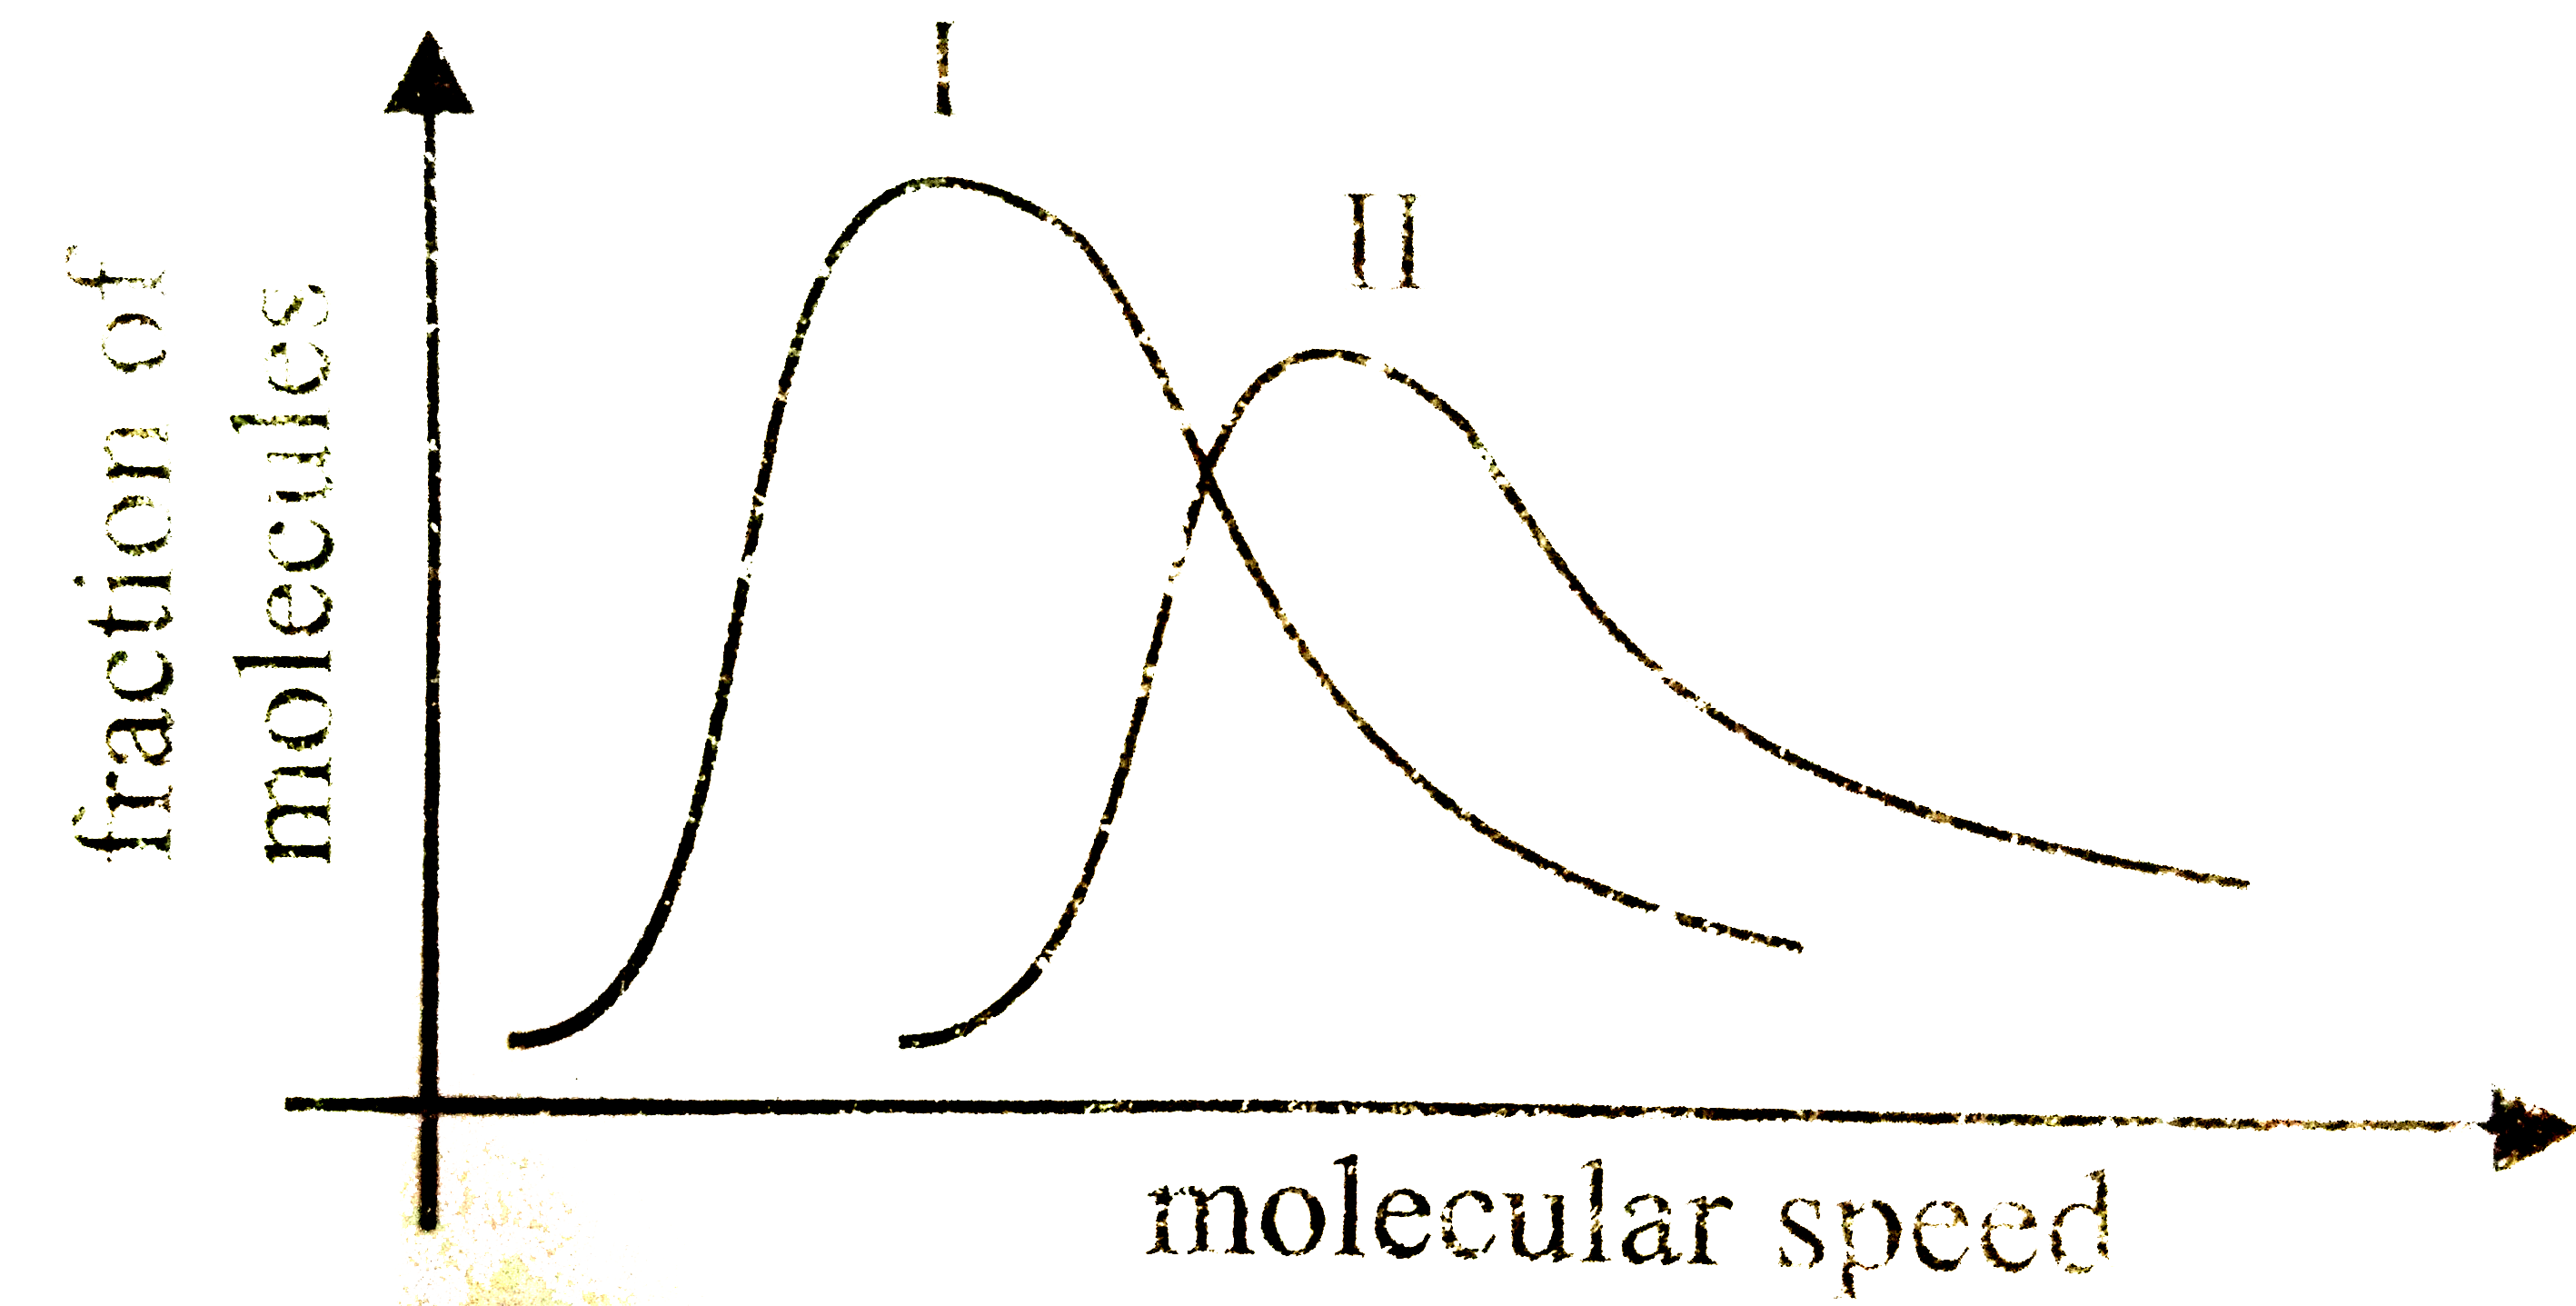
The graphs representing distribution of molecular speeds at 300 K for gases CI2 and N2 are as show in figure :

Select the correct option .
View SolutionThe graphs representing distribution of molecular speeds at 300 K for gases CI2 and N2 are as show in figure :

Select the correct option . I graph is for N 2 all II is for C I 2 II graph is for N 2 and I is for C I 2 Either graph can be taken for N 2 or C I 2 Information is not sufficient .
View Solution
Knowledge Check
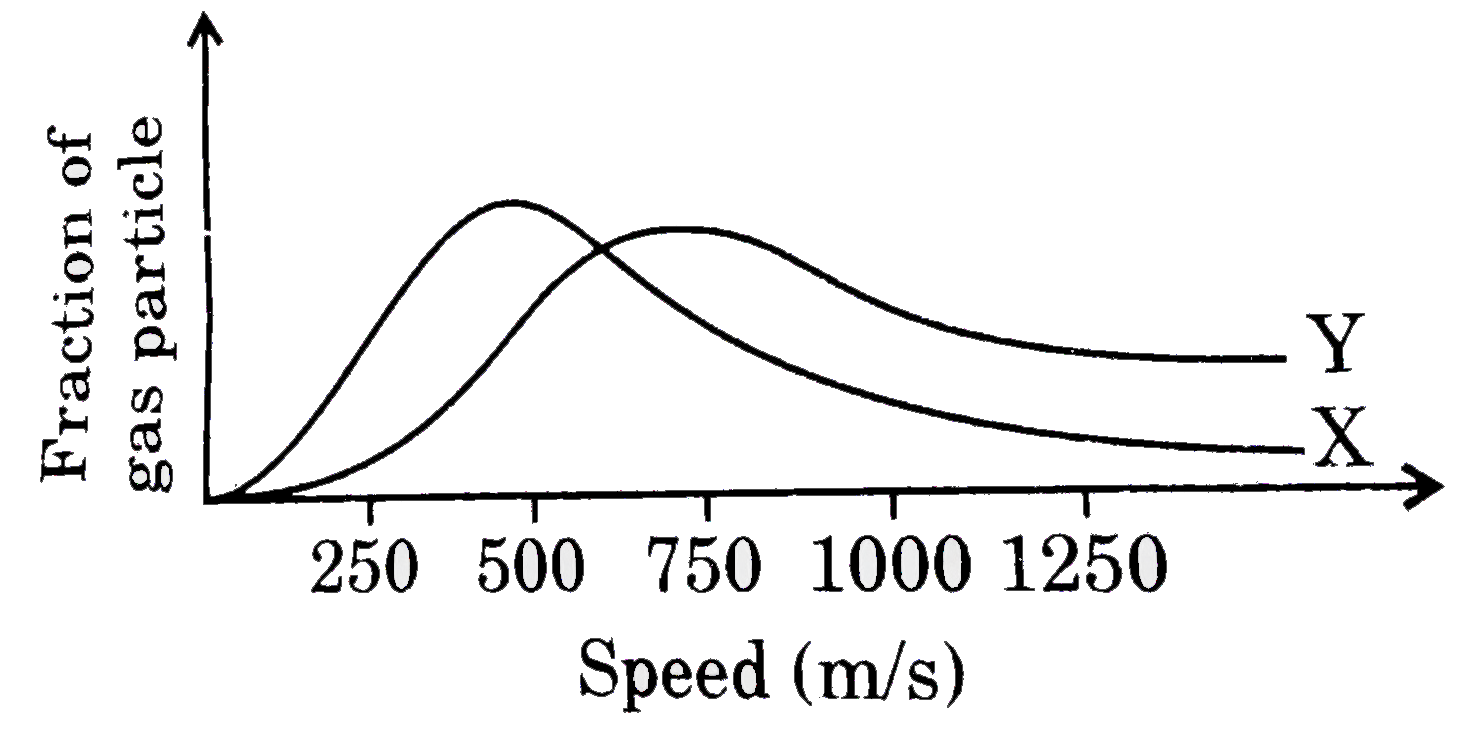
The graph below shows the distribution of molecular speeds of two ideal gases X and Y at 200 K . On the basis of the below graph, identify the correct statements .
 AIf gas X is methane, then gas Y can be CO2BFraction of molecules of X must be grater then Y in a particular range of speed a 200KCUnder identical conditions rate of effusion of Y is greater than that of XDThe molar kinetic energy of gas X at 200K is equa to the molar kinetic energy of Y at 200 K
A solution containing 0.85g of ZnCI2 in 125.0g of water freezes at −0.23∘C. The apparent degree of dissociation of the salt is:
(kf for water =1.86Kkgmol−1, atomic mass, Zn=65.3 and CI=35.5)A1.36%B2.47%C73.5%D7.35%A solution containing 0.85g of ZnCI2 in 125.0g of water freezes at −0.23∘C. The apparent degree of dissociation of the salt is:
(kf for water =1.86Kkgmol−1, atomic mass, Zn=65.3 and CI=35.5)A0.875MB1.00MC1.75MD0.975M
Calculate the relative molecular masses (or molecular weights), of the following compounds :
Urea, NH2CONH2 (Given : Atomic mass in amu of N = 14, H = 1, S = 32, O = 16, C = 12, Pt= 195, Cl= 35.5, Cu= 63.5)
View SolutionCisplatin, an anticancer drug, has the molecular formula Pt(NH3)2Cl2. What is the mass (in gram) of one molecule ? (Atomic masses : Pt=195,H=14,Cl=35.5)
View SolutionCisplatin, an anticancer drug, has the molecular formula Pt(NH3)2Cl2. What is the mass (in gram) of one molecule ? (Atomic masses : Pt=195,H=14,Cl=35.5)
View SolutionCisplatin, an anticancer drug, has the molecular formula Pt(NH3)2Cl2. What is the mass (in gram) of one molecule ? (Atomic masses : Pt=195,N=14,H=1,Cl=35.5)
View SolutionThe volume occupied by 35.5g of CI2 at S.T.P.
View Solution
