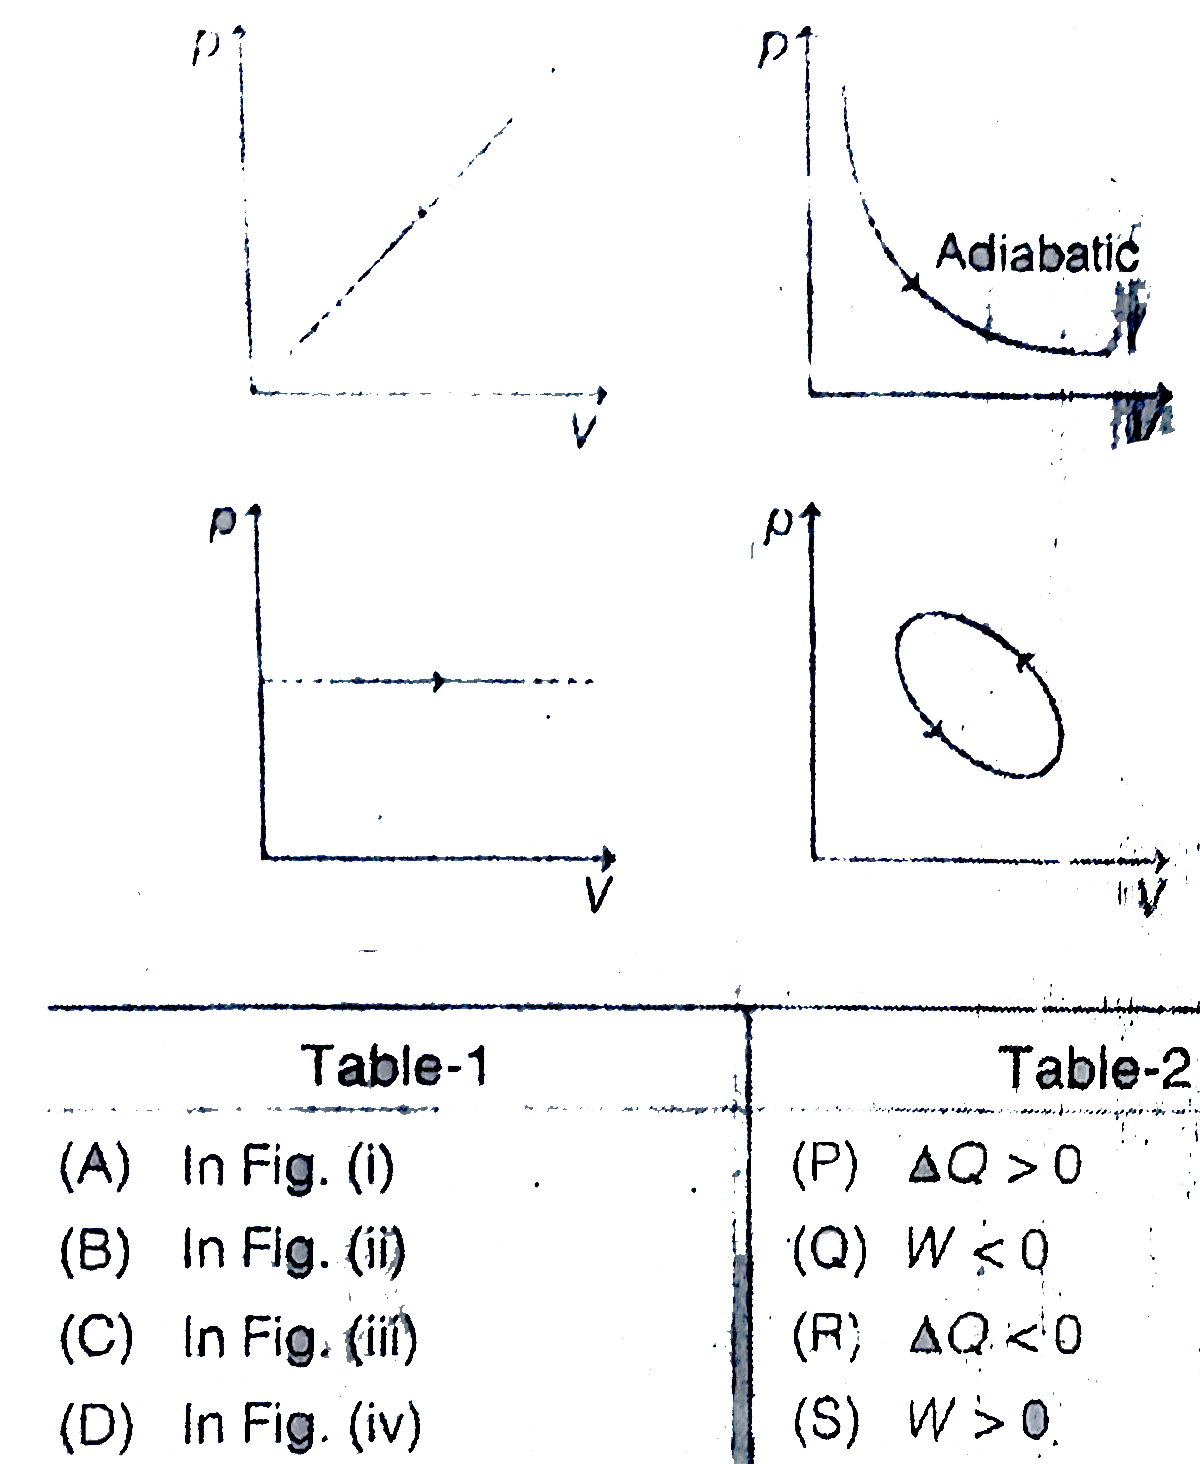
The figures given below show different processes (relating pressure P and volume V) for a given amount of an ideal gas. W is work done by the gas and ΔQ is heat absorbed by the gas.

Text Solution
The correct Answer is:(A) PS, (B) Q, (C) PS, (D) QR
|
Topper's Solved these Questions
Similar Questions
Knowledge Check
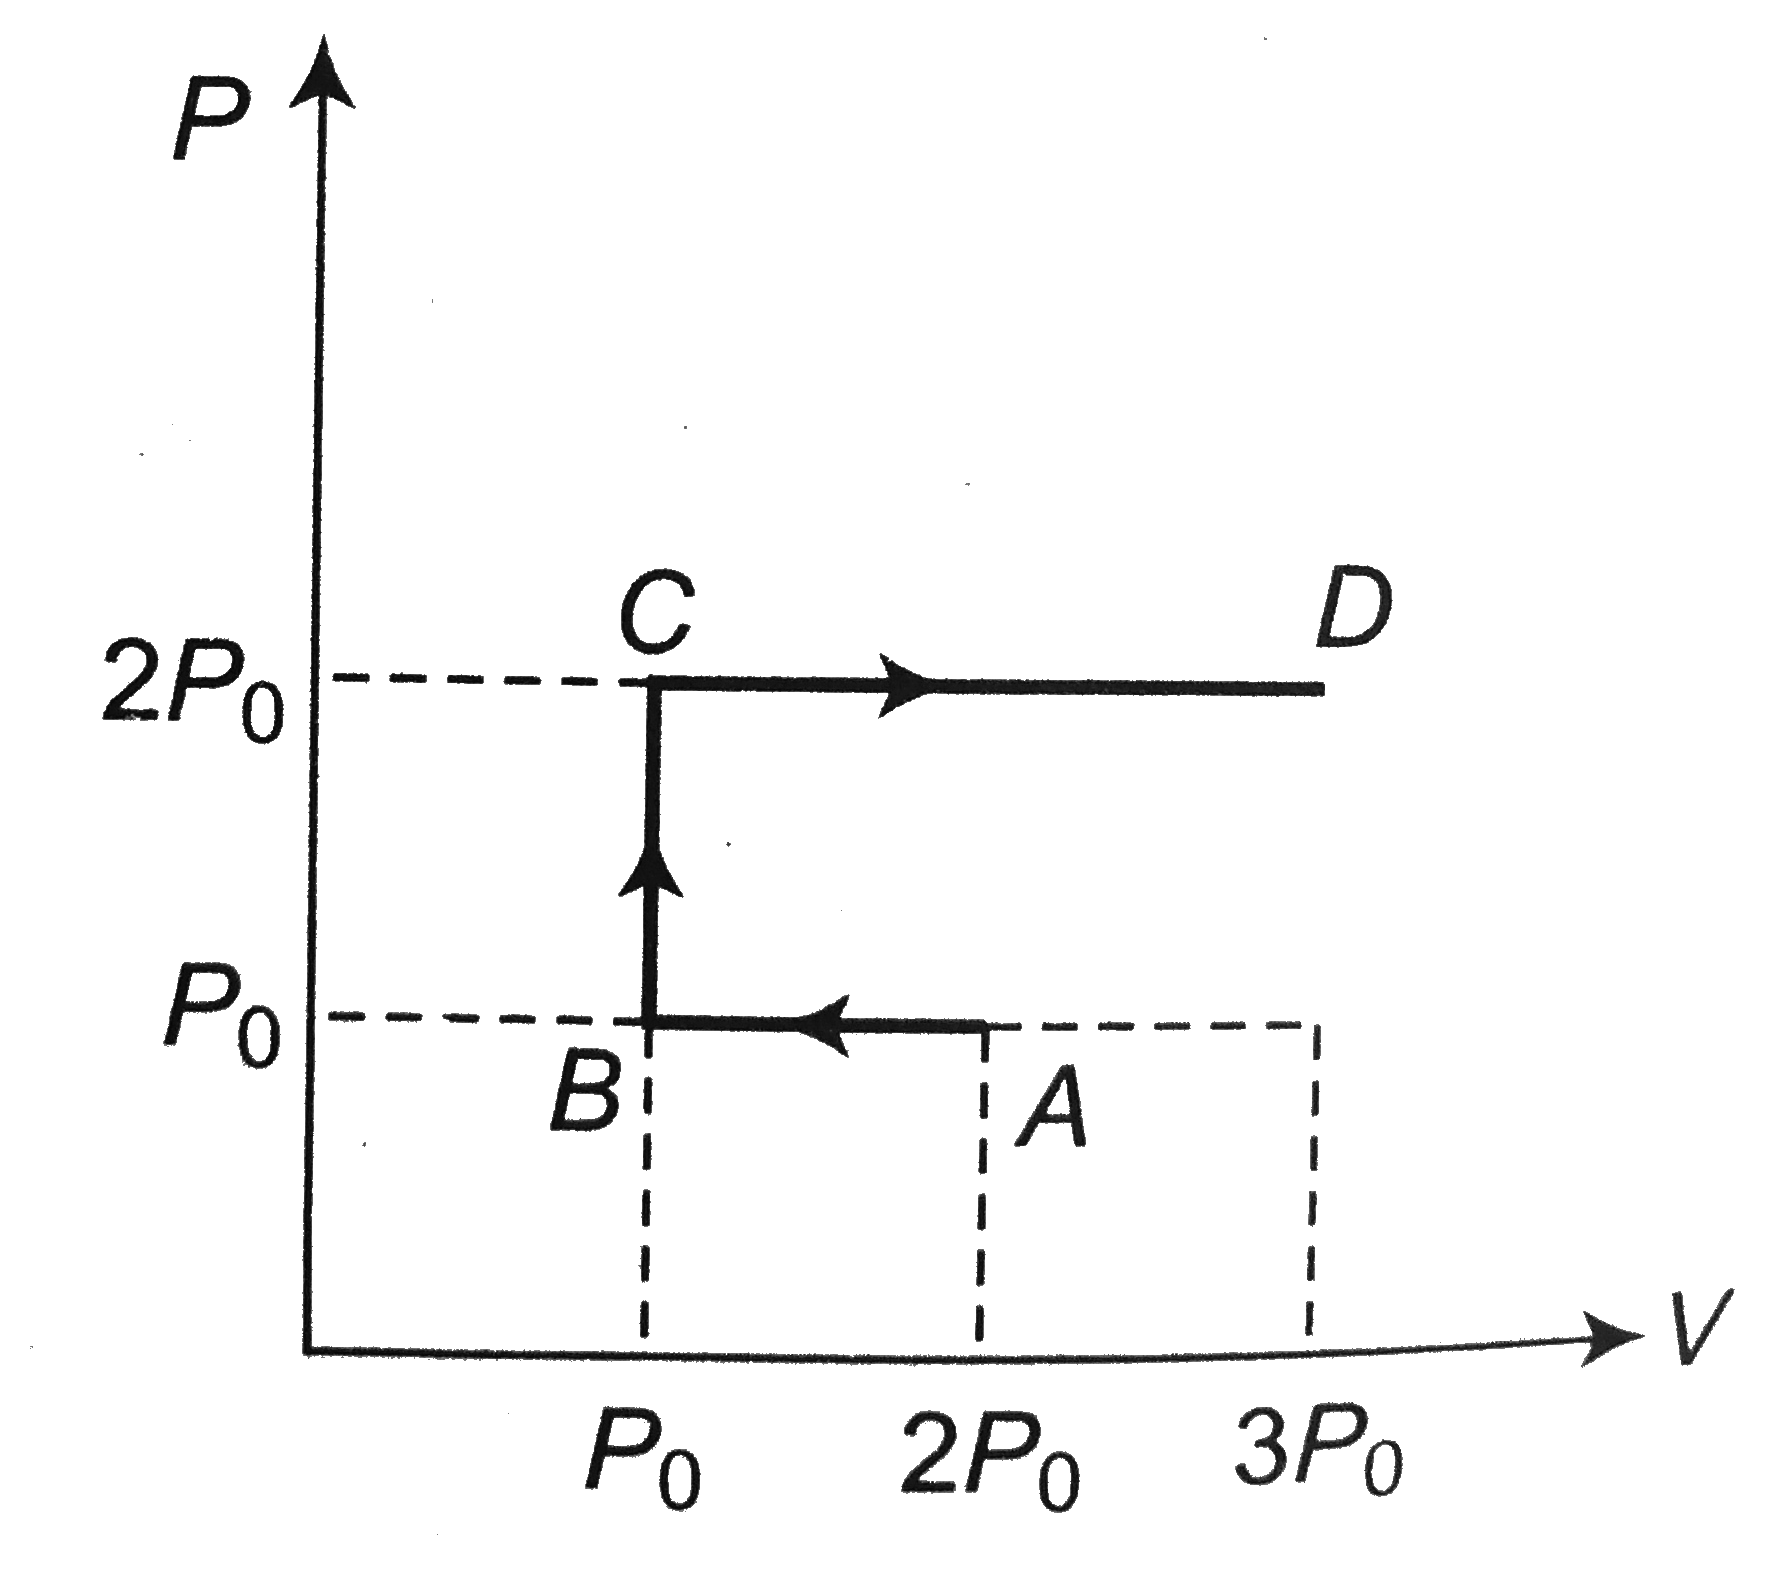
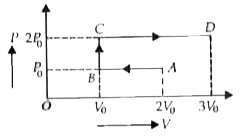
P−V diagram of an ideal gas is as shown in figure. Work done by the gas in process ABCD is
 A4P0V0B2P0V0C3P0V0DP0V0
P-V diagram of an ideal gas is as shown in figure. Work done by the gas in the process ABCD is
 A4P0V0B2P0V0C3P0V0DP0V0
Let Q and W denote the amount of heat given to an ideal gas the work done by it in an isothermal process.
View SolutionLet QandW denote the amount of heat given to an ideal gas the work done by it in an adiabatic process.
View SolutionP−V diagram of an ideal gas is as shown in figure. Work done by the gas in process ABCD is

View SolutionP-V diagram of an ideal gas is as shown in figure. Work done by the gas in the process ABCD is

View SolutionLet QandW denote the amount of heat given to an ideal gas and the work done by it in an adiabatic process.
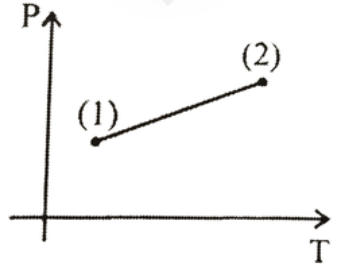
View SolutionFigure shows a process for a given amount of an ideal gas. If volume in state 1 is V1 & in state 2 is V2, then

View Solution

