The voltage-current (V-I) graph of a metallic conductor at two different temperature T1 and T2 is shown below. At which, temperature is the resistance higher ?
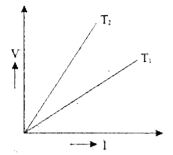
At T2
Similar Questions
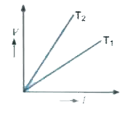
The voltage-current (V-I) graph of a metallic conductor at two different temperature T1 and T2 is shown in figure. At which temperature is the resistance higher?
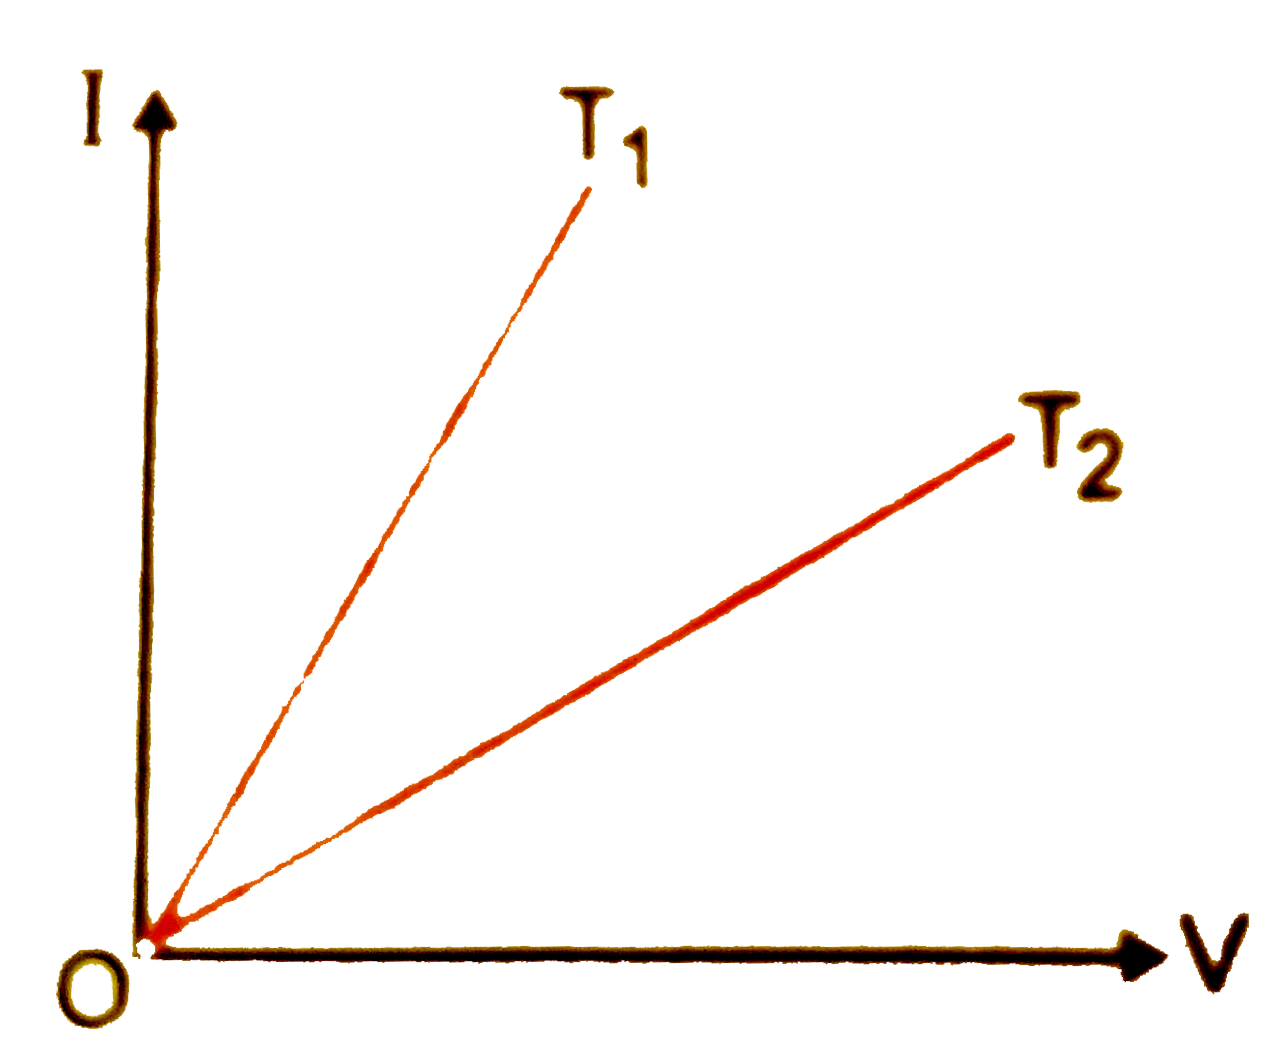
View SolutionV- I graph for a metallic wire at two different temperature T1 and T2 is shown in figure. Which of the two temperature is higher and why?
View Solution
Knowledge Check
The current (I) and voltage (V) graphs for a given metallic wire at two different temperature (T1) and (T2) are shown in fig. It is concluded that
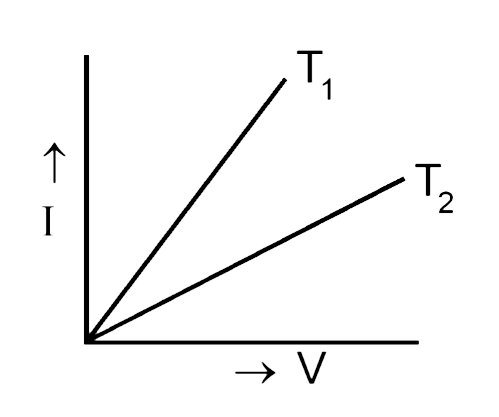 AT1=T2BT1>T2CT1<T2DNone of these
The voltage V and current I graph for a conductor at two different temperatures T1 and T2 are shown in the figure. The relation between T1 and T2 is
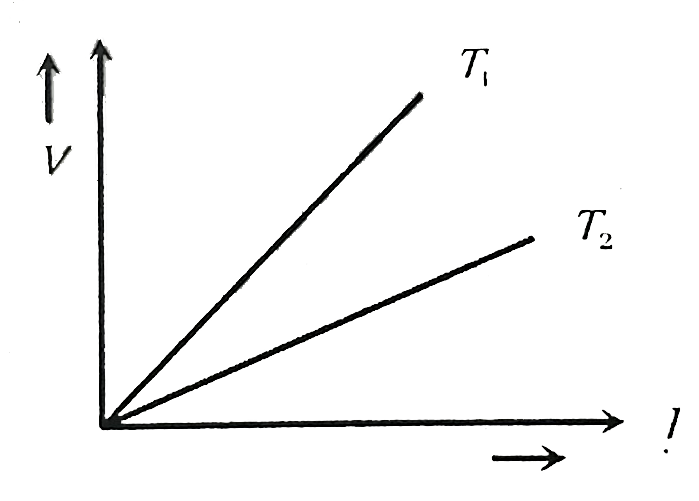 AT1>T2BT1≈T2CT1=T2DT1<T2
The current - voltage graphs for a given metallic wire at two different temperatures T1andT2 are shown in the figure.
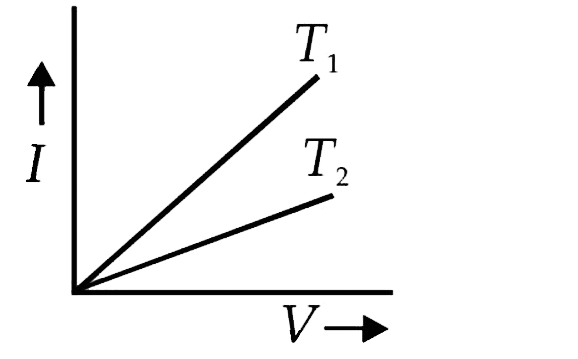
The temperature T2 is greater than T1.
View SolutionThe current - voltage graphs for a given metallic wire at two different temperatures T1andT2 are shown in the figure.

The temperature T2 is greater than T1.
View SolutionThe current - voltage graphs for a given metallic wire at two different temperatures T1andT2 are shown in the figure.

The temperature T2 is greater than T1.
View SolutionI-V graph for a metallie wire at two different tempearture, T1andT2 is as shown in the figure. Which of the two temperatures is lower and why ?

View SolutionI-V graph for a metallie wire at two different tempearture, T1andT2 is as shown in the figure. Which of the two temperatures is lower and why ?

View SolutionThe graph of (xm) vs P at two different temperature T1 and T2 is [where T1>T2]
View Solution
