Student studying motion observed a cart rolling at a constant rate along a striaght line. The table below gives the distance, d feet, the cart was from a reference point at 1-second intervals from t = 0 seconds to r = 5 seconds.

Which of the following equations represents this relationship between d and t?
d=t+15
d=3t+12
d=3t+15
d=15t+3
The correct Answer is:C
Step by step video, text & image solution for Student studying motion observed a cart rolling at a constant rate along a striaght line. The table below gives the distance, d feet, the cart was from a reference point at 1-second intervals from t = 0 seconds to r = 5 seconds. Which of the following equations represents this relationship between d and t? by Maths experts to help you in doubts & scoring excellent marks in Class 12 exams.
Topper's Solved these Questions
Similar Questions
A body moves in a straight line along Y-axis. Its distance y in metre) from the origin is given y=8t−3t2. The average speed in the time interval from t=0 second to t=1 second is
View SolutionA particle moves rectilinearly with initial velocity u and constant acceleration a. Find the average velocity of the particle in a time interval from t=0 to t=t second of its motion.
View Solution
Knowledge Check
- Question 1 - Select One
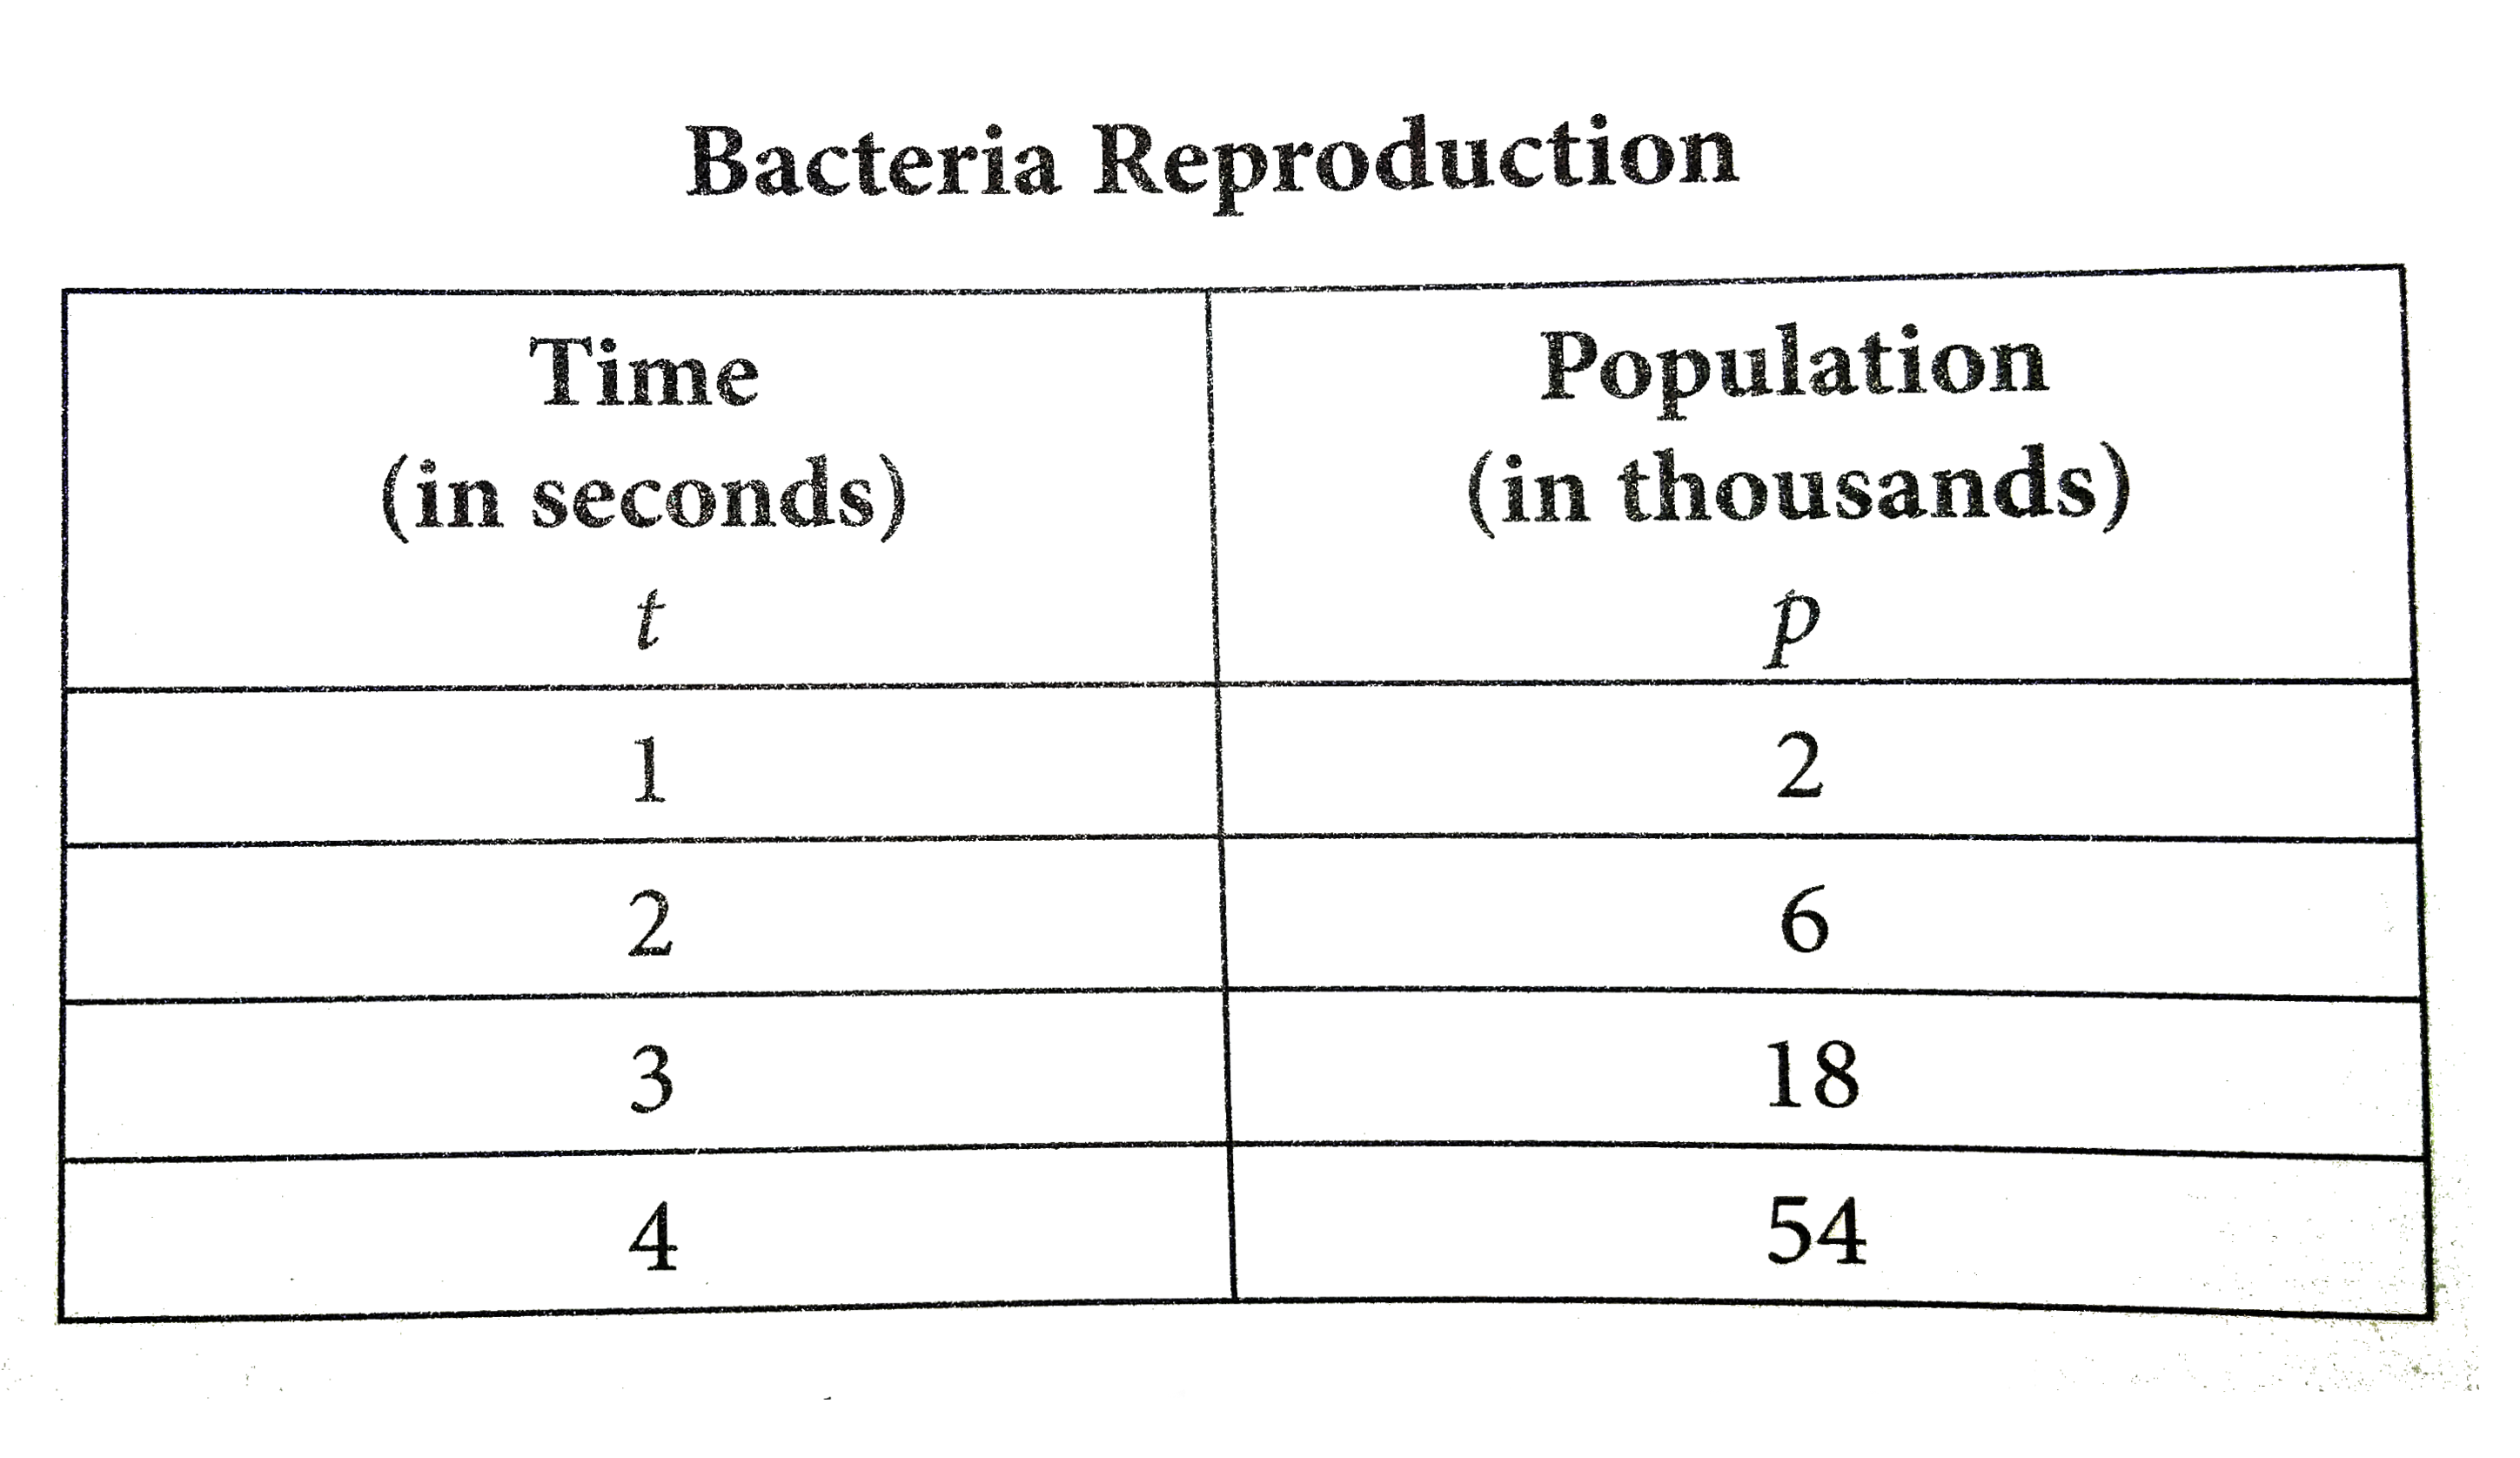
The table above shows the population growth of certain bacteria over four seconds. Which one of the following equations shows the relationship between t and p, according to the table?Ap=3tBp=2t2Cp=2×3tDp=2×3t−1 - Question 2 - Select One
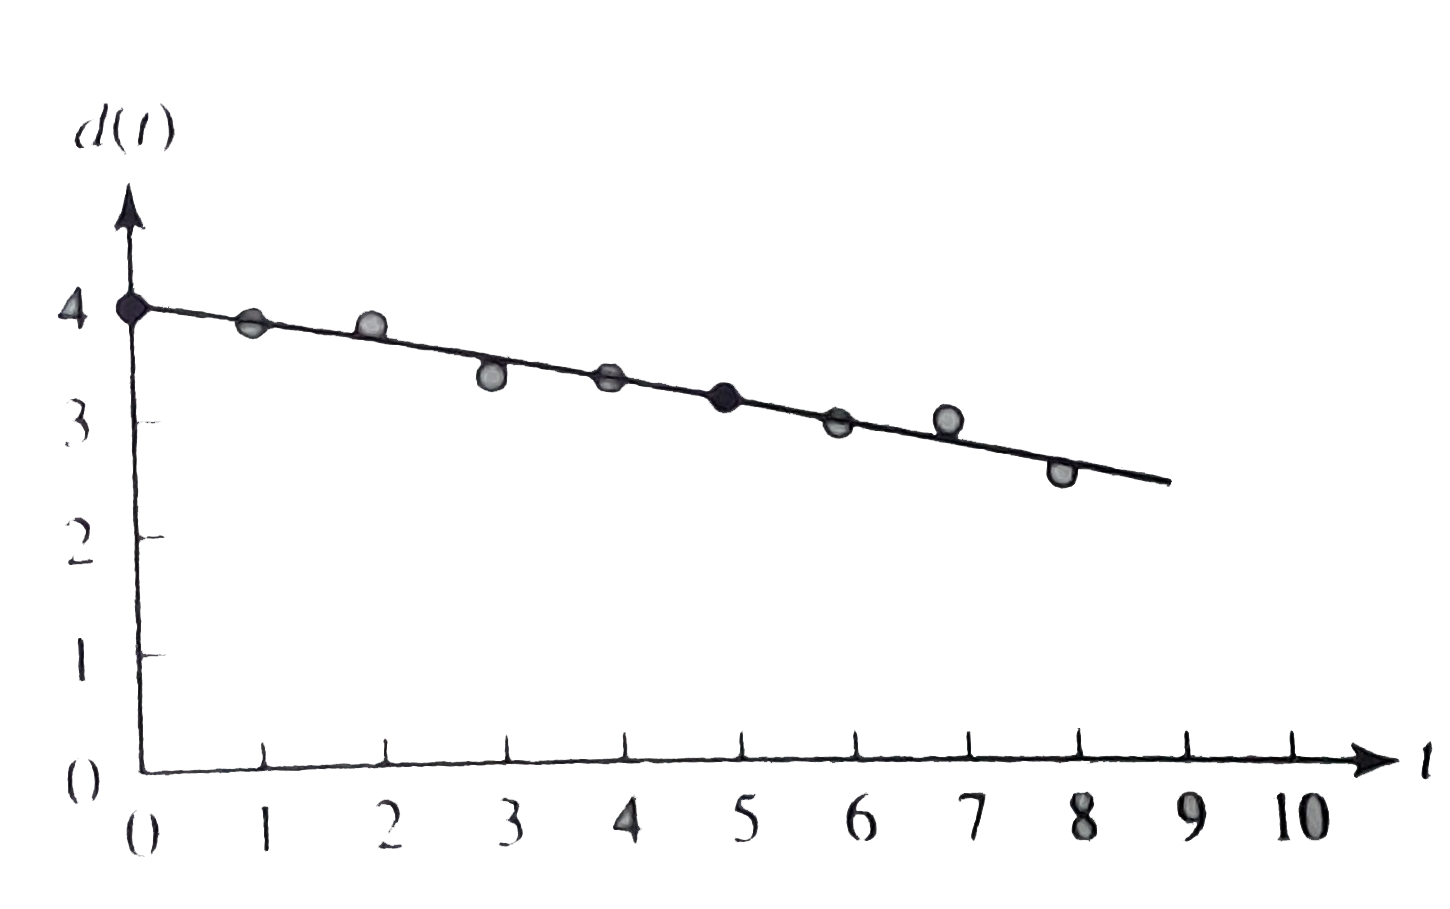
Joe bikes 4 kilometers to school . Because of the traffic and road conditions along the way , his speed varies. The dots on the graph above show his distance from the school at various times , starting at home at t=0 (black dot). After 5 minutes Joe is 3.2 kilometers from the school (second black dot). The data show that his speed is almost constant , and his distance from the school can be approximated by a straight line . The graph of the function that models Joe's distance from school as a function of time , in minutes , is shown as a solid line. Which of the following equations best represents this function ?Ad(t)=-0.5 t+4Bd(t)=-0.16 t +4Cd(t)=-6.25 t+4Dd(t)=0.16 t +4 - Question 3 - Select One
In the figure below, a highway rest area (at D) and radar stations (at A and B) lie on a level east-west line, A is 9,000 feet due west of D. An airplane (at C) is shown directly above the rest area, flying due west at a constant speed of 300 feet per secod and at a constant altitude of 12,000 feet. The airplane is located at a straight-line distance of 15,000 feet from the radar station at A and 13,000 feet from the radar station at B.
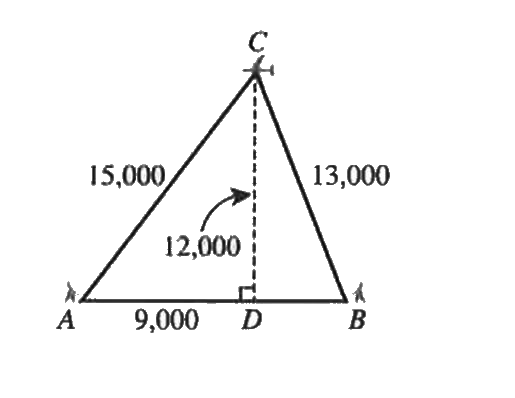
Which of the following values is closest to the distance, in feet, between the 2 radar stations?A5,000B10000C145000D15000
The relation between position (x) and time (t) are given below for a particle moving along a straight line. Which of the following equation represents uniformly accelerated motion? [where αandβ are positive constants]
View SolutionVelocity time equation of a particle moving in a straight line is v=2t−4 for t≤2s and v=4−2t for t>2.The distance travelled by the particle in the time interval from t=0 to t=4s is (Here t is in second and v in m/s)
View SolutionThe velocity time graph of a particle moving along a straight line is shown in the figure. In the time interval from t=0 to t=8 second, answer the following three question.
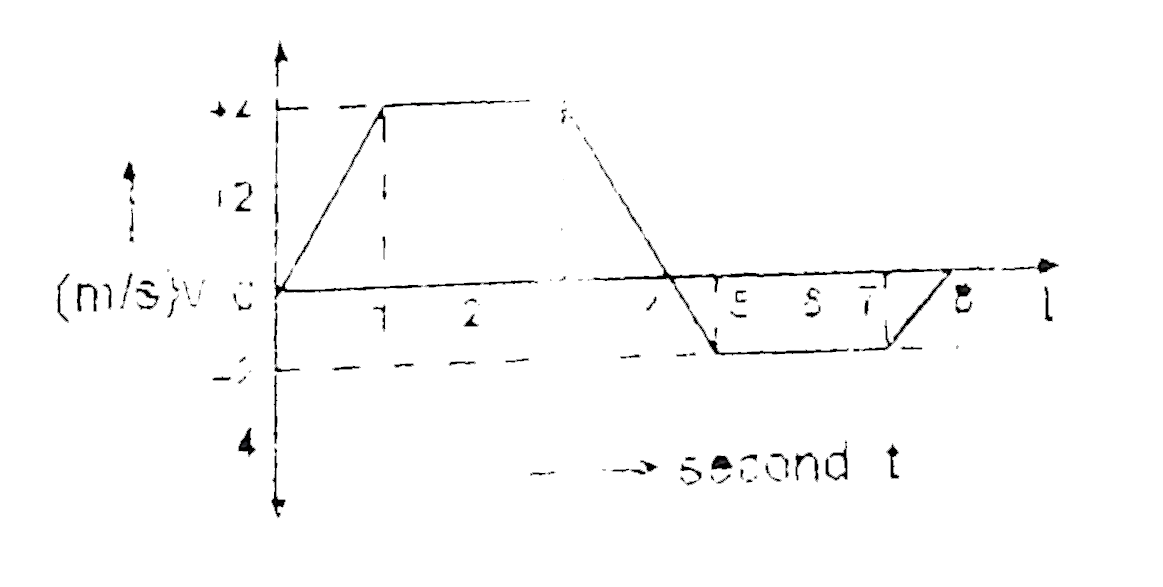
The distance travelled by the particle is :View Solution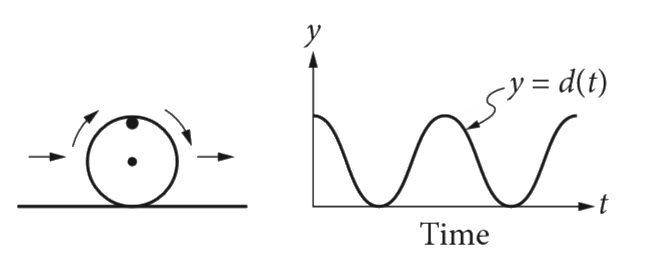
The figure on the left above show saw heel with a mark on its rim. The wheel is rolling on theground at a constant rate along a level straight path from a starting point to an ending point. The graph of y=d(t)on the right could represent which of the following as a function of time from when the wheel began to roll?View Solutionh=−16t2+vt+k
The equation above gives the height h, in feet, of a ball t seconds after it is thrown straight up with an initial speed of v feet per second from a height of k feet. Which of the following gives v in terms of h, t, and k ?View Solution

