The following curve represnets the variation of Gibbs function 'G' with pressure at constant temperature.
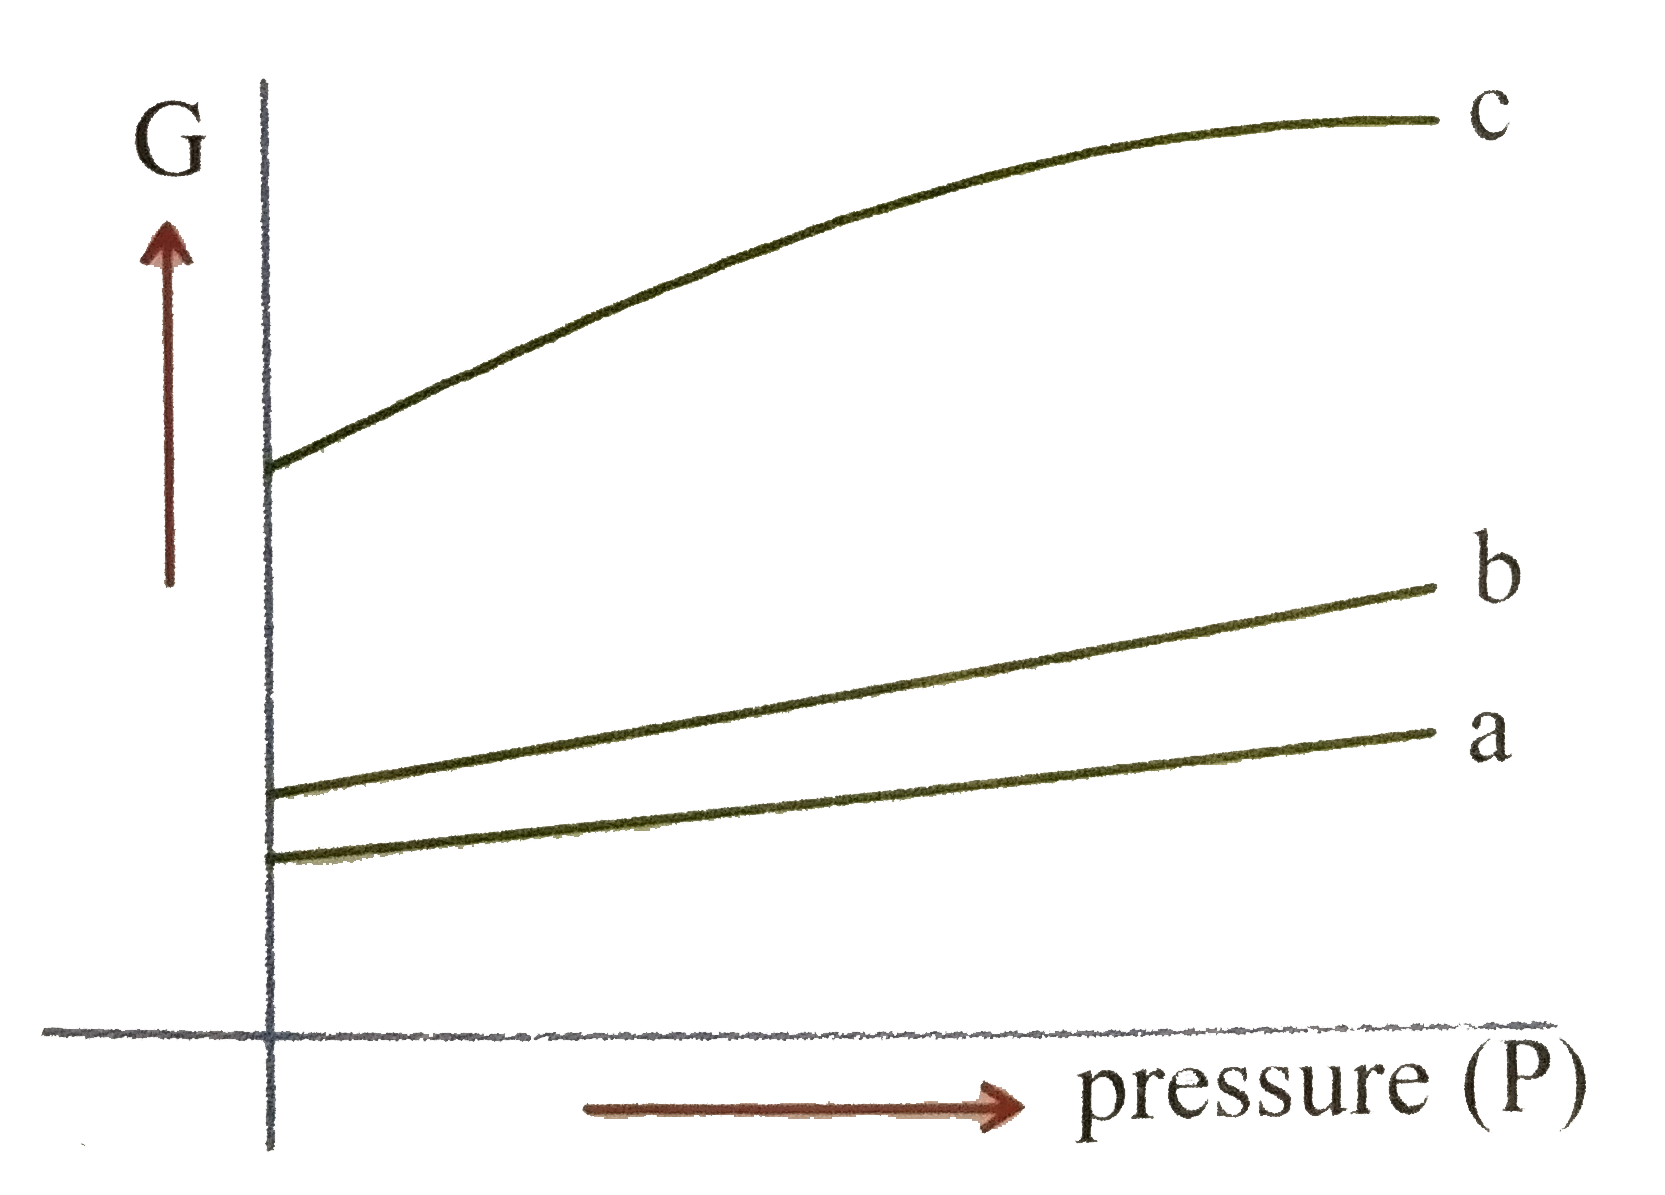
Correct match of given plots with the physical state of a substance is
c- solid, a - gas, b - liquid
c - gas, b- liequid, a - solid
a - liquid, b - solide, c - gas
c - gas, b - solid, a - liquid
The correct Answer is:B
Sgas>Sliq>Ssolid
Topper's Solved these Questions
- THERMODYNAMICSBOOK - NARAYNACHAPTER - THERMODYNAMICSEXERCISE - Passages
13 Videos
- THERMODYNAMICSBOOK - NARAYNACHAPTER - THERMODYNAMICSEXERCISE - Matching type
6 Videos
- THERMODYNAMICSBOOK - NARAYNACHAPTER - THERMODYNAMICSEXERCISE - Level -V
106 Videos
- STRUCTURE OF ATOMBOOK - NARAYNACHAPTER - STRUCTURE OF ATOMEXERCISE - EXERCISE - IV EXEMPLAR PROBLEMS
24 Videos
Similar Questions
Which one of the following given graphs represents the variation of rate constant (k) with temperature (f) for an endothermic reaction ?
View SolutionWhich one of the following given graphs represents the variation of rate constant (k) with temperature (t) for an endothermic reaction ?
View Solution
Knowledge Check
The curve showing the variation of adorpton with pressure at constant temperature is called :
Aan isosthermBadsorpton isothermCabsorption isothermDall of theseFor gaseous state at constant temperature which of the following plot is correct?
A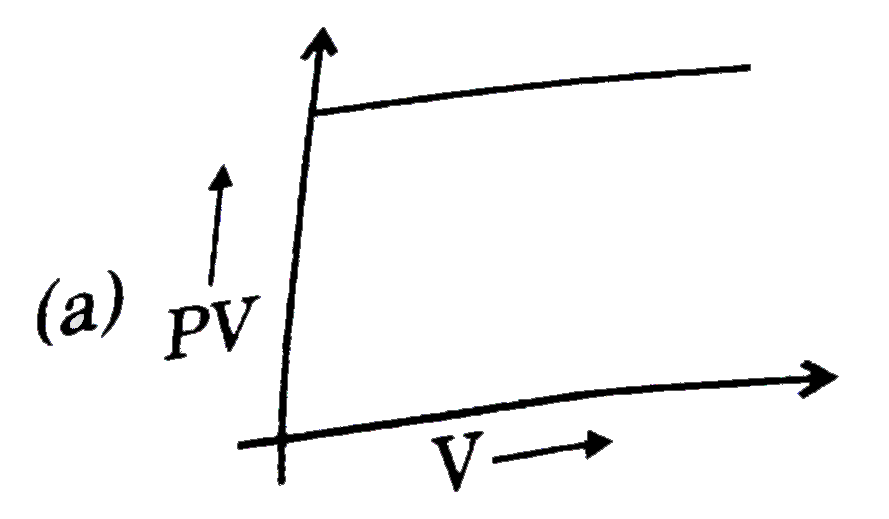 B
B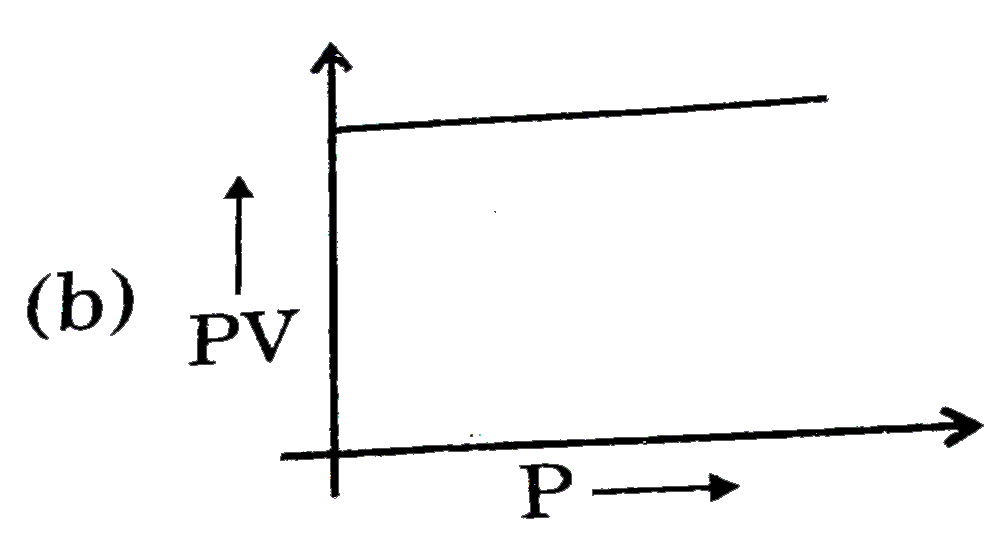 C
C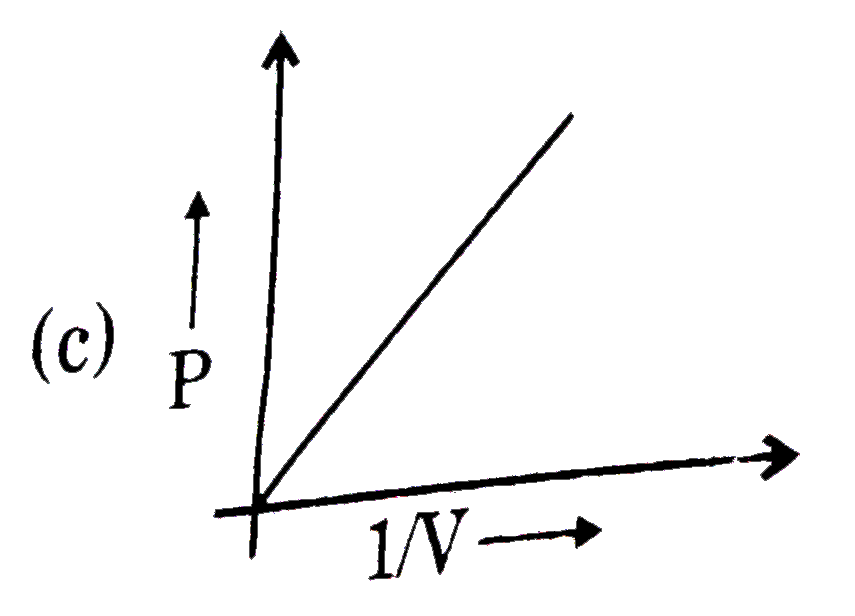 D
D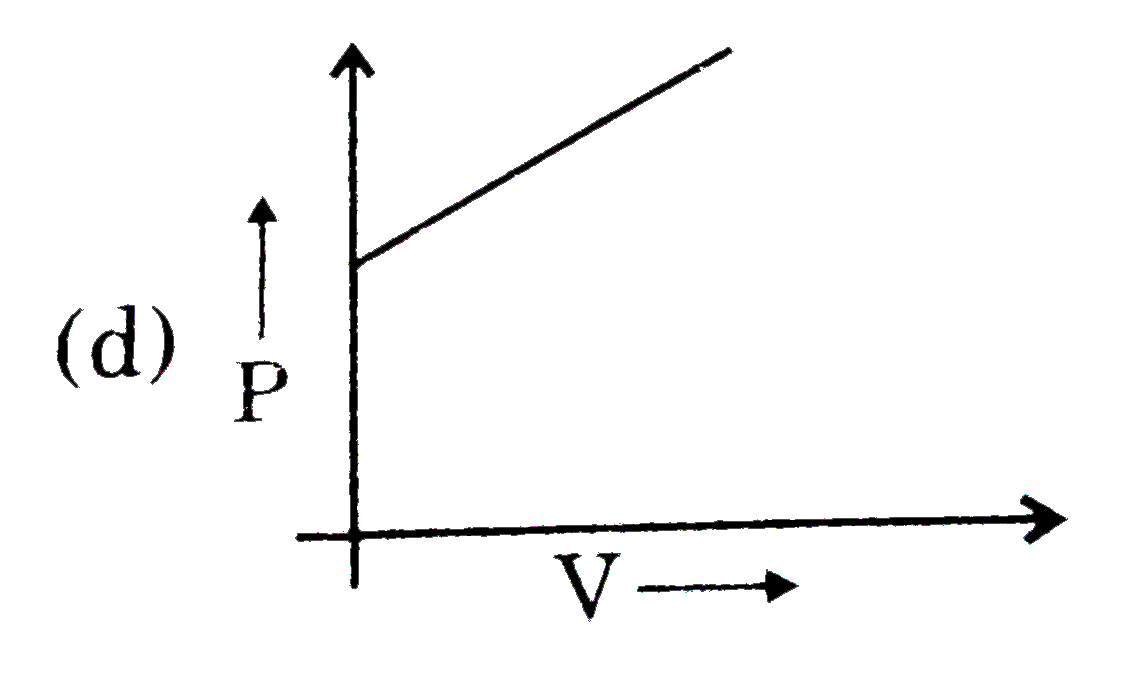
Which of the following curve is incorrect for given amount of an ideal gas at constant temperature ?
A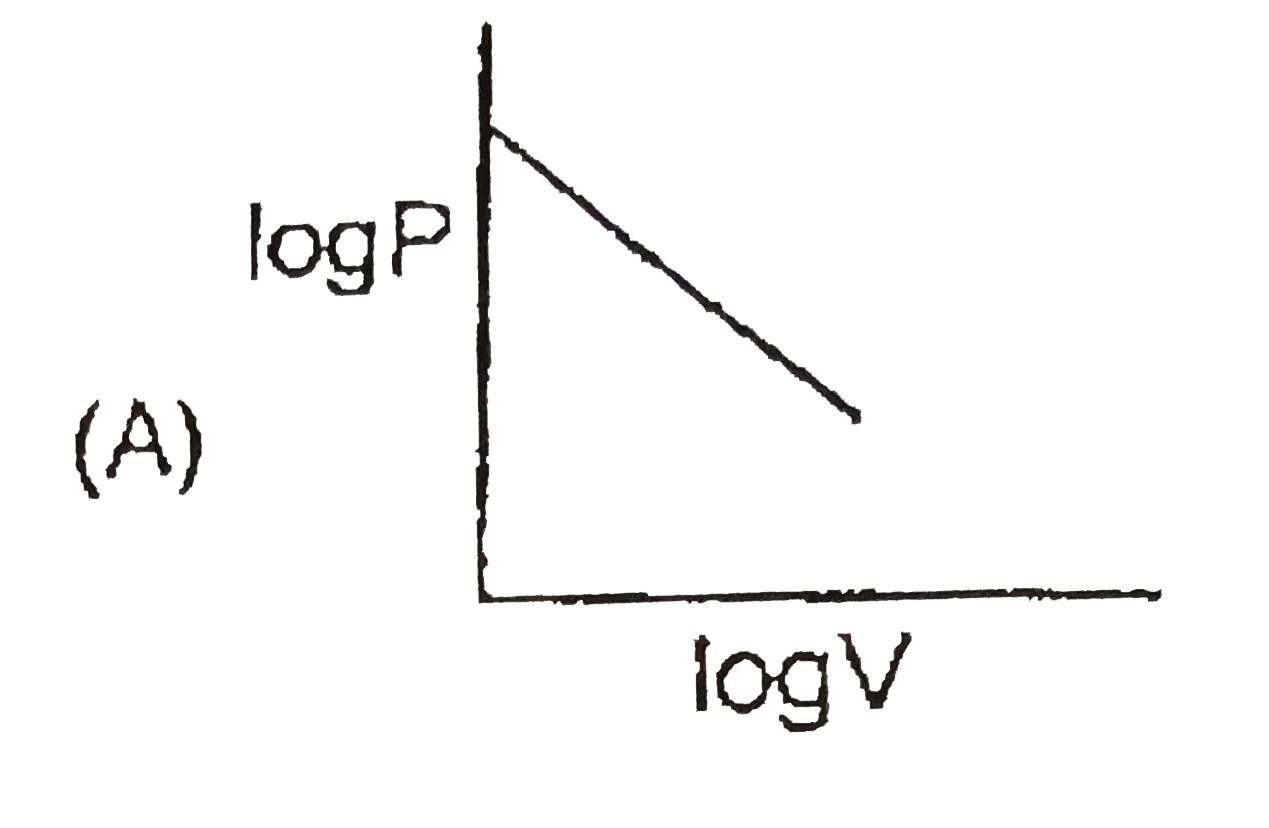 B
B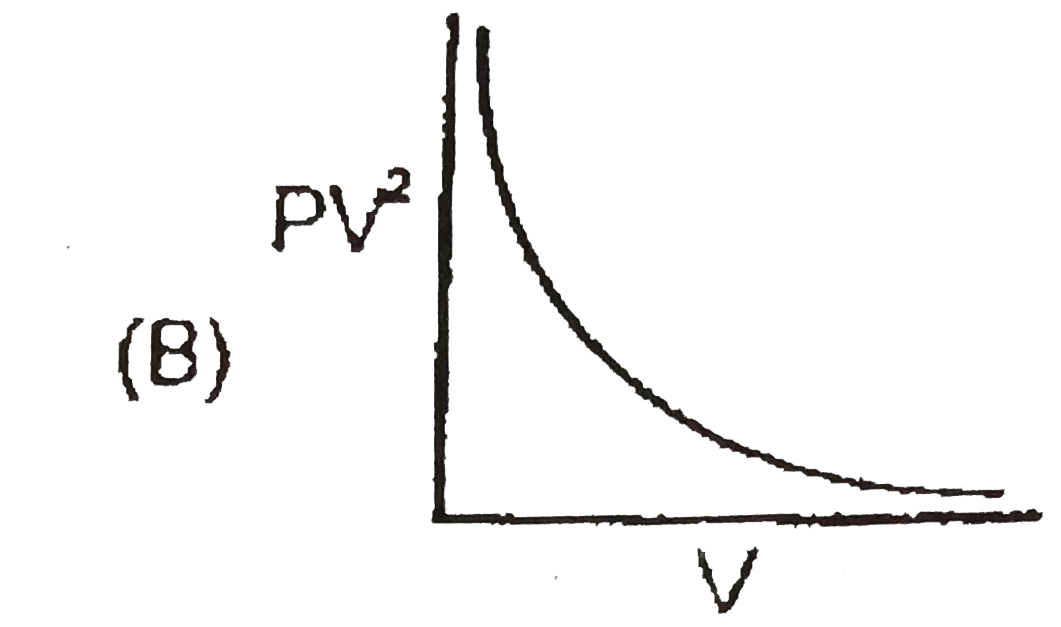 C
C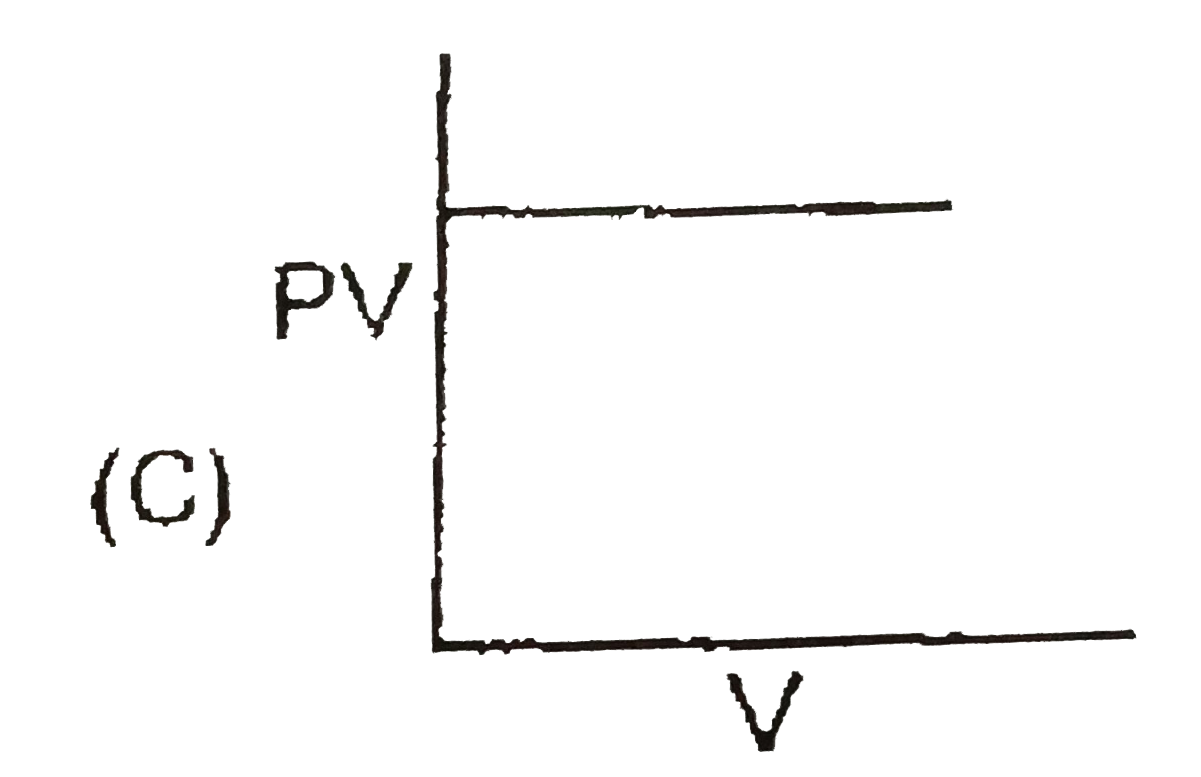 D
D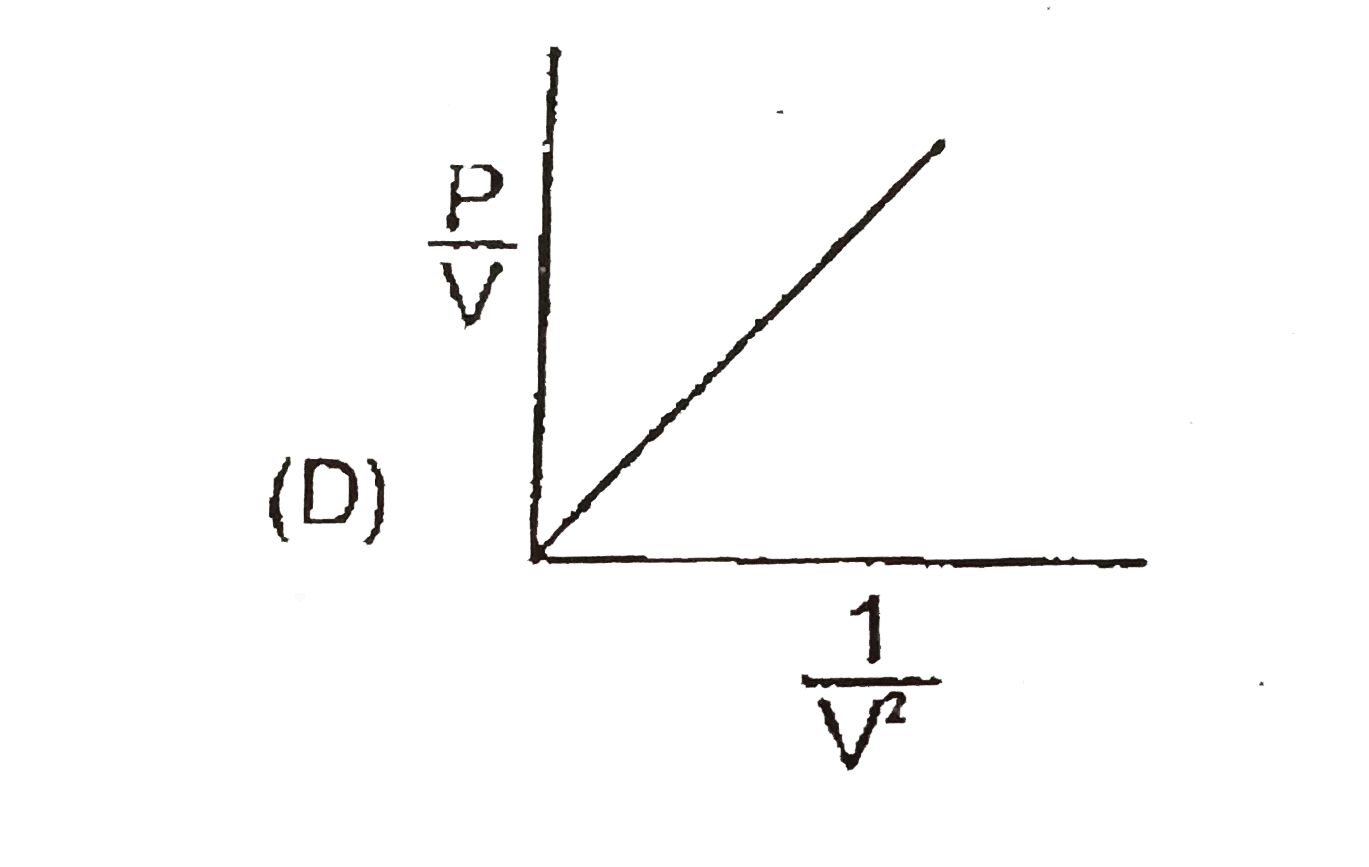
The variation of solubility of four different gases (G1, G2, etc.) in a given solvent with pressure at a constant temperature is shown in the plot.
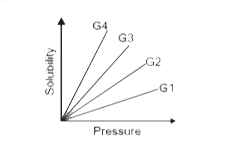
The gas with the highest value of Henrys law constant is
View SolutionIn order to perdict variation of Gibbs free energy with progress of reaction at constant temperature and 1 bar pressure, it is important to know realtive stability of the components involved in chemical reaction at standard useful work then the change in Gibbs free energy should be calculated
Which of the following options correctly represects the graph between Gibbs free energy (G0 and state of reaction (SOR) at 1 bar and 300 K for the reaction But -1 ene (A) ⇔ but -2 ene (B)
View SolutionPlots showing the variation of the rate constant (k) with temperature (T) are given below. The plot that follows the Arrhenius equation is
View SolutionThe curve drawn below shows the variations of P as a function of 1/V for a fixed mass and temperature of an ideal gas. It follows from the curve that:
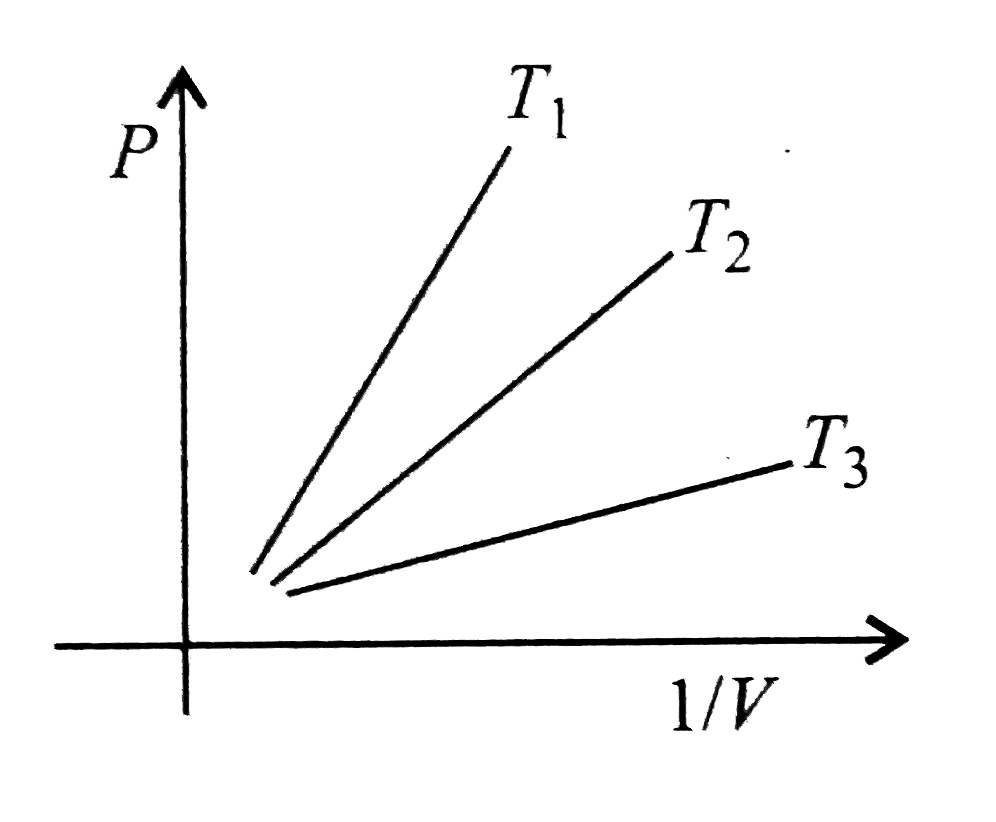
View SolutionWhich of the following graph represents the variation of amount of chemisorption of a gas by a solid with temperature under constant pressure?
View Solution
