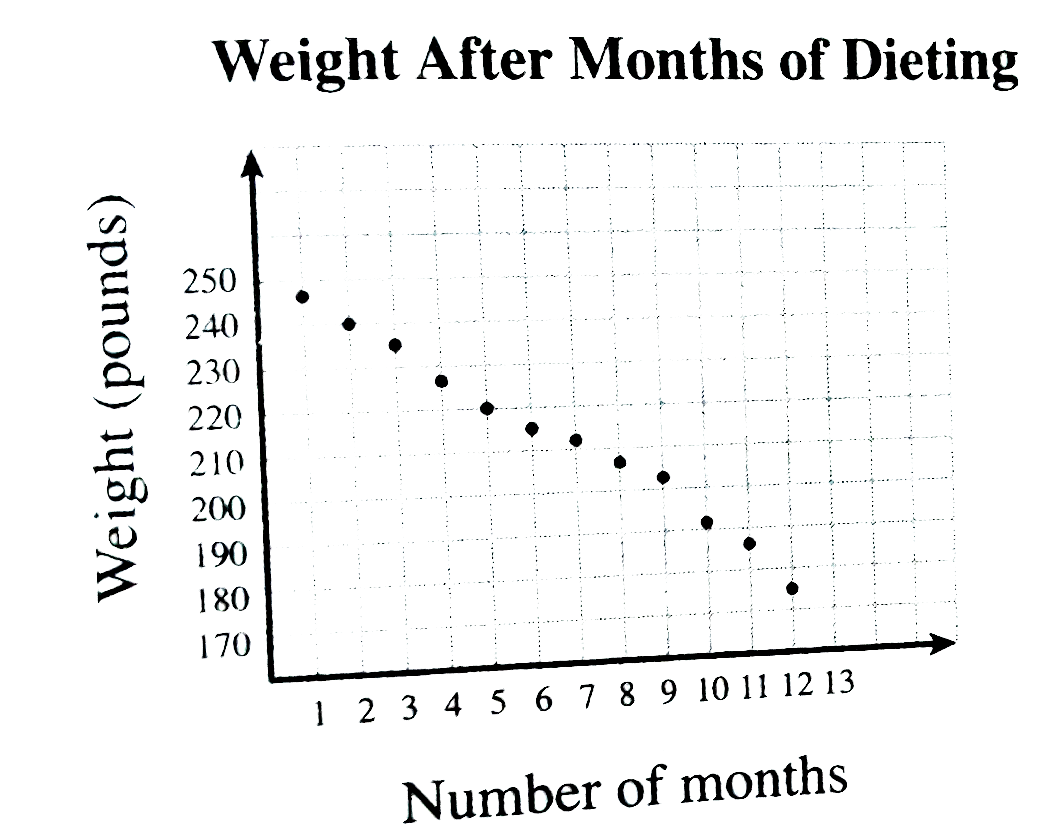
John joins a program to lose weight. Each month he records the number of months in the program and his weight at the end of the month. The graph of his progress is shown above.
Which of the following could be the equation of the line that best fits this data ?
w=-0.159x+254.3
w=0.159x+254.5
w=6.28x+254.5
w=-6.28x+254.5
The correct Answer is:D
Step by step video, text & image solution for John joins a program to lose weight. Each month he records the number of months in the program and his weight at the end of the month. The graph of his progress is shown above. Which of the following could be the equation of the line that best fits this data ? by Maths experts to help you in doubts & scoring excellent marks in Class 12 exams.
Updated on:21/07/2023Topper's Solved these Questions
Similar Questions
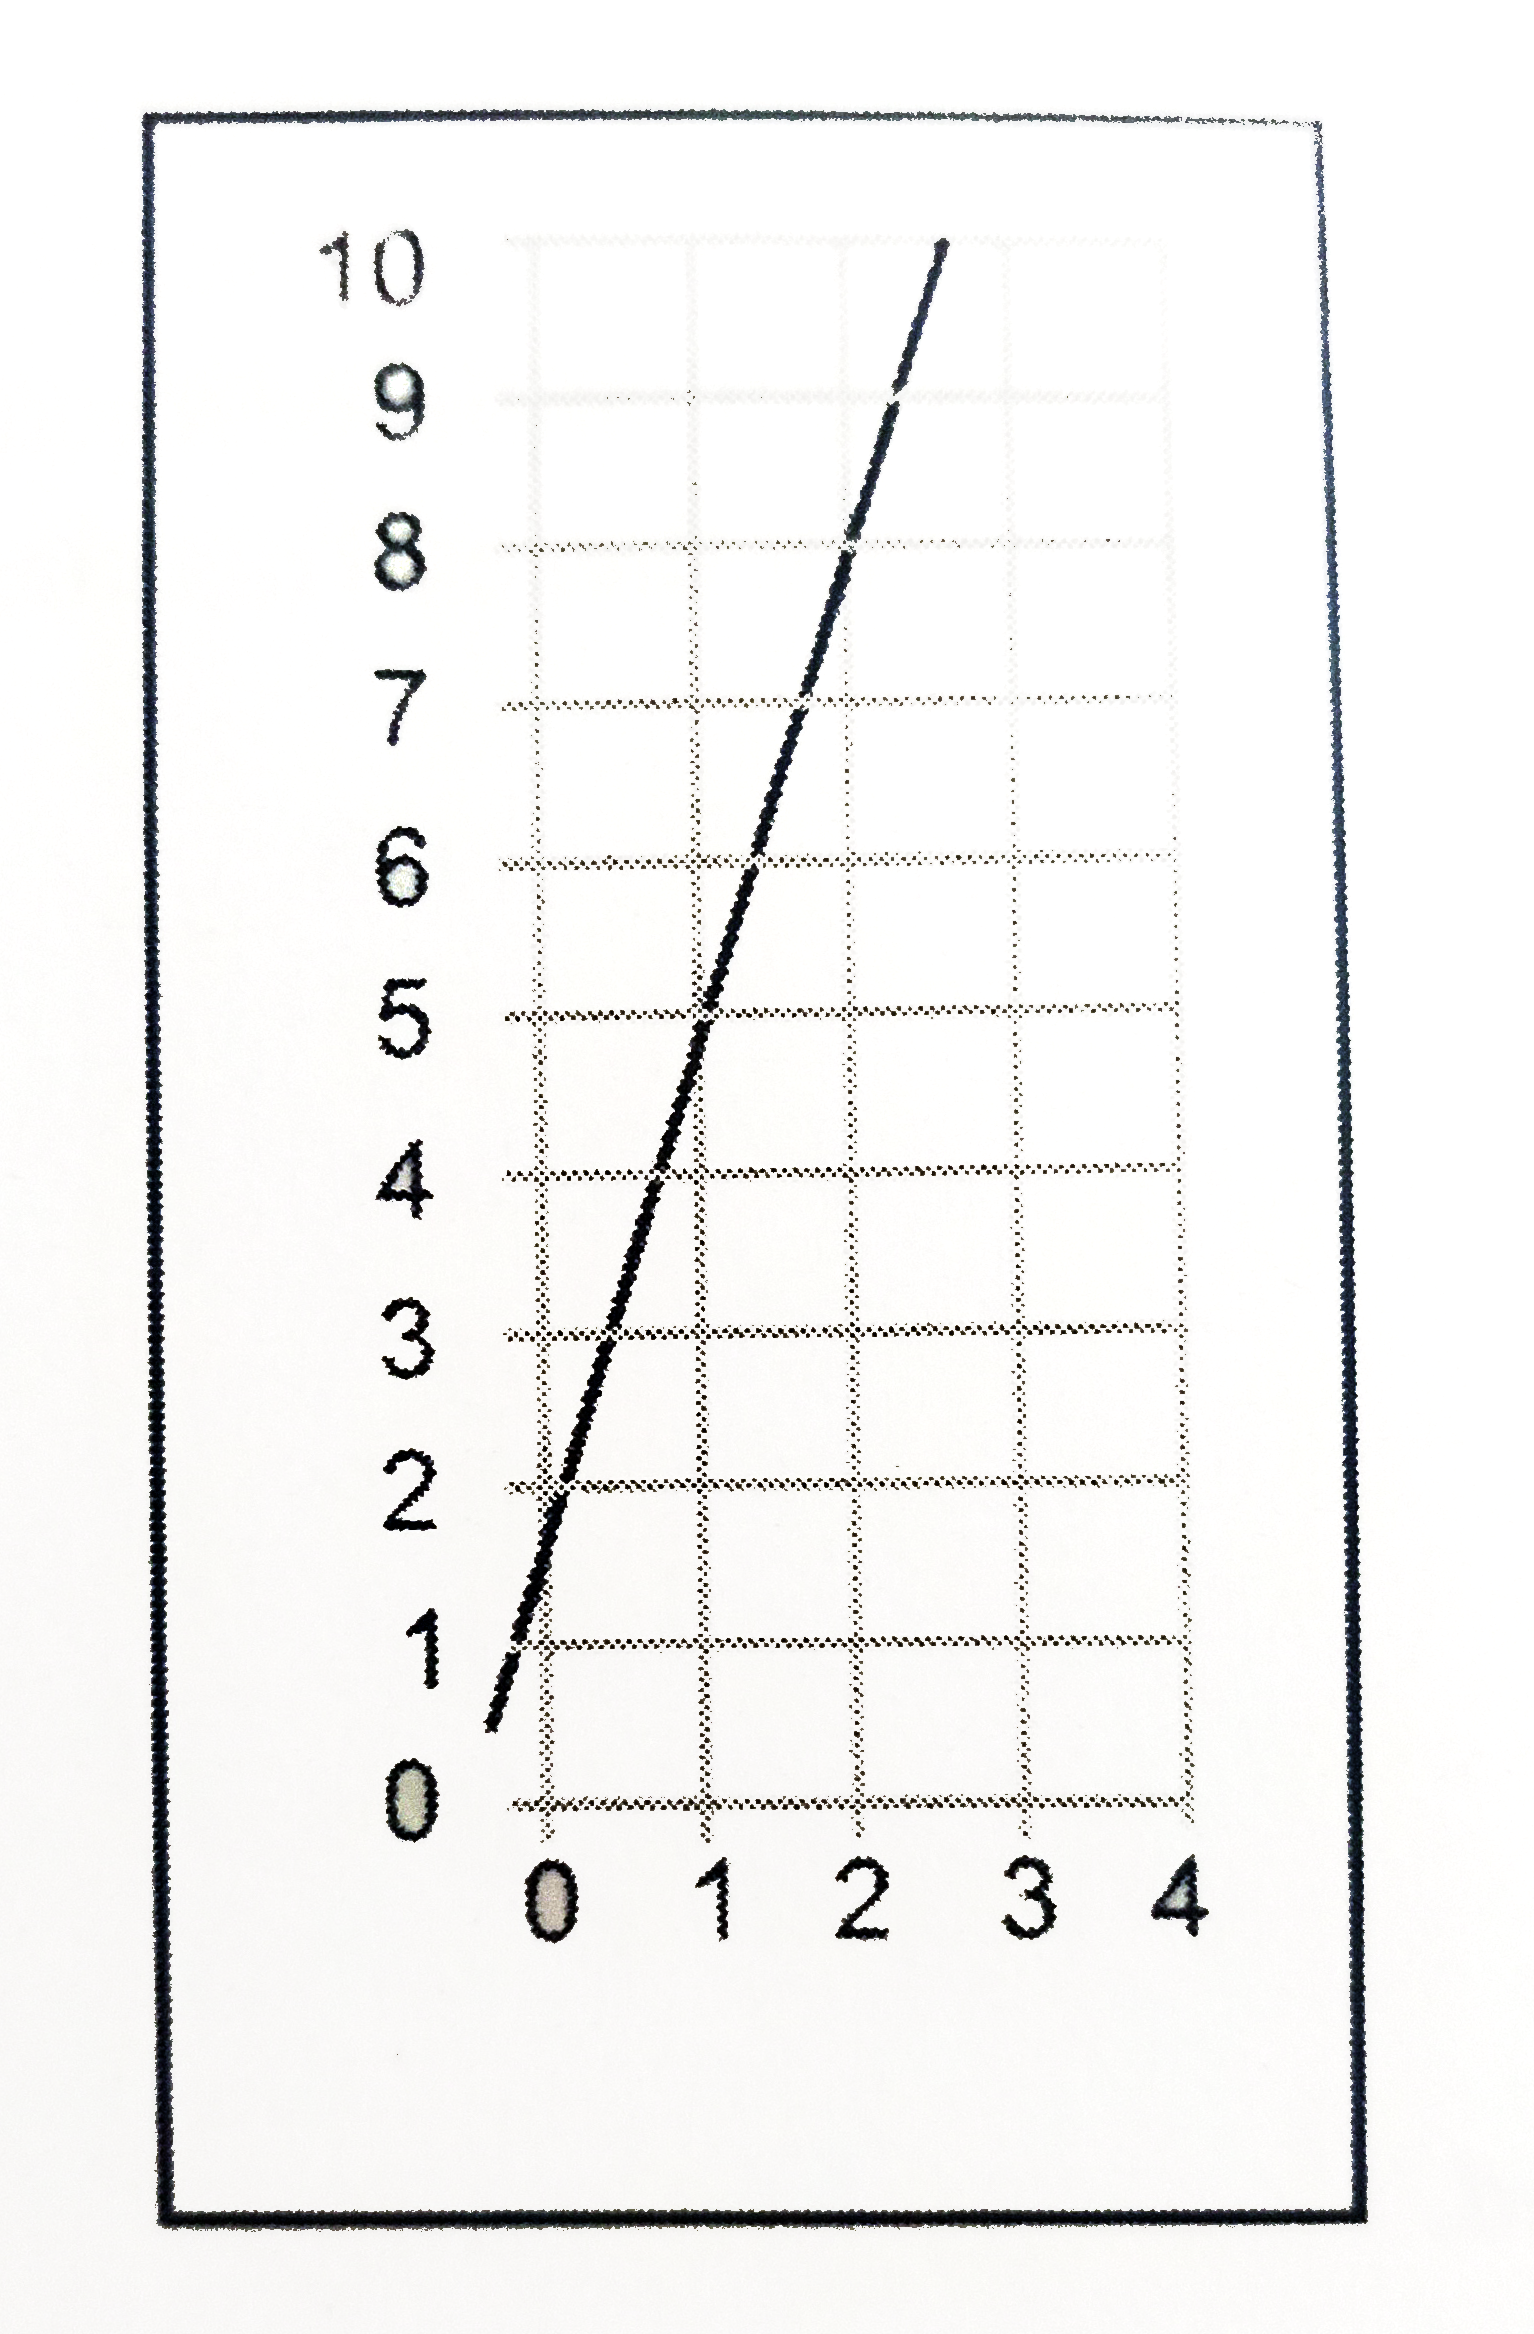
The graphe above depicts a staight line. Which of the following options could be the correct equation of the line shown?
View Solution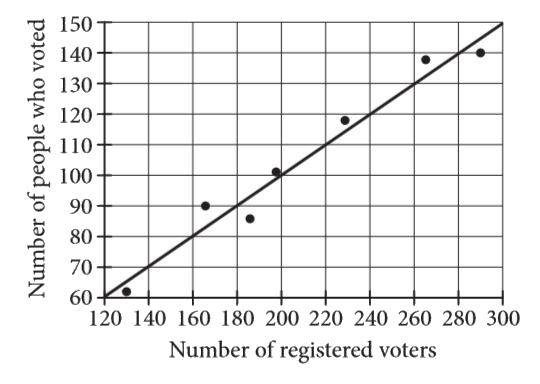
The scatterplot above shows the number of registered voters, x, and the number of people who voted in the last election, y, for seven districts in a town. A line of best fit for the data is also shown. Which of the following could be the equation of the line of best fit?
View Solution
Knowledge Check
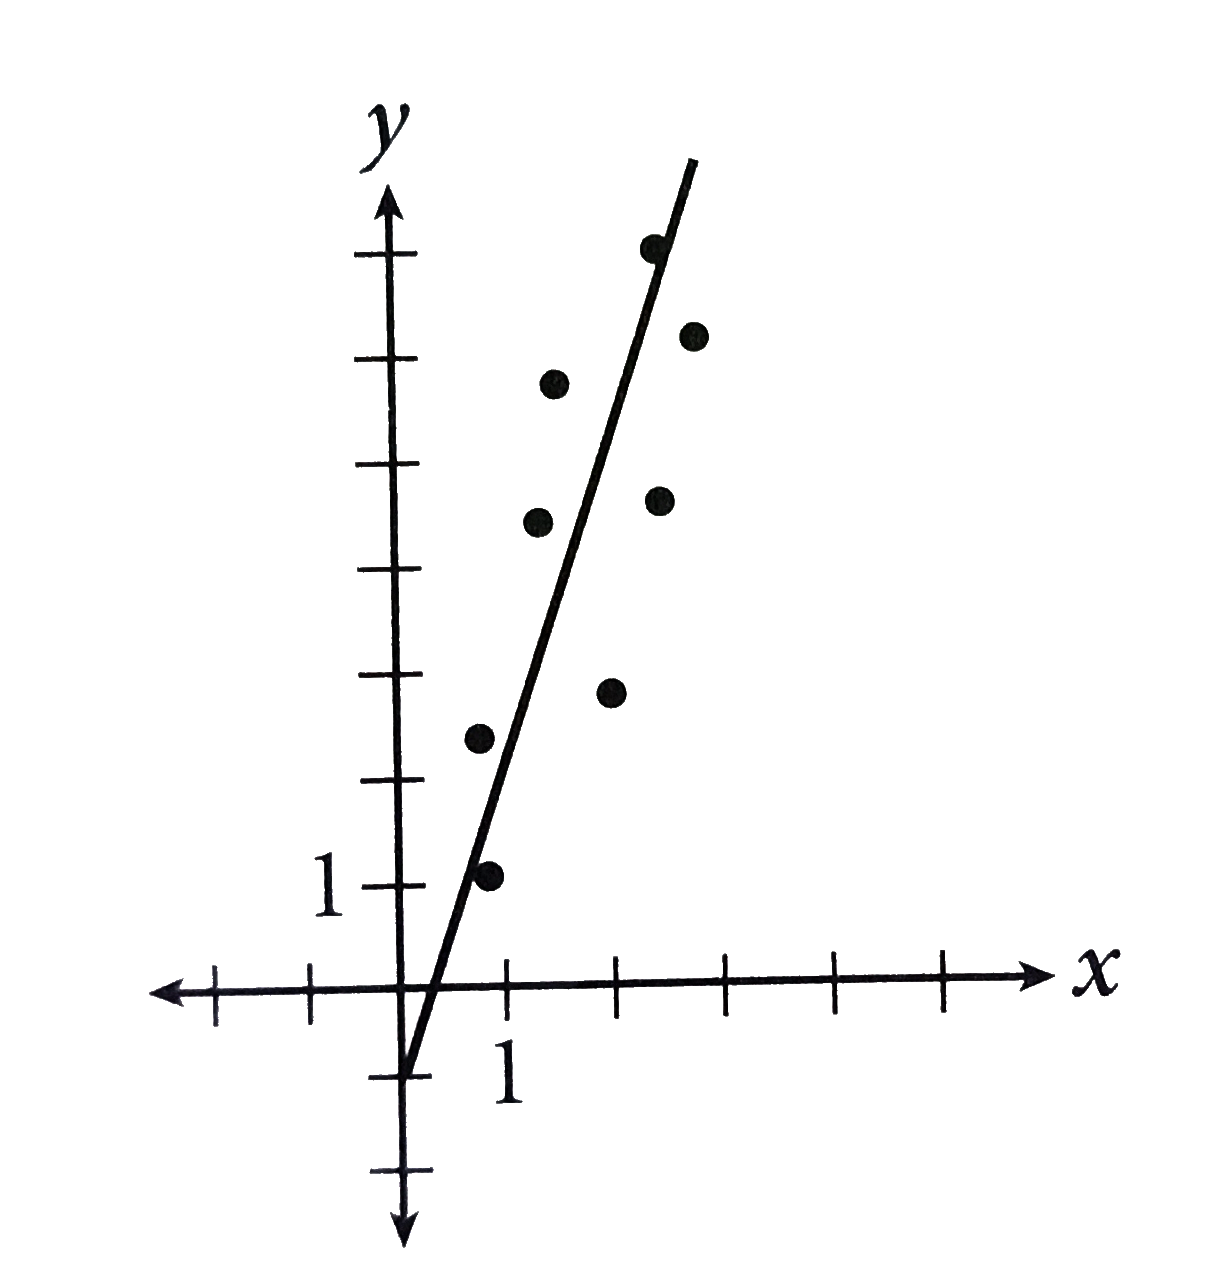
Which of the following equation corresponds to the line of best fit for the data set shown above ?Ay=0.4x−1By=0.4x+1Cy=2.5x+1Dy=2.5x−1A new fitness class was started at a chain of fitness clubs owned by the same company. The scatter plot above shows the total number of people attending the class during the first 5 months in which the class was offered. The line of best fit is drawn. If n is the number of the month, which of the following functions could represent the equation of the graph's line of best fit?
Af(x)=300n+125Bf(n)=300+125nCf(n)=400+150nDf(n)=200n+300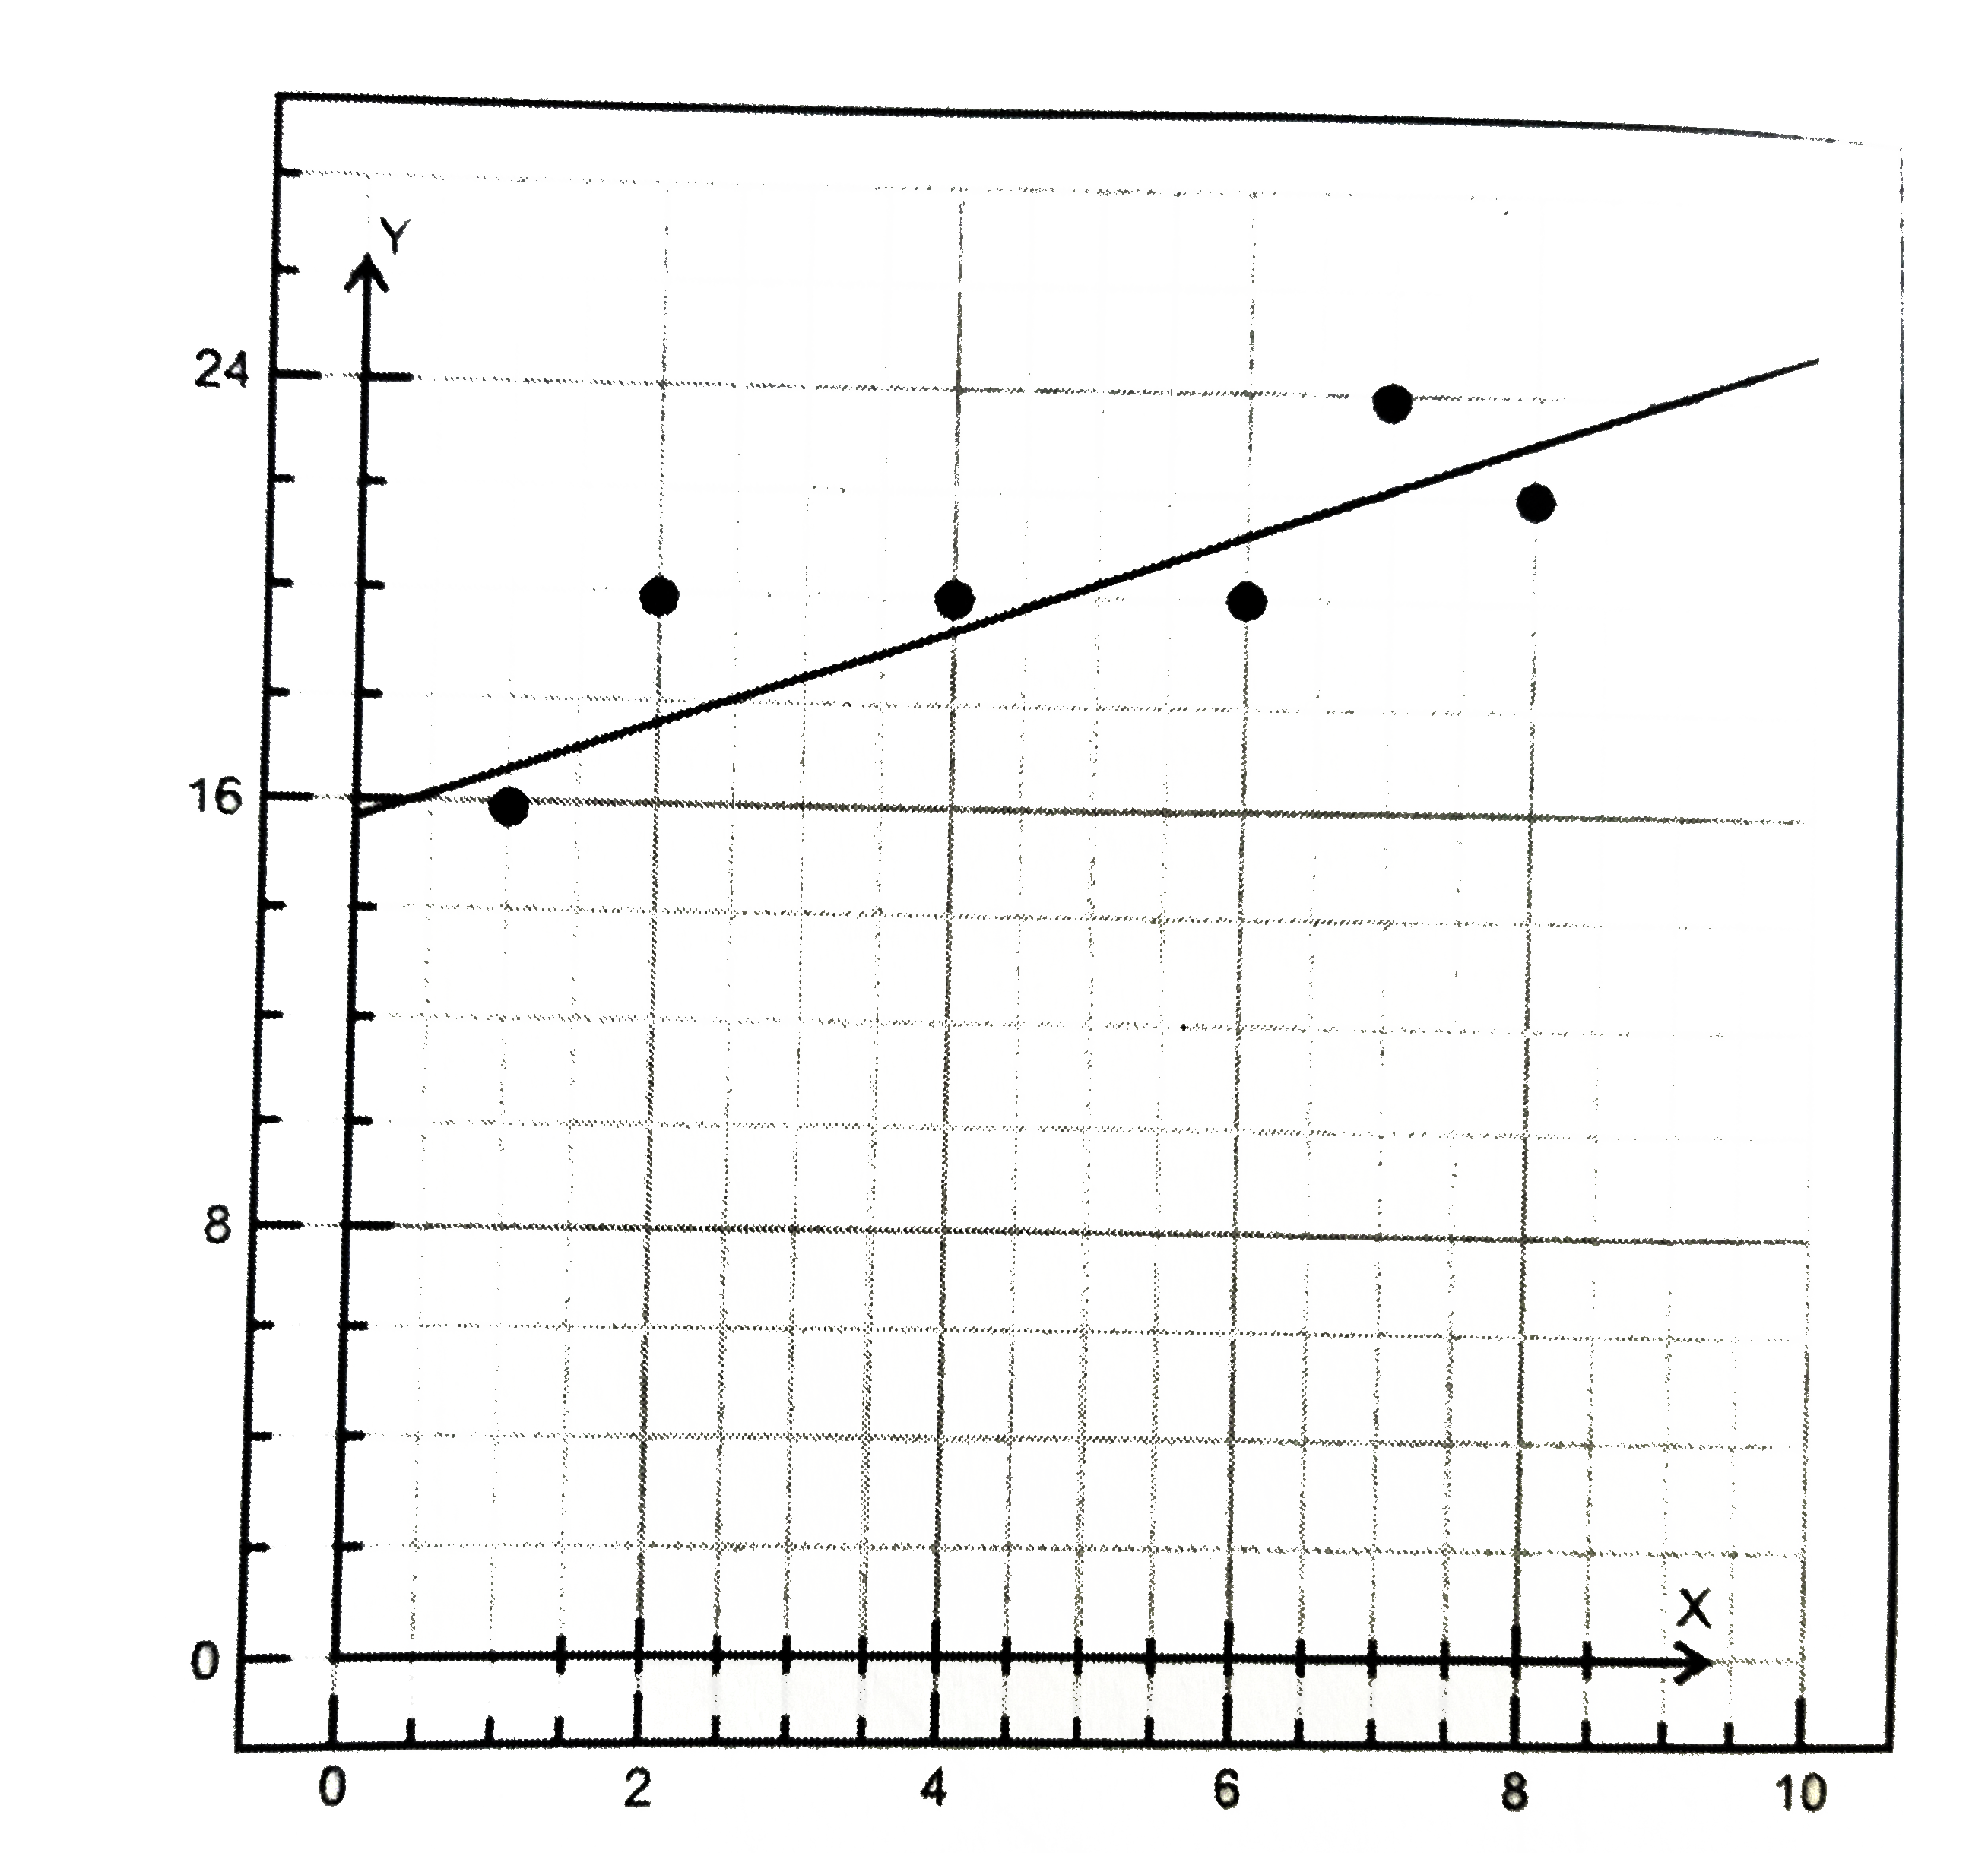
In a experiment a set of points denoted by the (x,y) coordinates are shown in the graph above along with the line of best fit. Which of the following is the best equation for the above line ?Ay = 0.7x - 3.7By = 0.9x + 15.8Cy =1.2x - 6.8Dy = 1.2x + 12.3
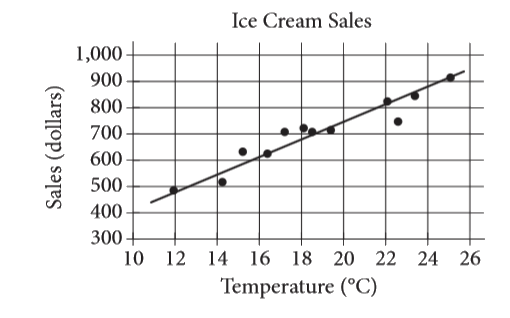
The scatterplot above shows a company’s ice cream sales d, in dollars, and the high temperature t, in degrees Celsius (.∘C), on 12 different days. A line of best fit for the data is also shown. Which of the following could be an equation of the line of best fit?
View Solution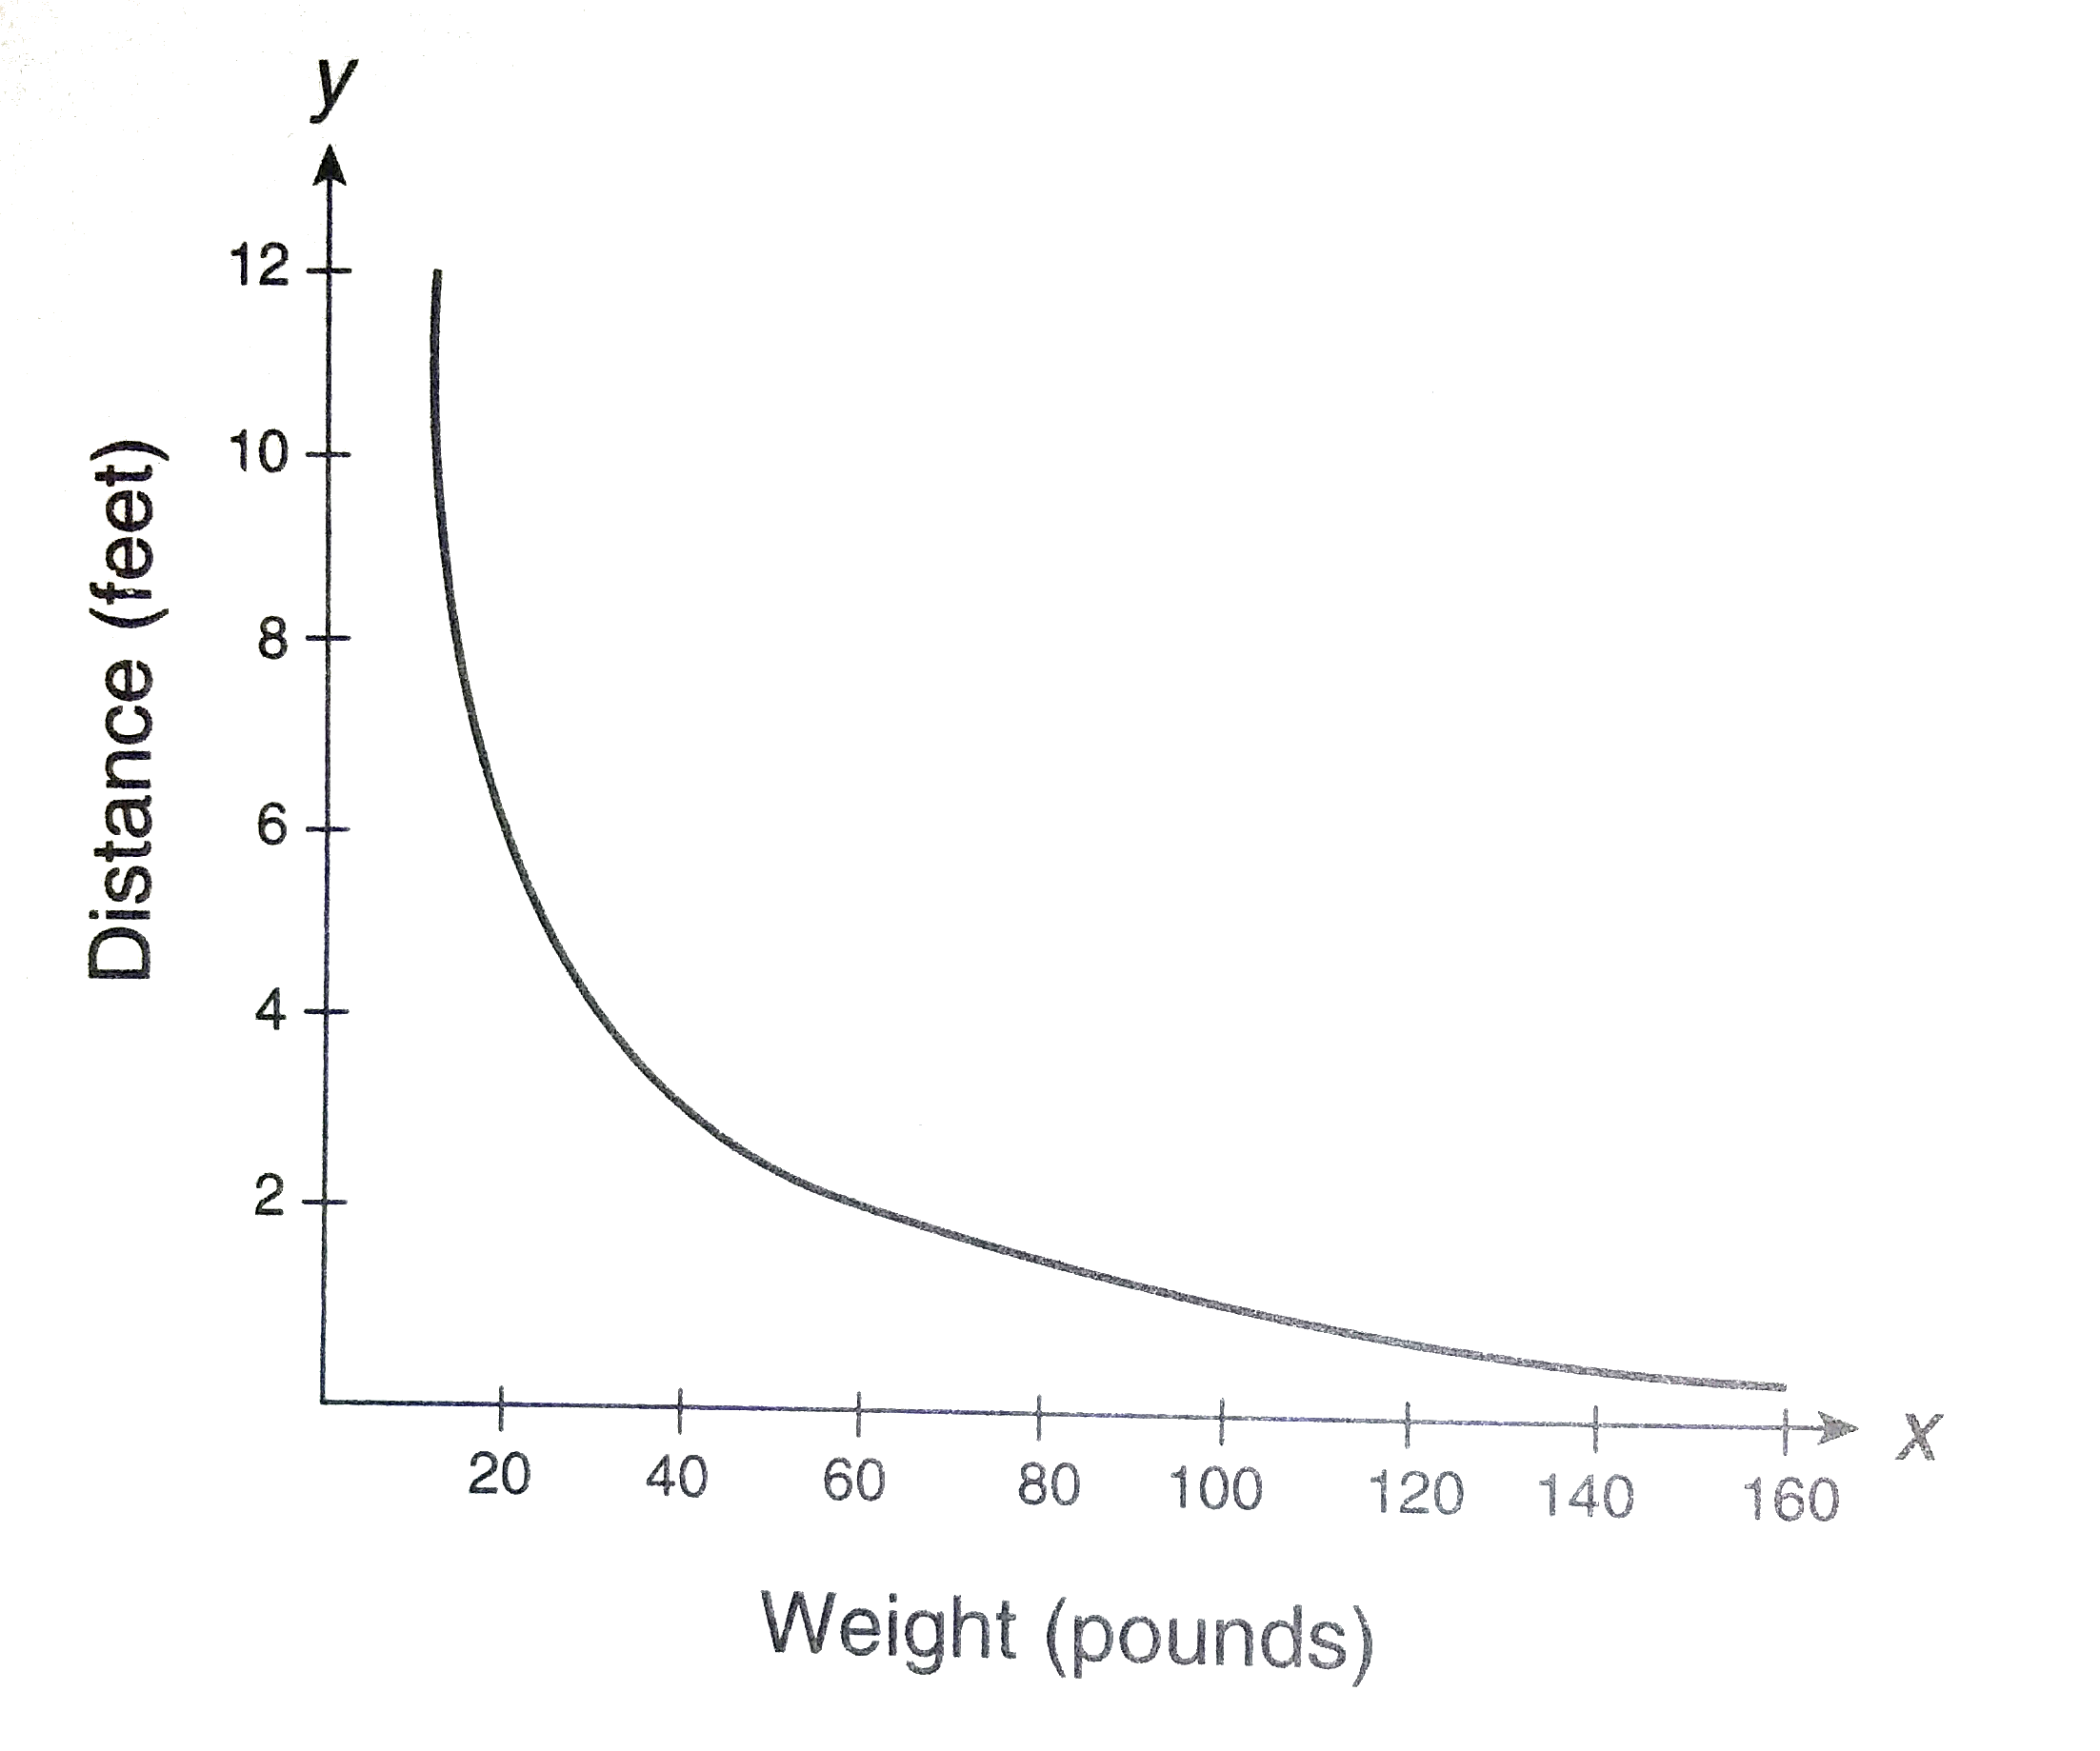
The graph above shows the relationship between a person's weight and the distance that the person must sit from the center of seesaw to make it balanced. Which of the following best represents the equation of this graph?
View Solution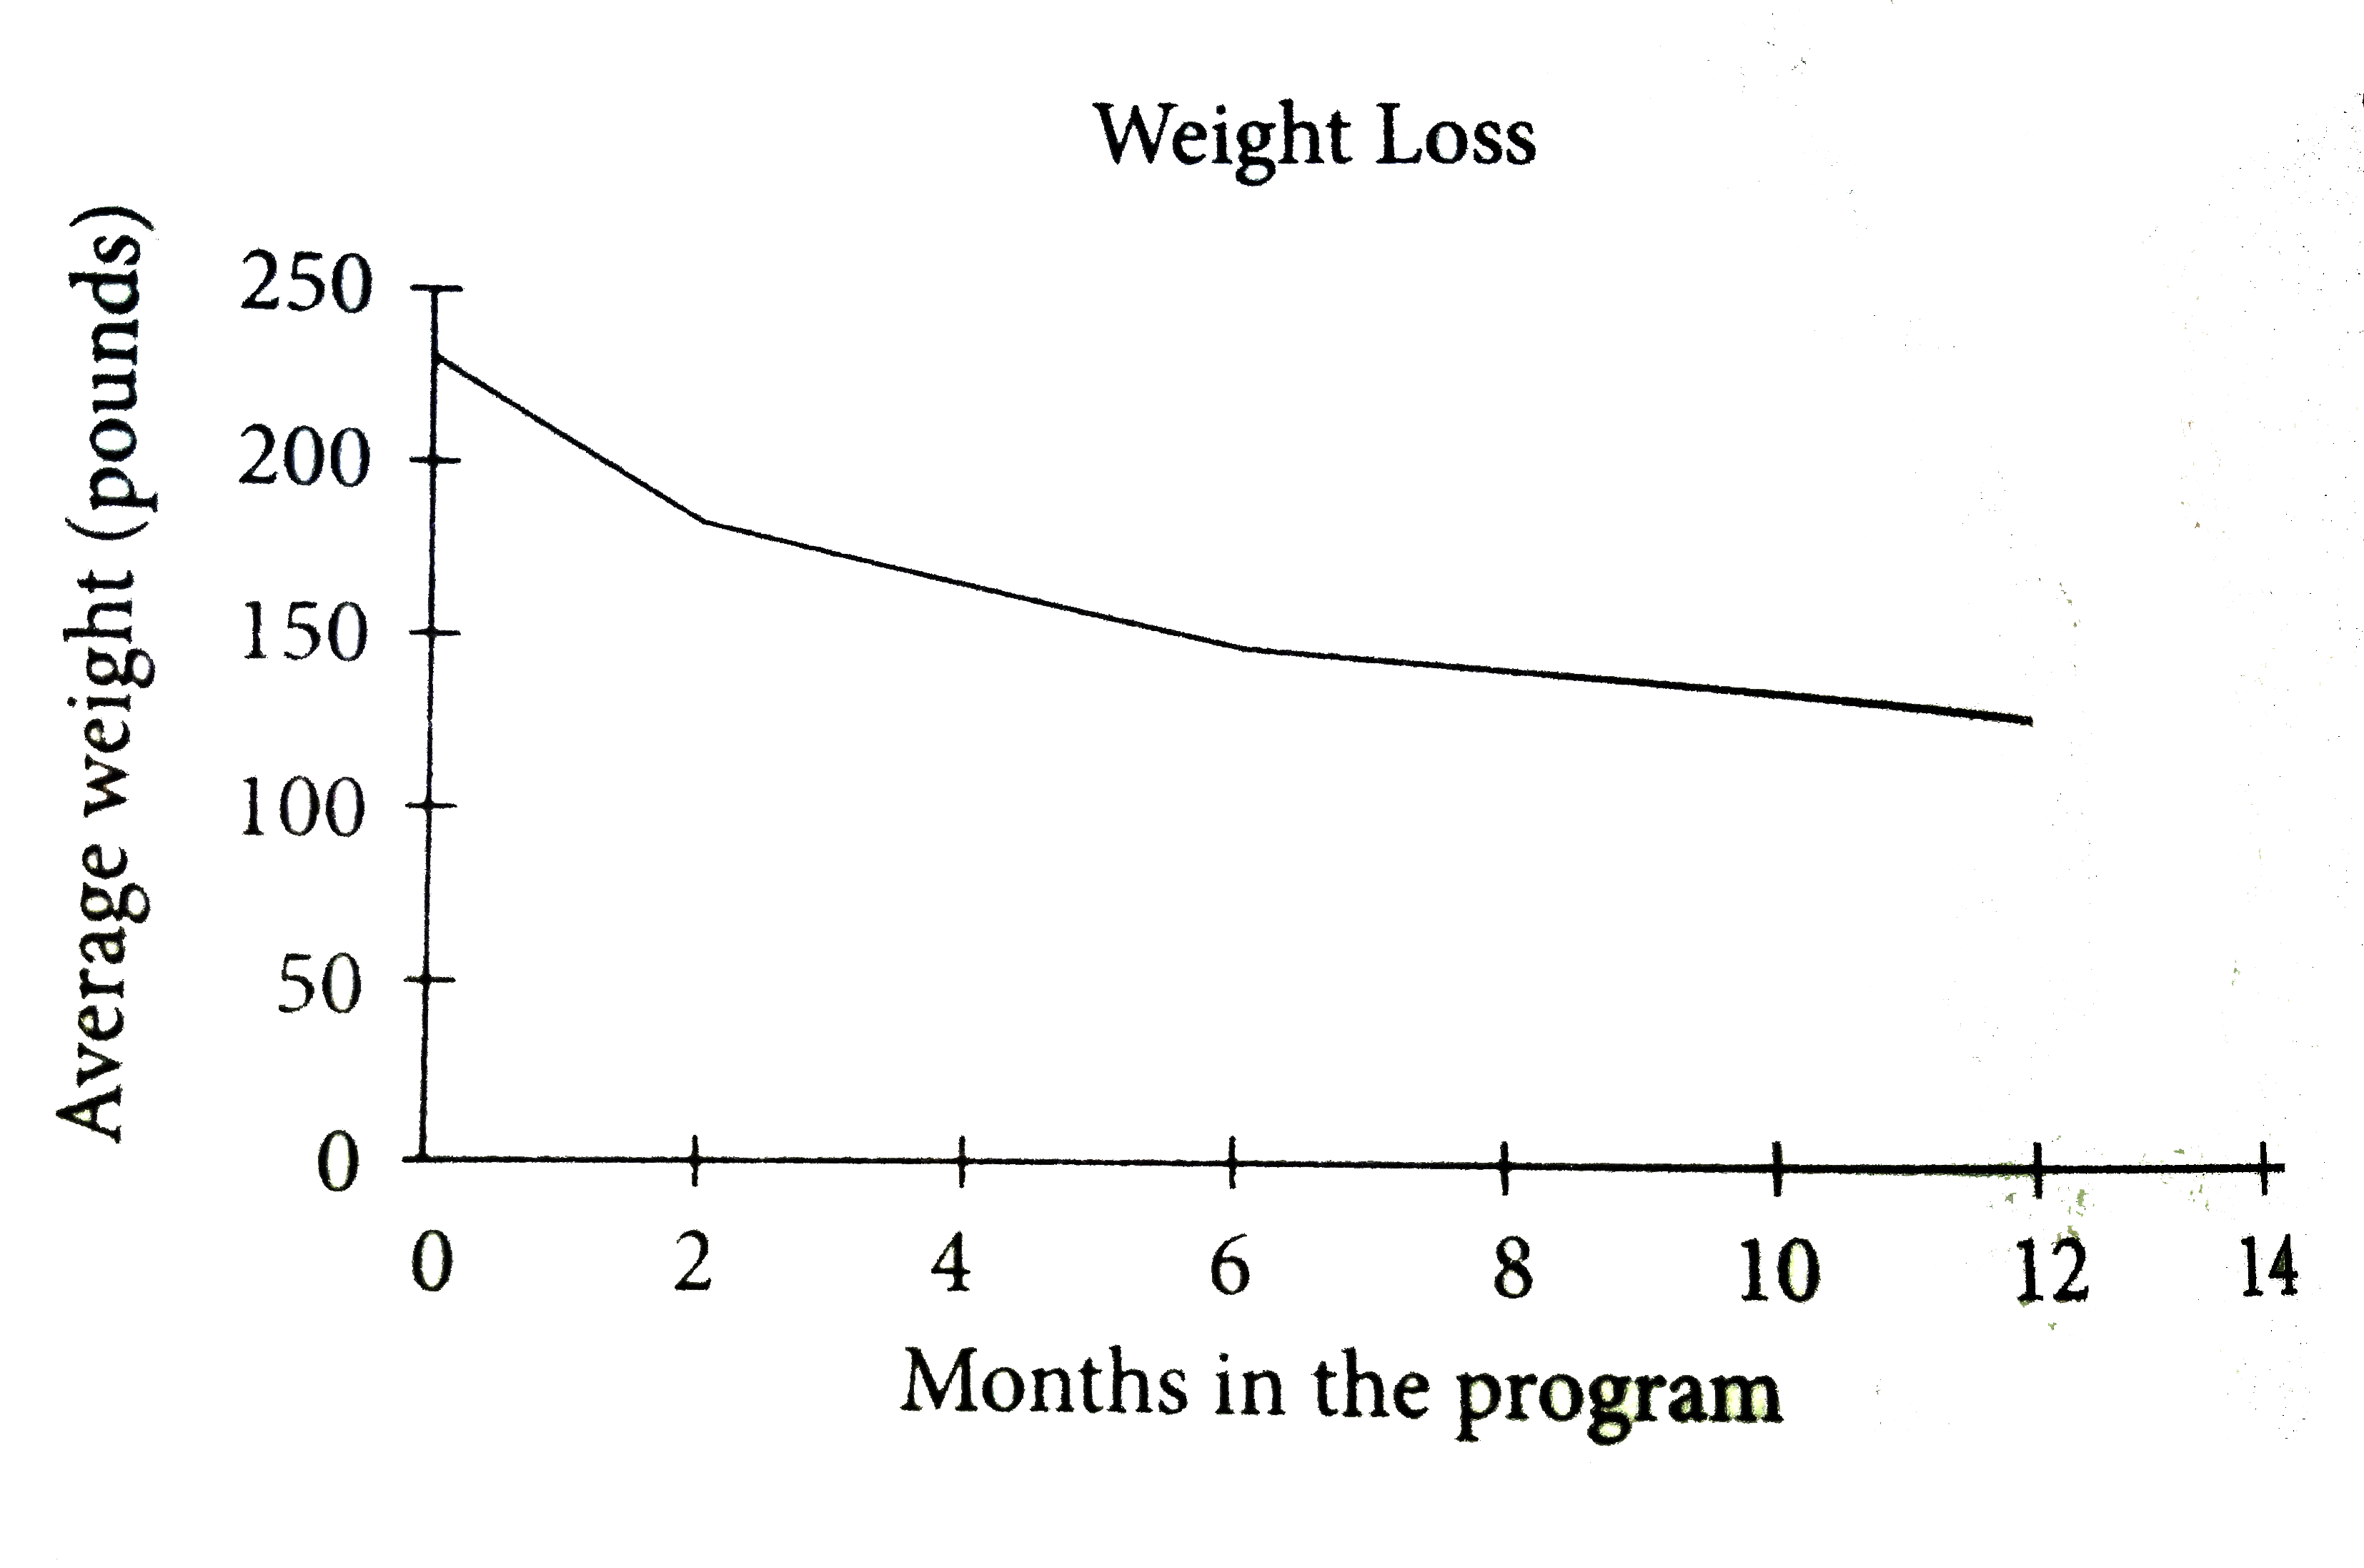
The graph above shows the average weight for the members of a weight loss program,for each month a member is in the program. According to the information in the graph, which of the following must be true?
View Solution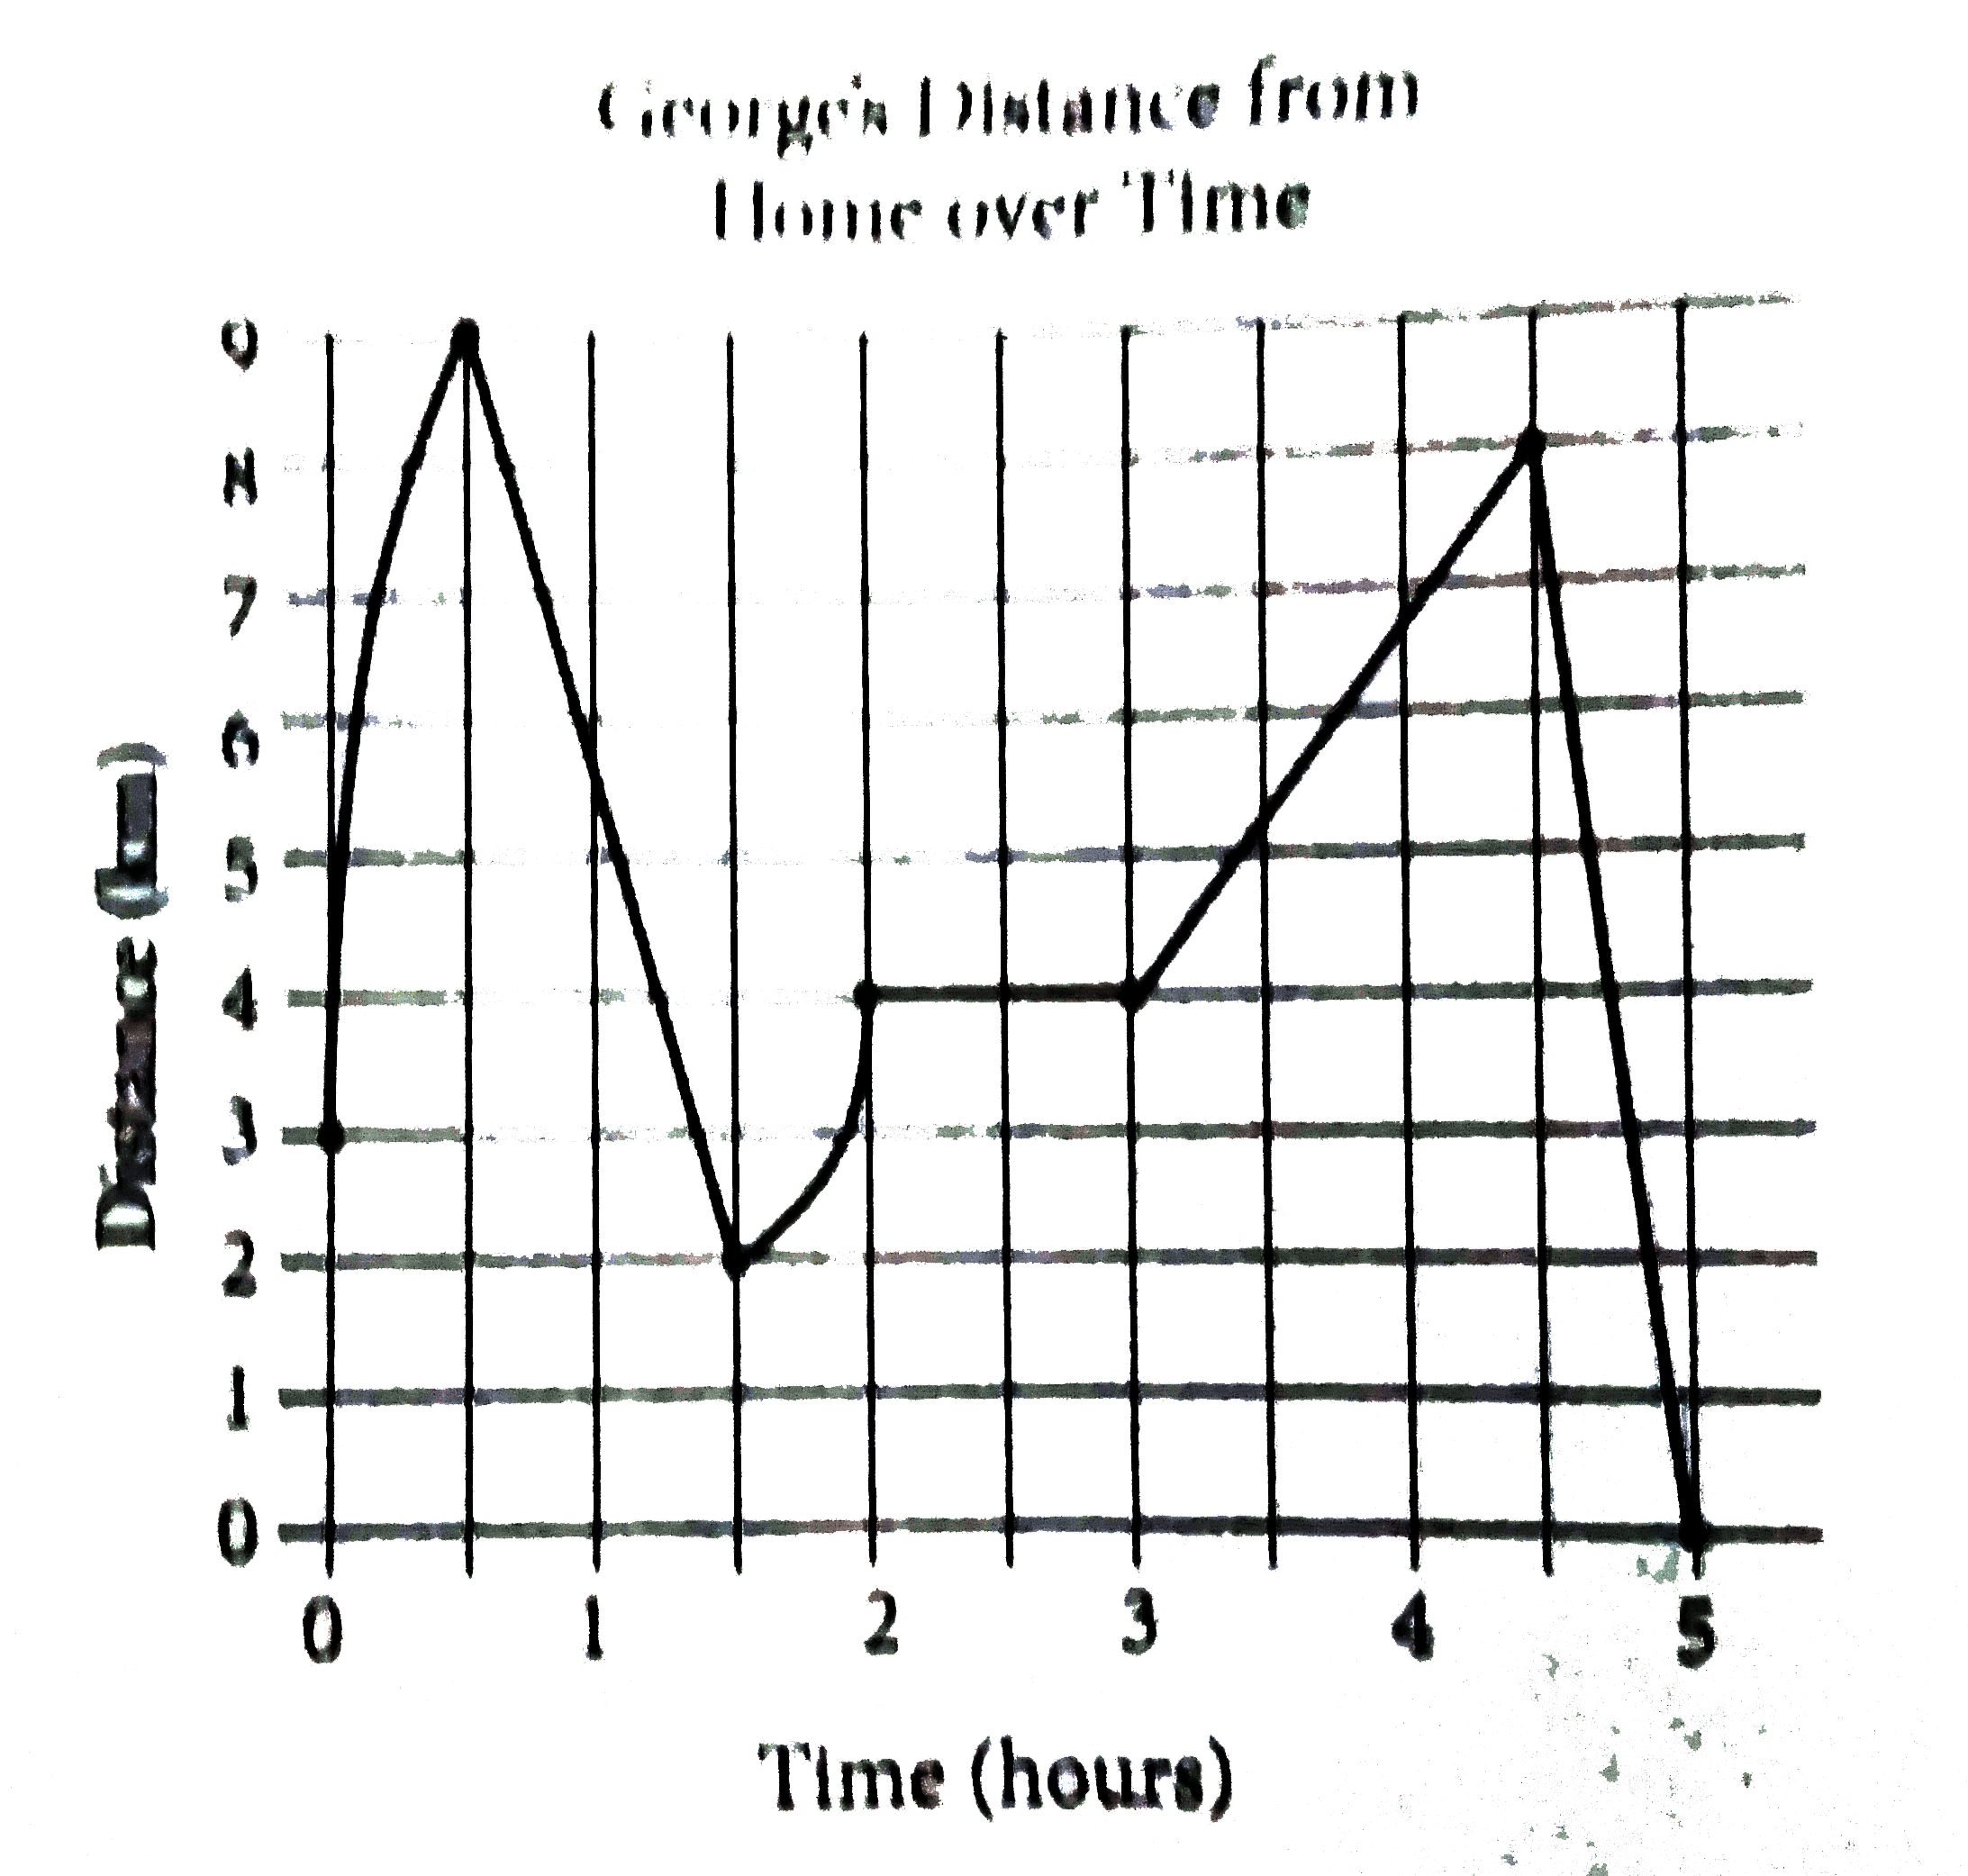
George recorded his distance from home over a five-hour period, his distance and time are shown in the graph above. According to the graph , which of the following is NOT true about the five-hour period?
View Solution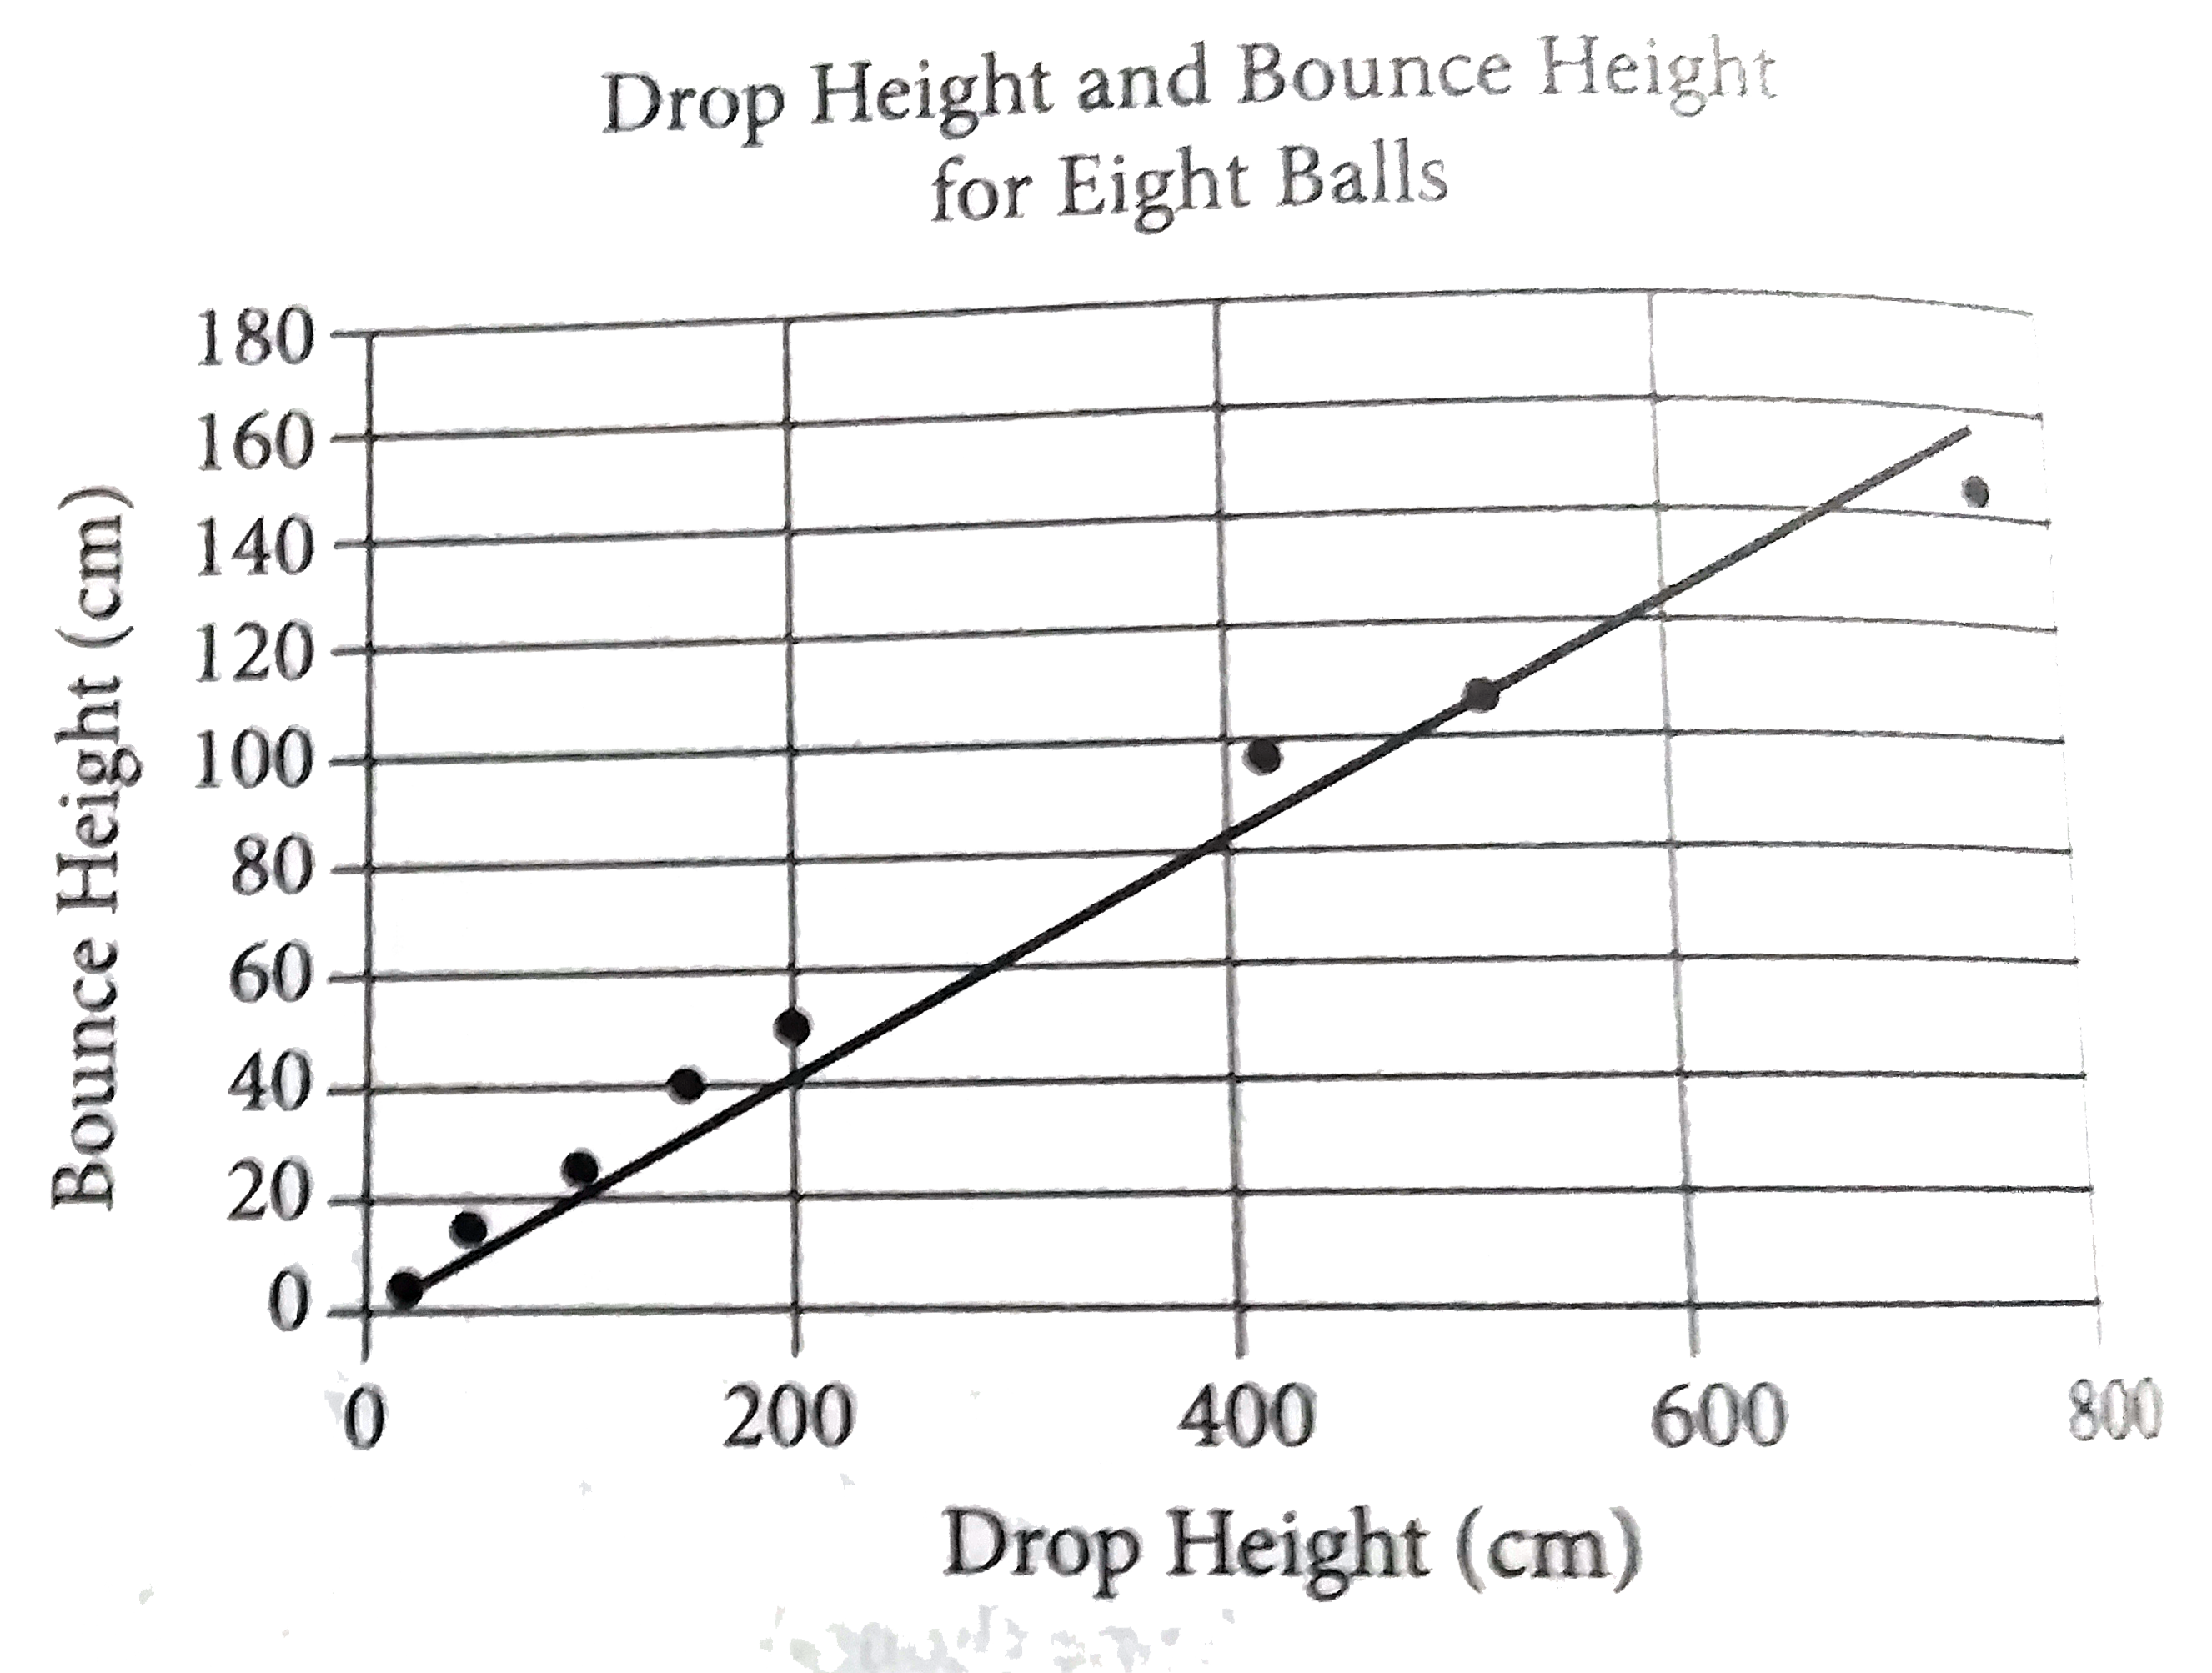
The scatterplot above shows the height in centimeters for both the drop and bounce of eight different balls of the same type. The line of best fit for the data is also shown. According to the lines of best fit, which of the following is closest to the predicted increase in bounce height, in centimeters, for every increase of 100 centimeters in drop height?
View Solution
