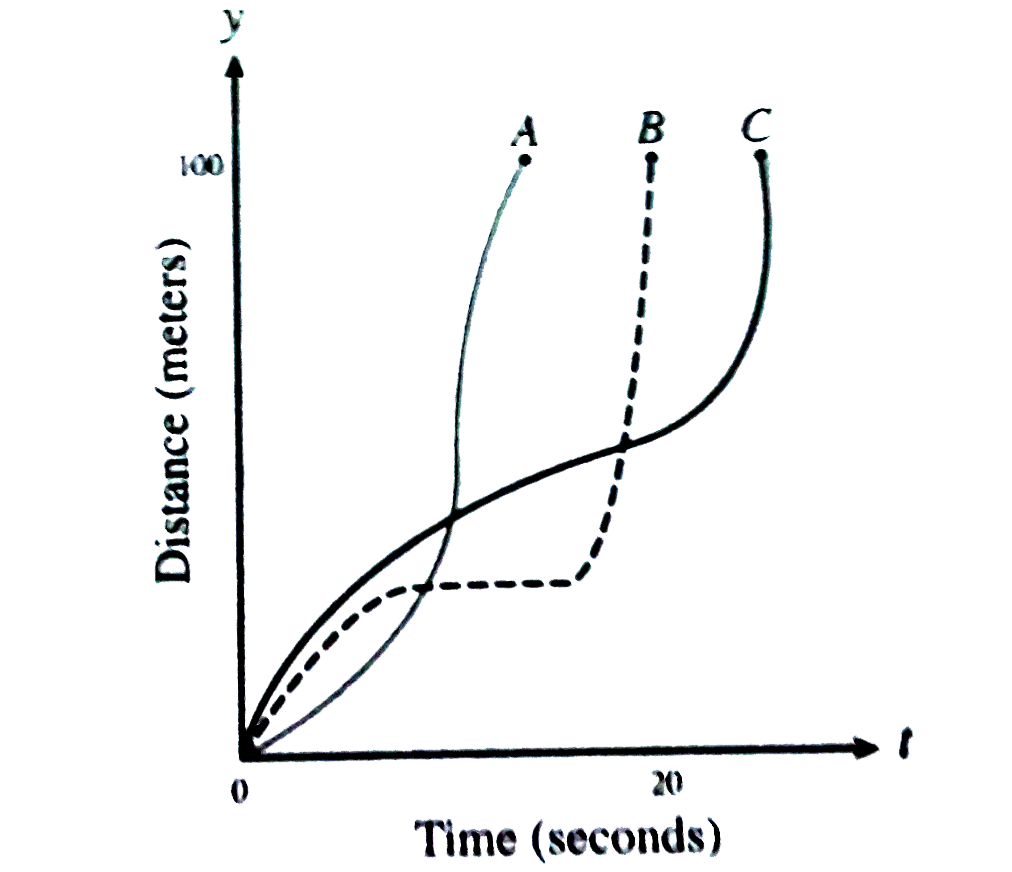
Three runners complete in a 100-meter obstacle race. The graph above depicts the distance run as a function of time for each runner . Which is not a valid conclusion ?
Runner A won the race
Runner B fell, then got up and completed the race
Each of the runners , A , B and C comleted the race.
Runner C was ahead of runners A and B for a least half of the distance run.
The correct Answer is:D
Step by step video, text & image solution for Three runners complete in a 100-meter obstacle race. The graph above depicts the distance run as a function of time for each runner . Which is not a valid conclusion ? by Maths experts to help you in doubts & scoring excellent marks in Class 12 exams.
Updated on:21/07/2023Topper's Solved these Questions
Similar Questions
Luge is a winter sport in which a person slides down an ice track feet first on a small sled. The luger lies supine (on his back) and uses his calf and shoulder muscles to steer the sled. Below is a summary of the times, in seconds, of three luger's practice runs on a track in Utah.
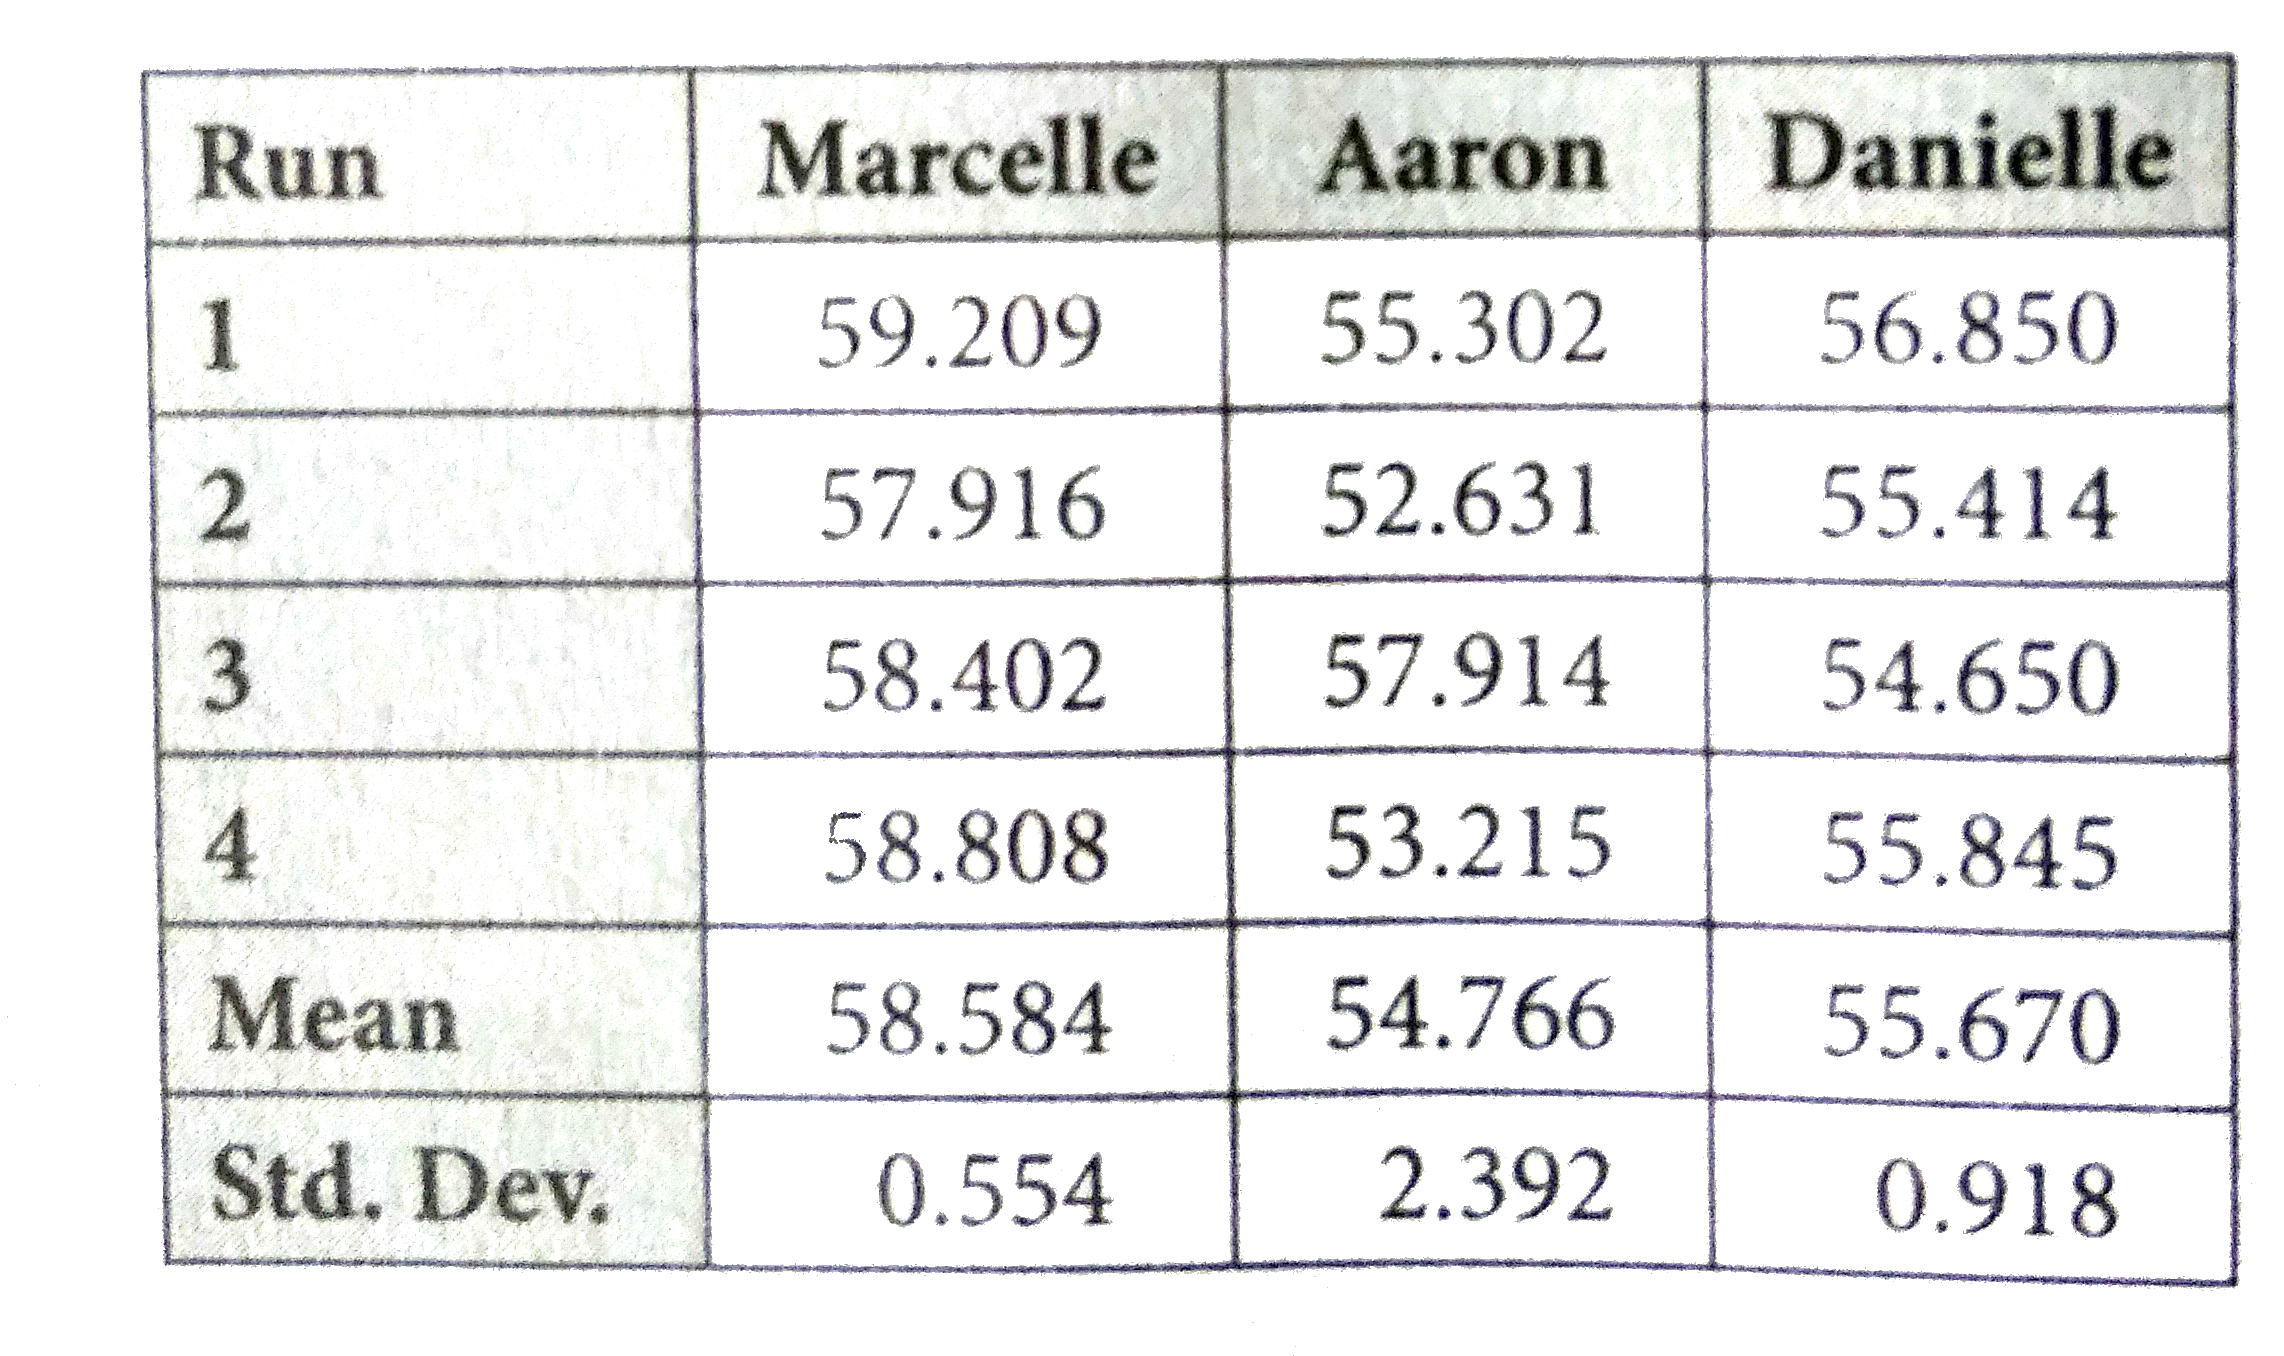
Which of the following conclusions can be drawn based on th data in the table?
View SolutionTwo runners in a 100-m race start from the same place. Runner A starts as soon as the starting gun is fired and runs at a constant speed of 8.00 m/s Runner B starts 2.00 s later and runs at a constant speed of 10 m/s :-
View Solution
Knowledge Check
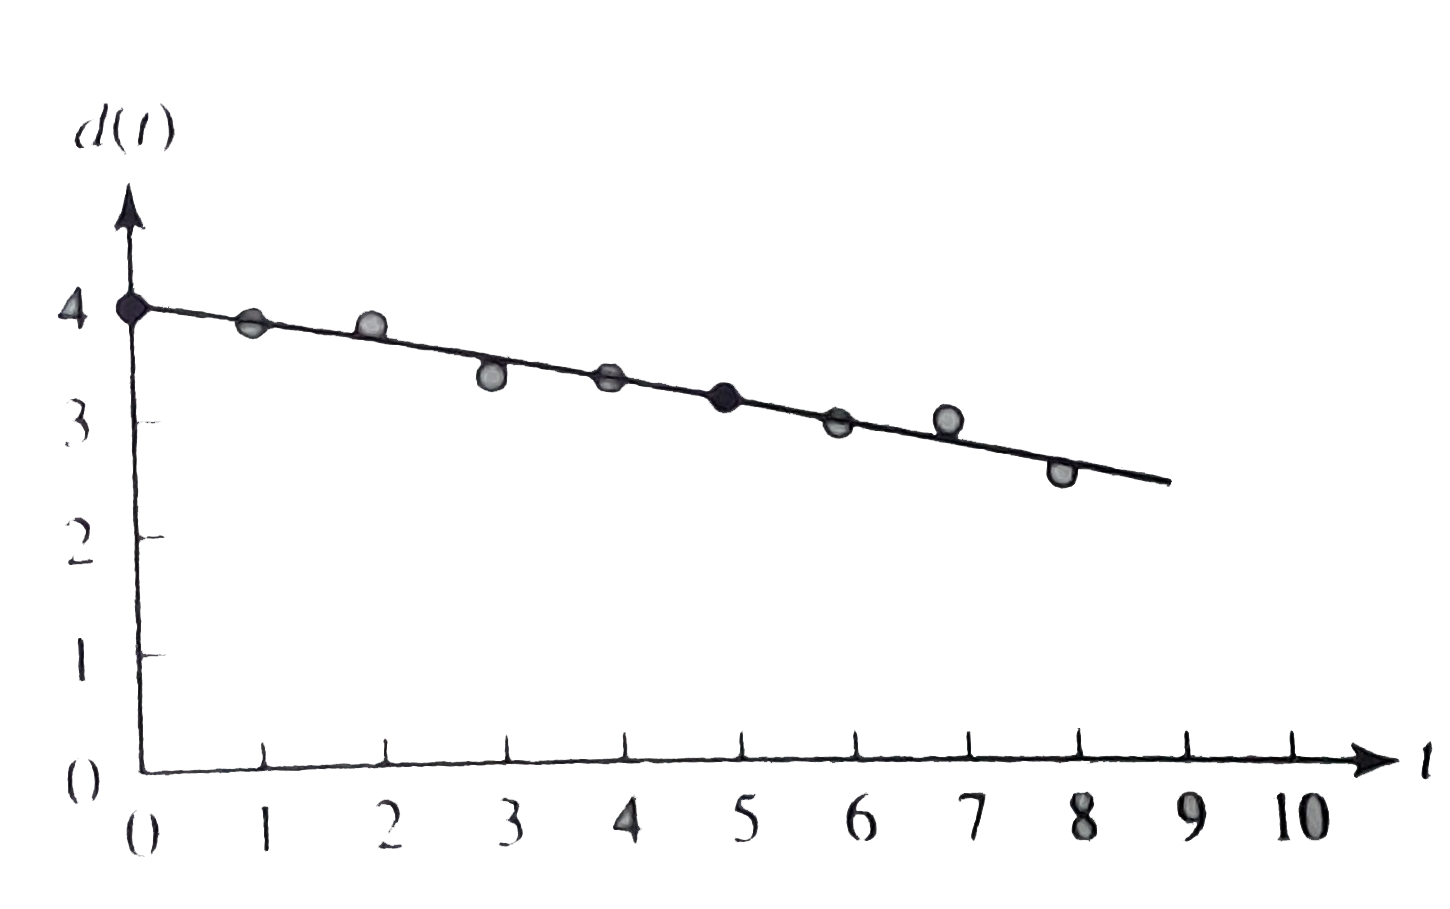
Joe bikes 4 kilometers to school . Because of the traffic and road conditions along the way , his speed varies. The dots on the graph above show his distance from the school at various times , starting at home at t=0 (black dot). After 5 minutes Joe is 3.2 kilometers from the school (second black dot). The data show that his speed is almost constant , and his distance from the school can be approximated by a straight line . The graph of the function that models Joe's distance from school as a function of time , in minutes , is shown as a solid line. Which of the following equations best represents this function ?Ad(t)=-0.5 t+4Bd(t)=-0.16 t +4Cd(t)=-6.25 t+4Dd(t)=0.16 t +4Starting at her doorstip, Ramona walked down the sidewald at 1.5 feet per second for 4 seconds, Then she stopped for 4 seconds, realizing that she had forgotten something. Next she returned to her doorstep along the same route at 1.5 feet per second. The graph of Ramona's distance (d) from her doorstep as a function of time (t) would most resemble which of the following?
A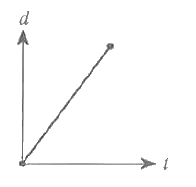 B
B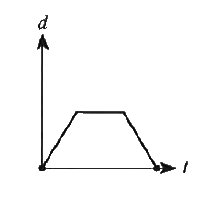 C
C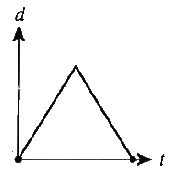 D
D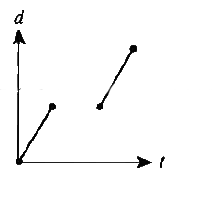
To commute to his office, Mr. Brown can take either the A train or B train. Both train stations are the same distance from his apartment, and both stations claim that on average they run 10 minutes late from the scheduled arrival time . The standard deviation for the A train is 1 minute and for the B train is 5 minutes . Which of the following is a valid conclusion for Mr. Brown ?
AIf he regularly takes the A train, he will arrive at approximately the same time every day .Bif he takes the A train , he is less likely to arrive lateCIf he takes the A train, he is more likely to be 15 minutes late than with the B train.DIf he takes the A train , he is more likely to arrive on time.
A position-time graph for linear motion of an object in one dimension shows the object's displacement d from some origin at any given time t. If the graph is linear, its slope m is given by
m=riserun=charge in dcharge in t=d1−d2t1−t2=¯v,
where ¯v is the average velocity of the object . (t1,d1) and (t2,d2) are any two points on the line. The graph above is a position time graph for a person who takes a walk from her house .
Which of the following scenarios is consistent with the graph ?
View Solution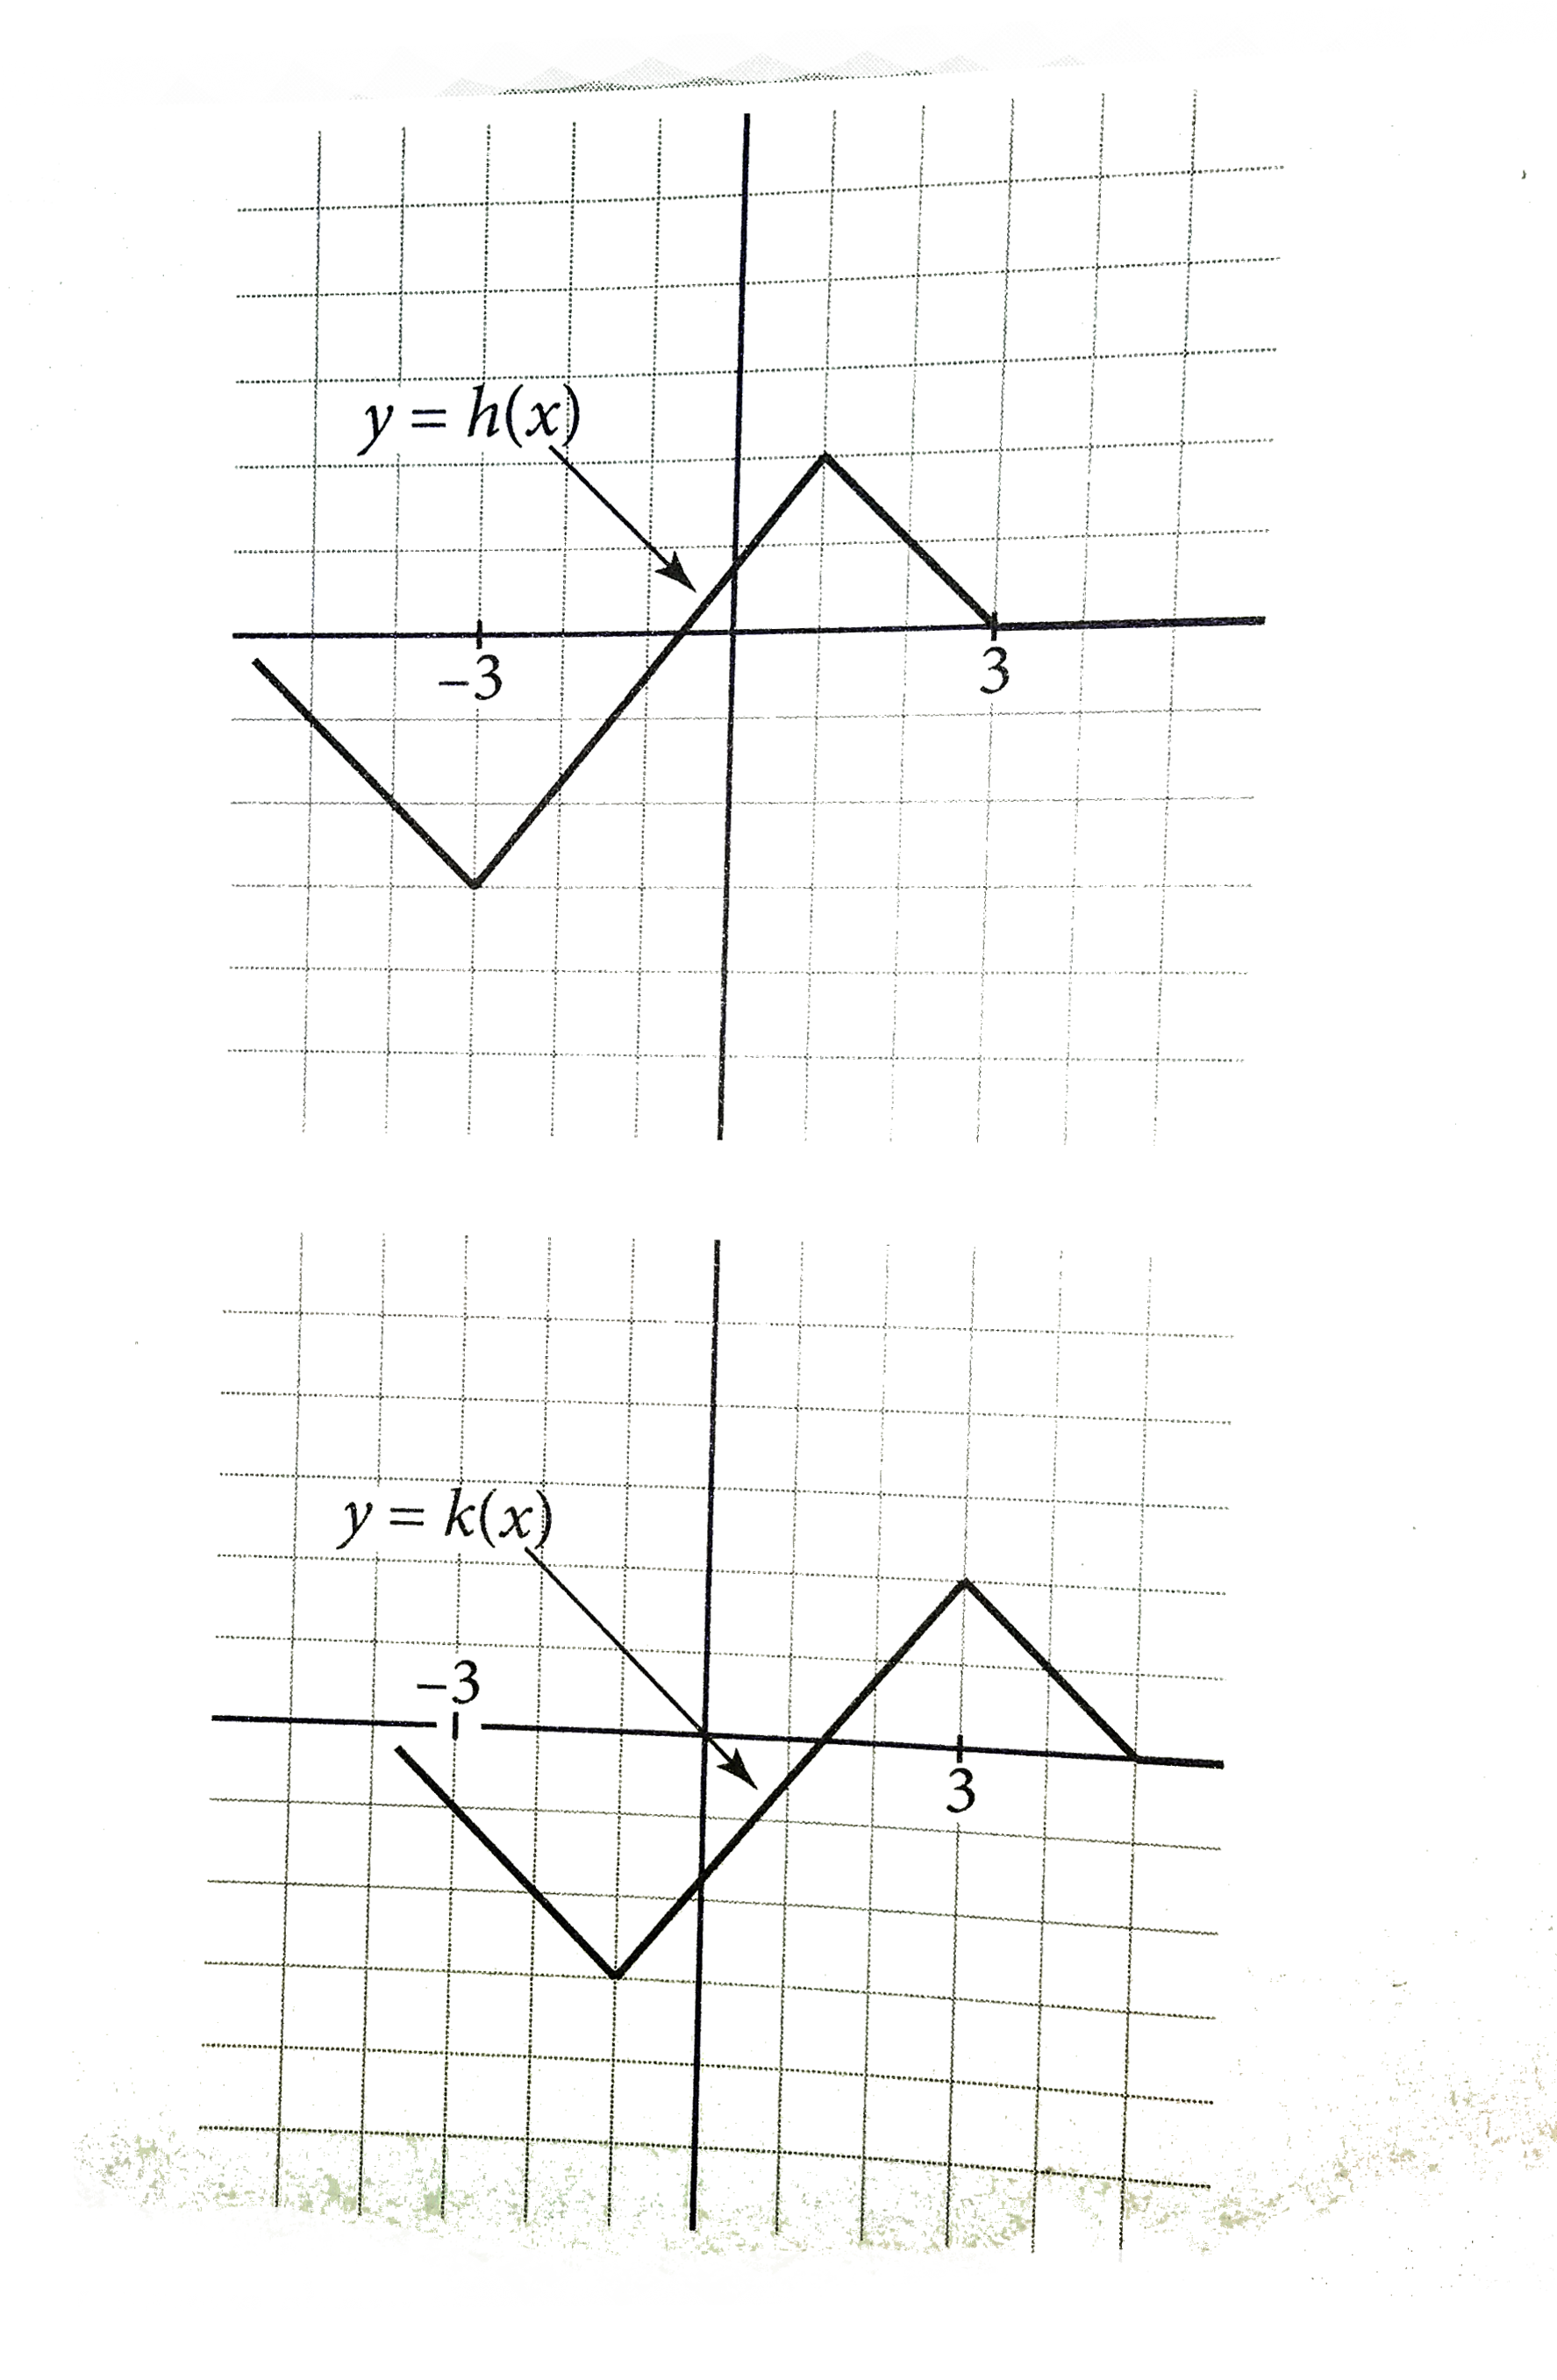
The graphs above show the complete functions h and k. which one of the following expresses k(x) in terms of h(x)?
View SolutionThe mass of living organisms in a lake is defined to be the biomass of the lake. If the biomass in a lake doubles each year, which of the following graphs could model the biomass in the lake as a function of time? (Note: In each graph below, O represents (0, 0).)
View SolutionThree copy machines- A,B and C- copy at the same rate and will all be used to make copies of a report. At 8:00 a.m., all 3 machines begin copying Machine A breaks down at 10:00 a.m. And is back in service at 1:00 p.m. Machine B breaks down at 12:00 p.m. (noon) and begins copying again at 3:00 p.m. All 3 machines finish copying at 5:00 p.m. when the copying of the report is complete. One of the following graphs showns n, the numbers of copies made, as a function of t, the time at any given point during the copying. Which graph is it?
View Solution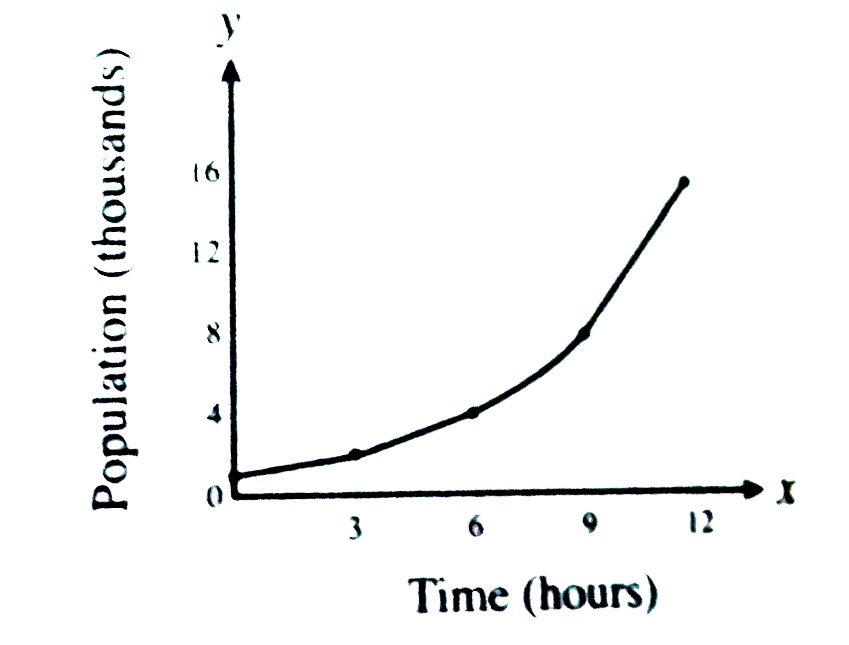
The graph above shows the size of a certain population after time t. Which of the following equations correctly shows y as a function of t ?
View Solution