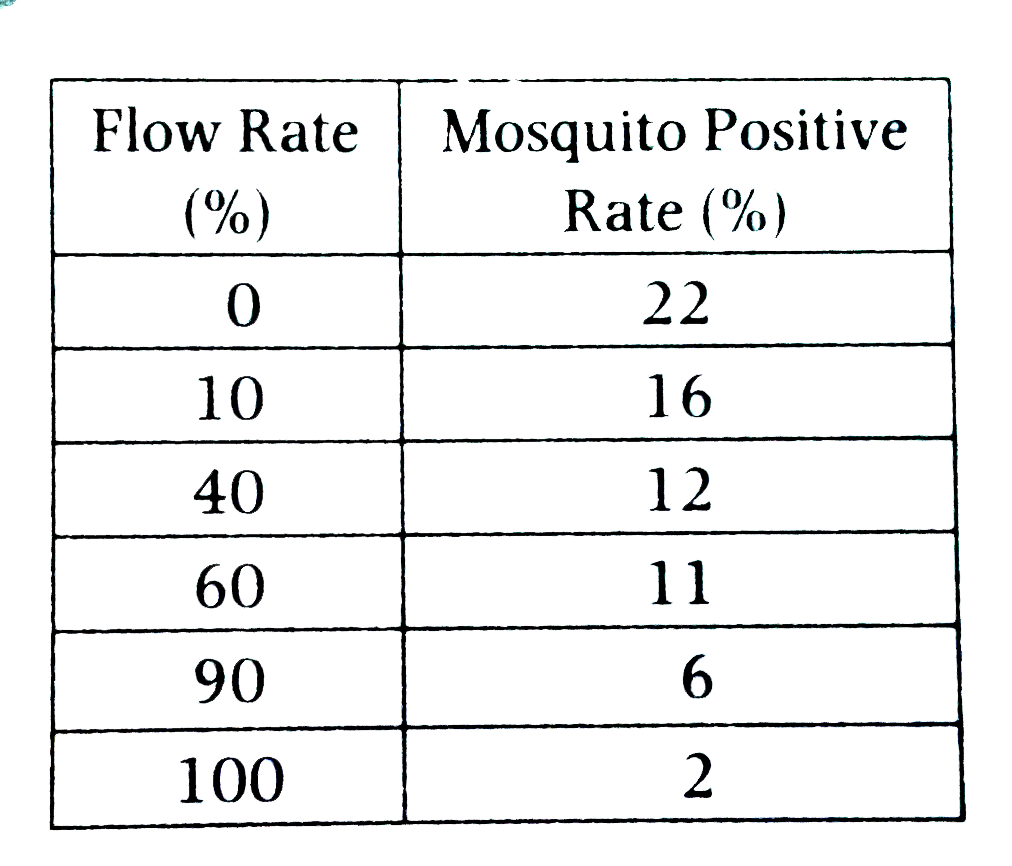
The table above shows the relative abundance of mosquitoes (as measured by the mosquito positive rate ) versus the flow rate (measured as a percentage of maximum flow ) of a river in China .
Which of the following is a valid conclusion from the data ?
The faster the river flows , the greater the abundance of mosquitoes
When the flow rate of the river is about half its maximum , the mosquito positive rate is between 11 and 12 percent .
At minimum flow rate , the mosquito population is close to 0
At maximum flow rate , just 2 mosquitoes were observed.
The correct Answer is:B
Step by step video, text & image solution for The table above shows the relative abundance of mosquitoes (as measured by the mosquito positive rate ) versus the flow rate (measured as a percentage of maximum flow ) of a river in China . Which of the following is a valid conclusion from the data ? by Maths experts to help you in doubts & scoring excellent marks in Class 12 exams.
Topper's Solved these Questions
Similar Questions
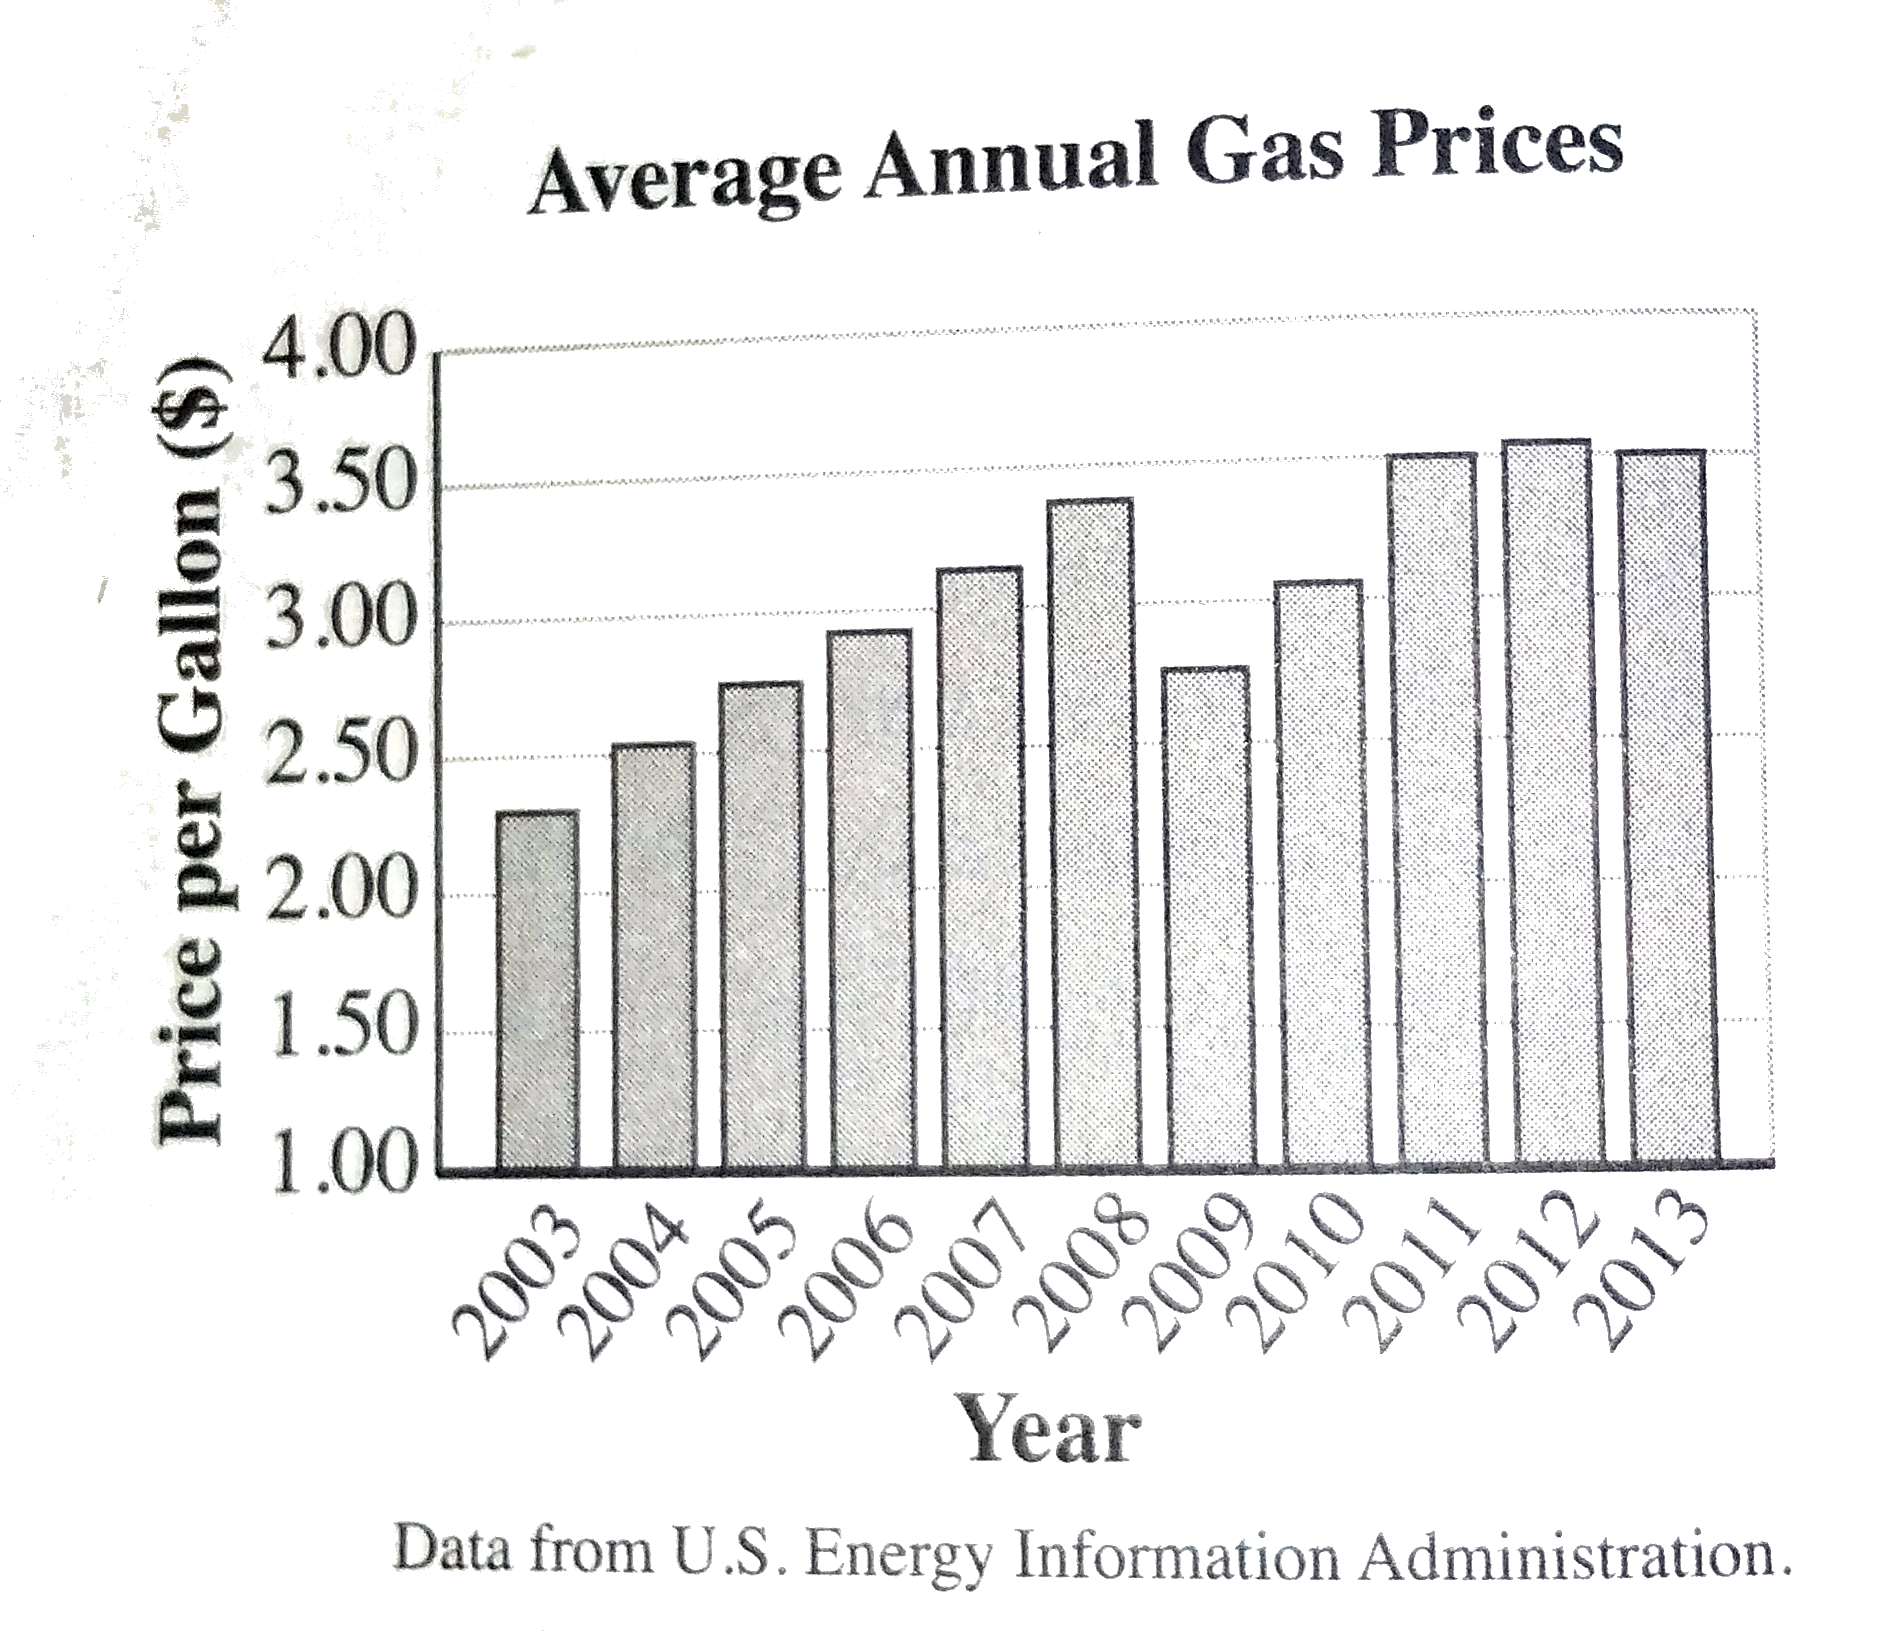
The figure above shows the average annual gas prices in the United States from 2003 to 2013. Based on the information shown, which of the following conclusions is valid?View SolutionThe human ciculatory system can be thought of as a closed system of interconnecting pipes through which fluid is continuously circulated by two pumps the two pumps the right and left verticles of the heart, work as simple two-stroke force pumps. The muscles of the heart regulate the force by contracting and relaxing. the contraction (systole) lasts about 0.2s and a complete systole/diastole (contraction/relaxation) cycle lasts about 0.8s. For flood pressures and speeds in the normal range. the volume flow rate of blood through a blood vessel is directly proportional tot he pressure difference over a length of the vessel and to the fourth power of the radius of the vessel. The total mechanical energy per unit volume of blood just as it leaves the heart is E/V=ρgh+P+ρv2
Q. Which of the following is a way to achieve approximately a 45% increase in the volume flow rate of blood through a blood vessel?View Solution
Knowledge Check
- Question 1 - Select One
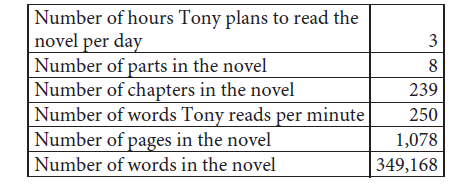
Tony is planning to read a novel. The table above shows information about the novel, Tony’s reading speed, and the amount of time he plans to spend reading the novel each day. If Tony reads at the rates given in the table, which of the following is closest to the number of days it would take Tony to read the entire novel?A6B8C23D324 - Question 2 - Select One
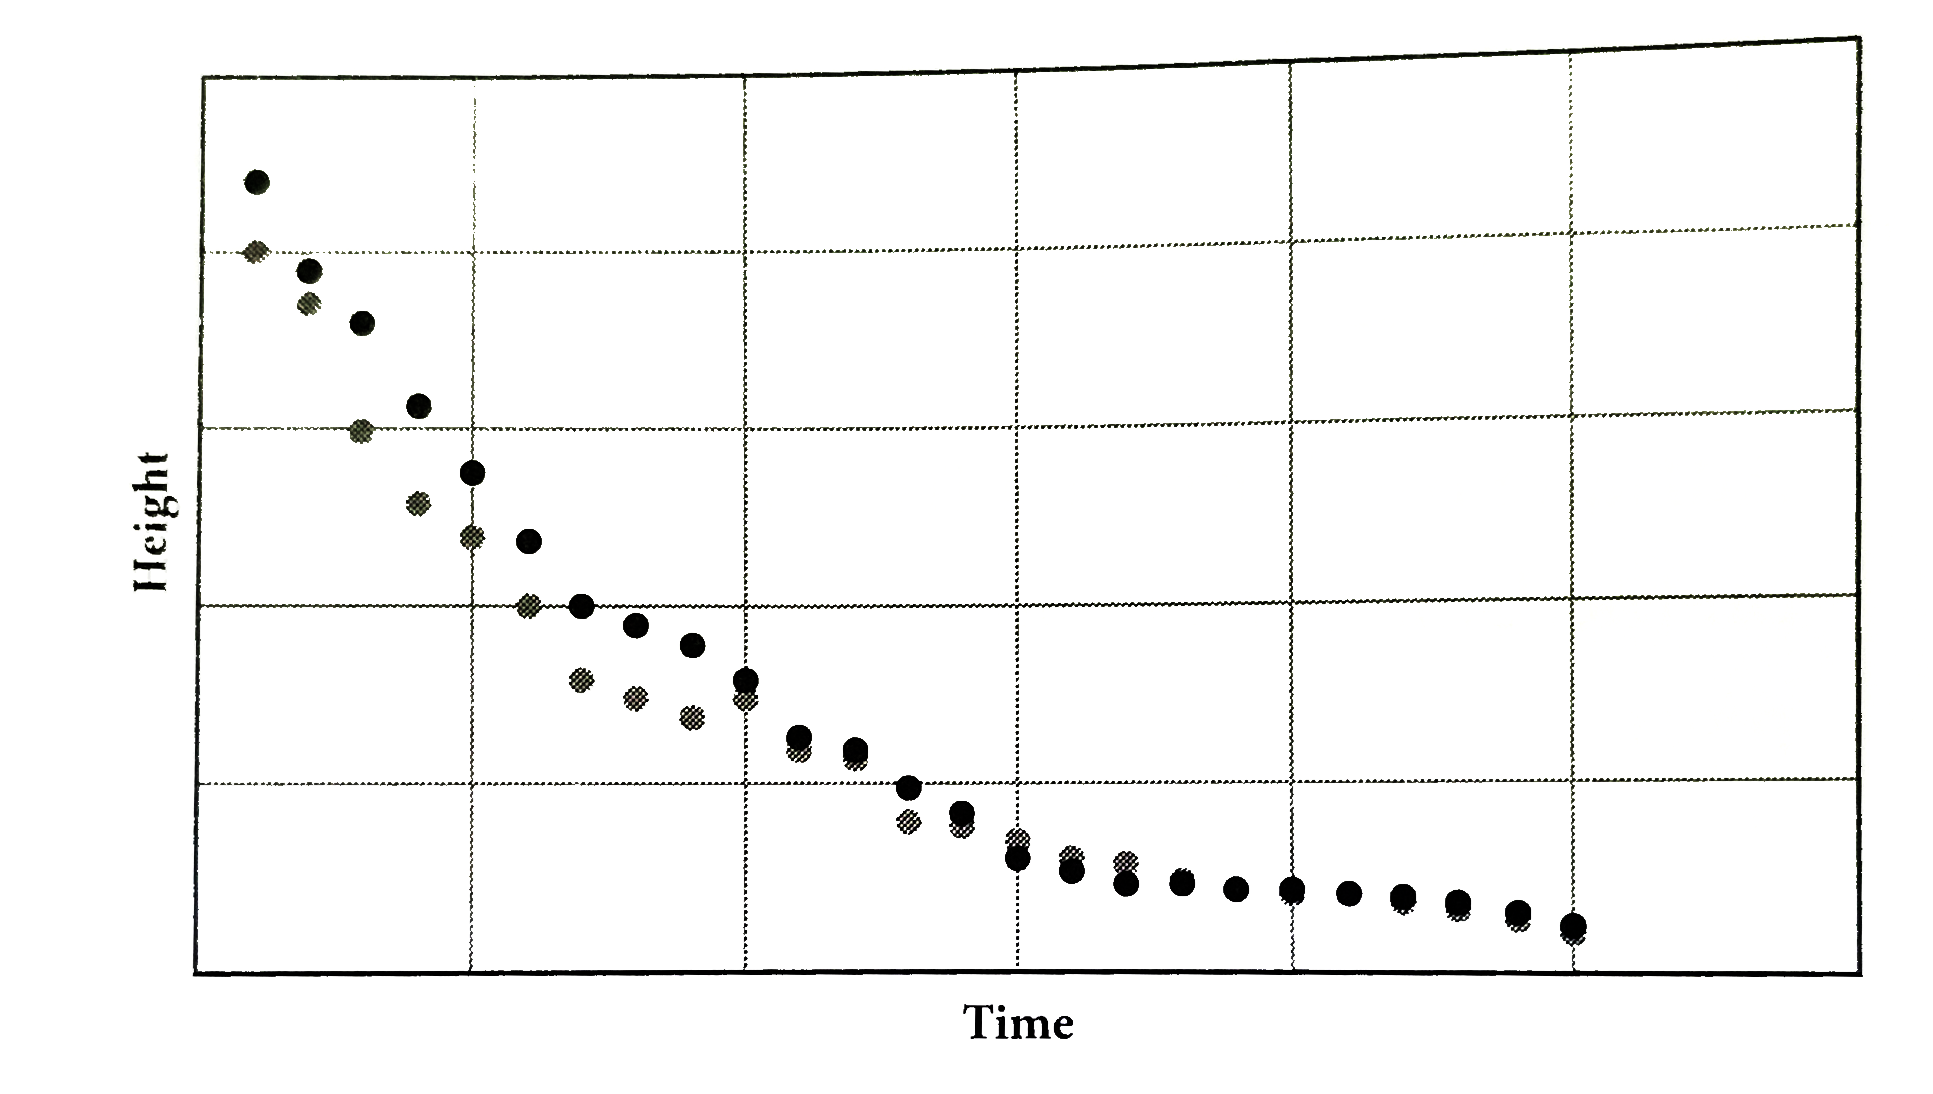
A drain at the bottom of a cylondrical water tank is opened and the height of the water is measured at regular time intervals. The tank is refilled and the process is then repeated. The scatterplot above shows the measured height on the y-axis and time on the x-axis for the trials. Which of the following conclusions can be drawn from the observations in the scatterplot?AWater flows out of the drain at a constant rate.BThe flow rate from the tank decreases as the height of the water in the tank decreases.CThe drain is inefficinetly designed.DThe is no relationship between the height of the water in the tank and time. - Question 3 - Select One
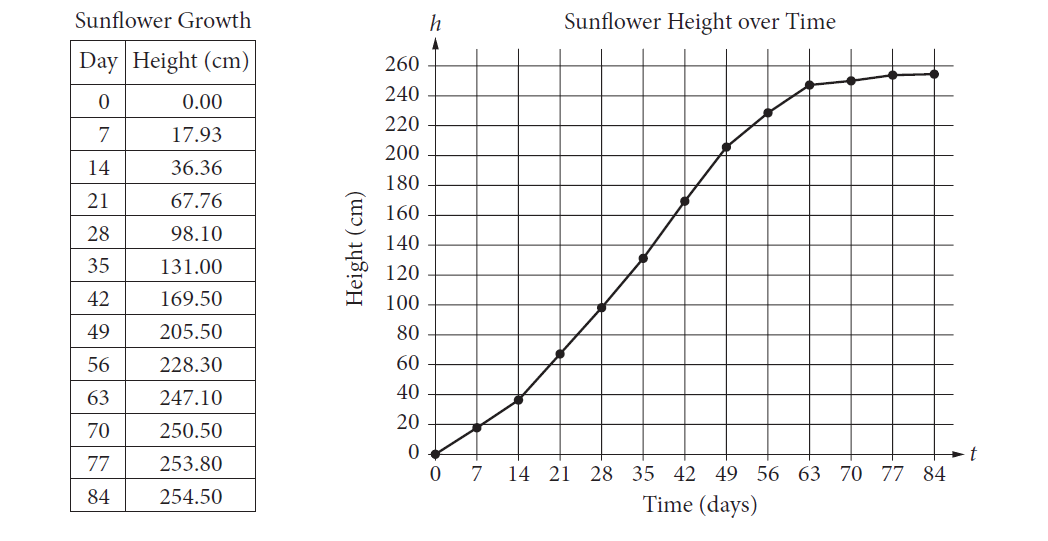
In 1919, H. S. Reed and R. H. Holland published a paper on the growth of sunflowers. Included in the paper were the table and graph above, which show the height h, in centimeters, of a sunflower t days after the sunflower begins to grow.
The growth rate of the sunflower from day 14 to day 35 is nearly constant. On this interval, which of the following equations best models the height h, in centimeters, of the sunflower t days after it begins to grow?Ah = 2.1t − 15Bh = 4.5t − 27Ch = 6.8t − 12Dh = 13.2t − 18
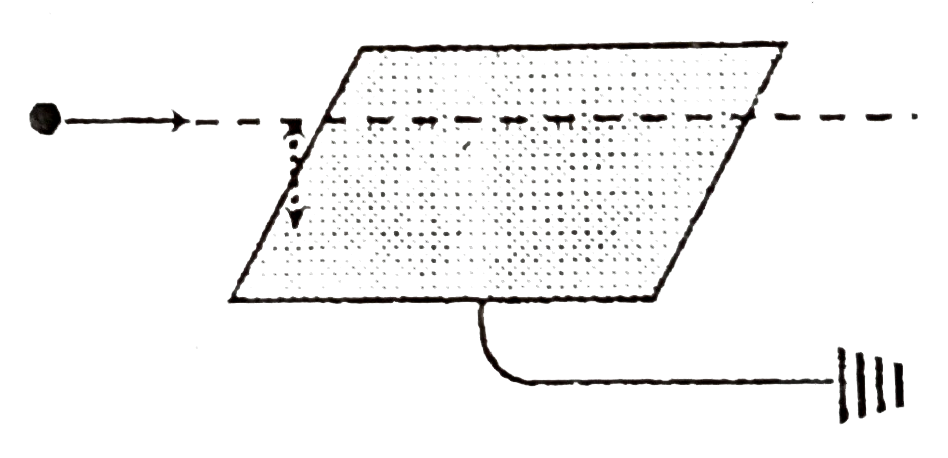
A broad metal plane is connected to earth through a conducting wire as shown. An electron flies with constant velocity along a straight line above the plate at a distance much less than the linear dimensions of the plate. If the current I flowing from the earth to the plate is considered to be positive, then which of the following graph correctly depicts the variation of current I with time ?
 View Solution
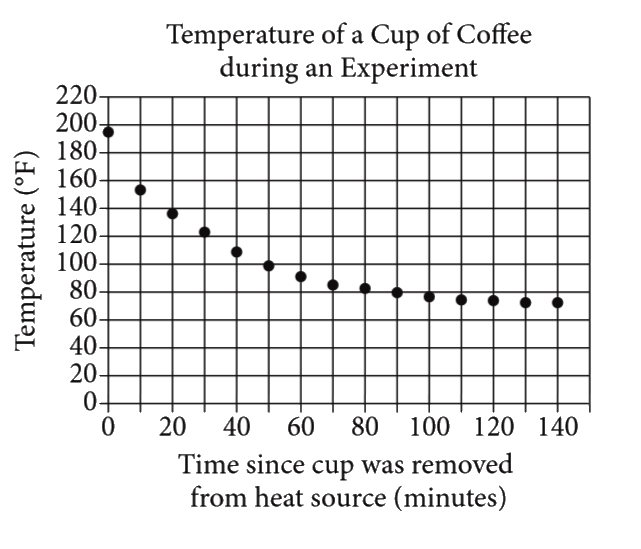
In an experiment, a heated cup of coffee is removed from a heat source, and the cup of coffee is then left in a room that is kept at a constant temperature. The graph above shows the temperature, in degrees Fahrenheit (.∘F), of the coffee immediately after being removed from the heat source and at 10-minute intervals thereafter.
During which of the following 10-minute intervals does the temperature of the coffee decrease at the greatest average rate?View SolutionThe maximum value of a data set consisting of 25 positive integers is 84. A new data set consisting of 26 positive integers is created by including 96 in the original data set. Which of the following measures must be 12 greater for the new data set than for the original data set?
View Solution1000(1+r1,200)12
The expression above gives the amount of money, in dollars, generated in a year by a $1,000 deposit in a bank account that pays an annual interest rate of r %, compounded monthly. Which of the following expressions shows how much additional money is generated at an interest rate of 5% than at an interest rate of 3% ?View Solution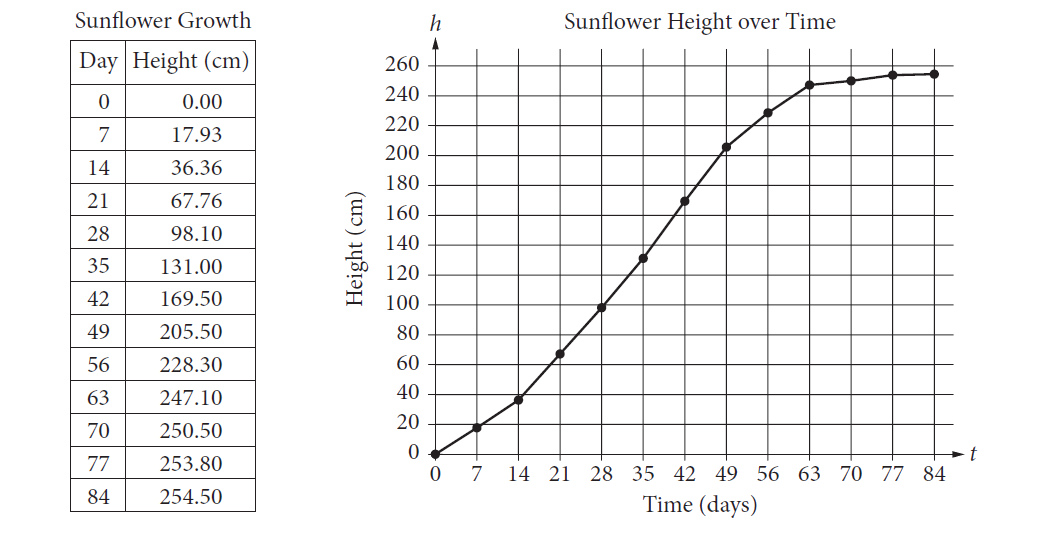
In 1919, H. S. Reed and R. H. Holland published a paper on the growth of sunflowers. Included in the paper were the table and graph above, which show the height h, in centimeters, of a sunflower t days after the sunflower begins to grow.
Over which of the following time periods is the average growth rate of the sunflower least?View Solution

