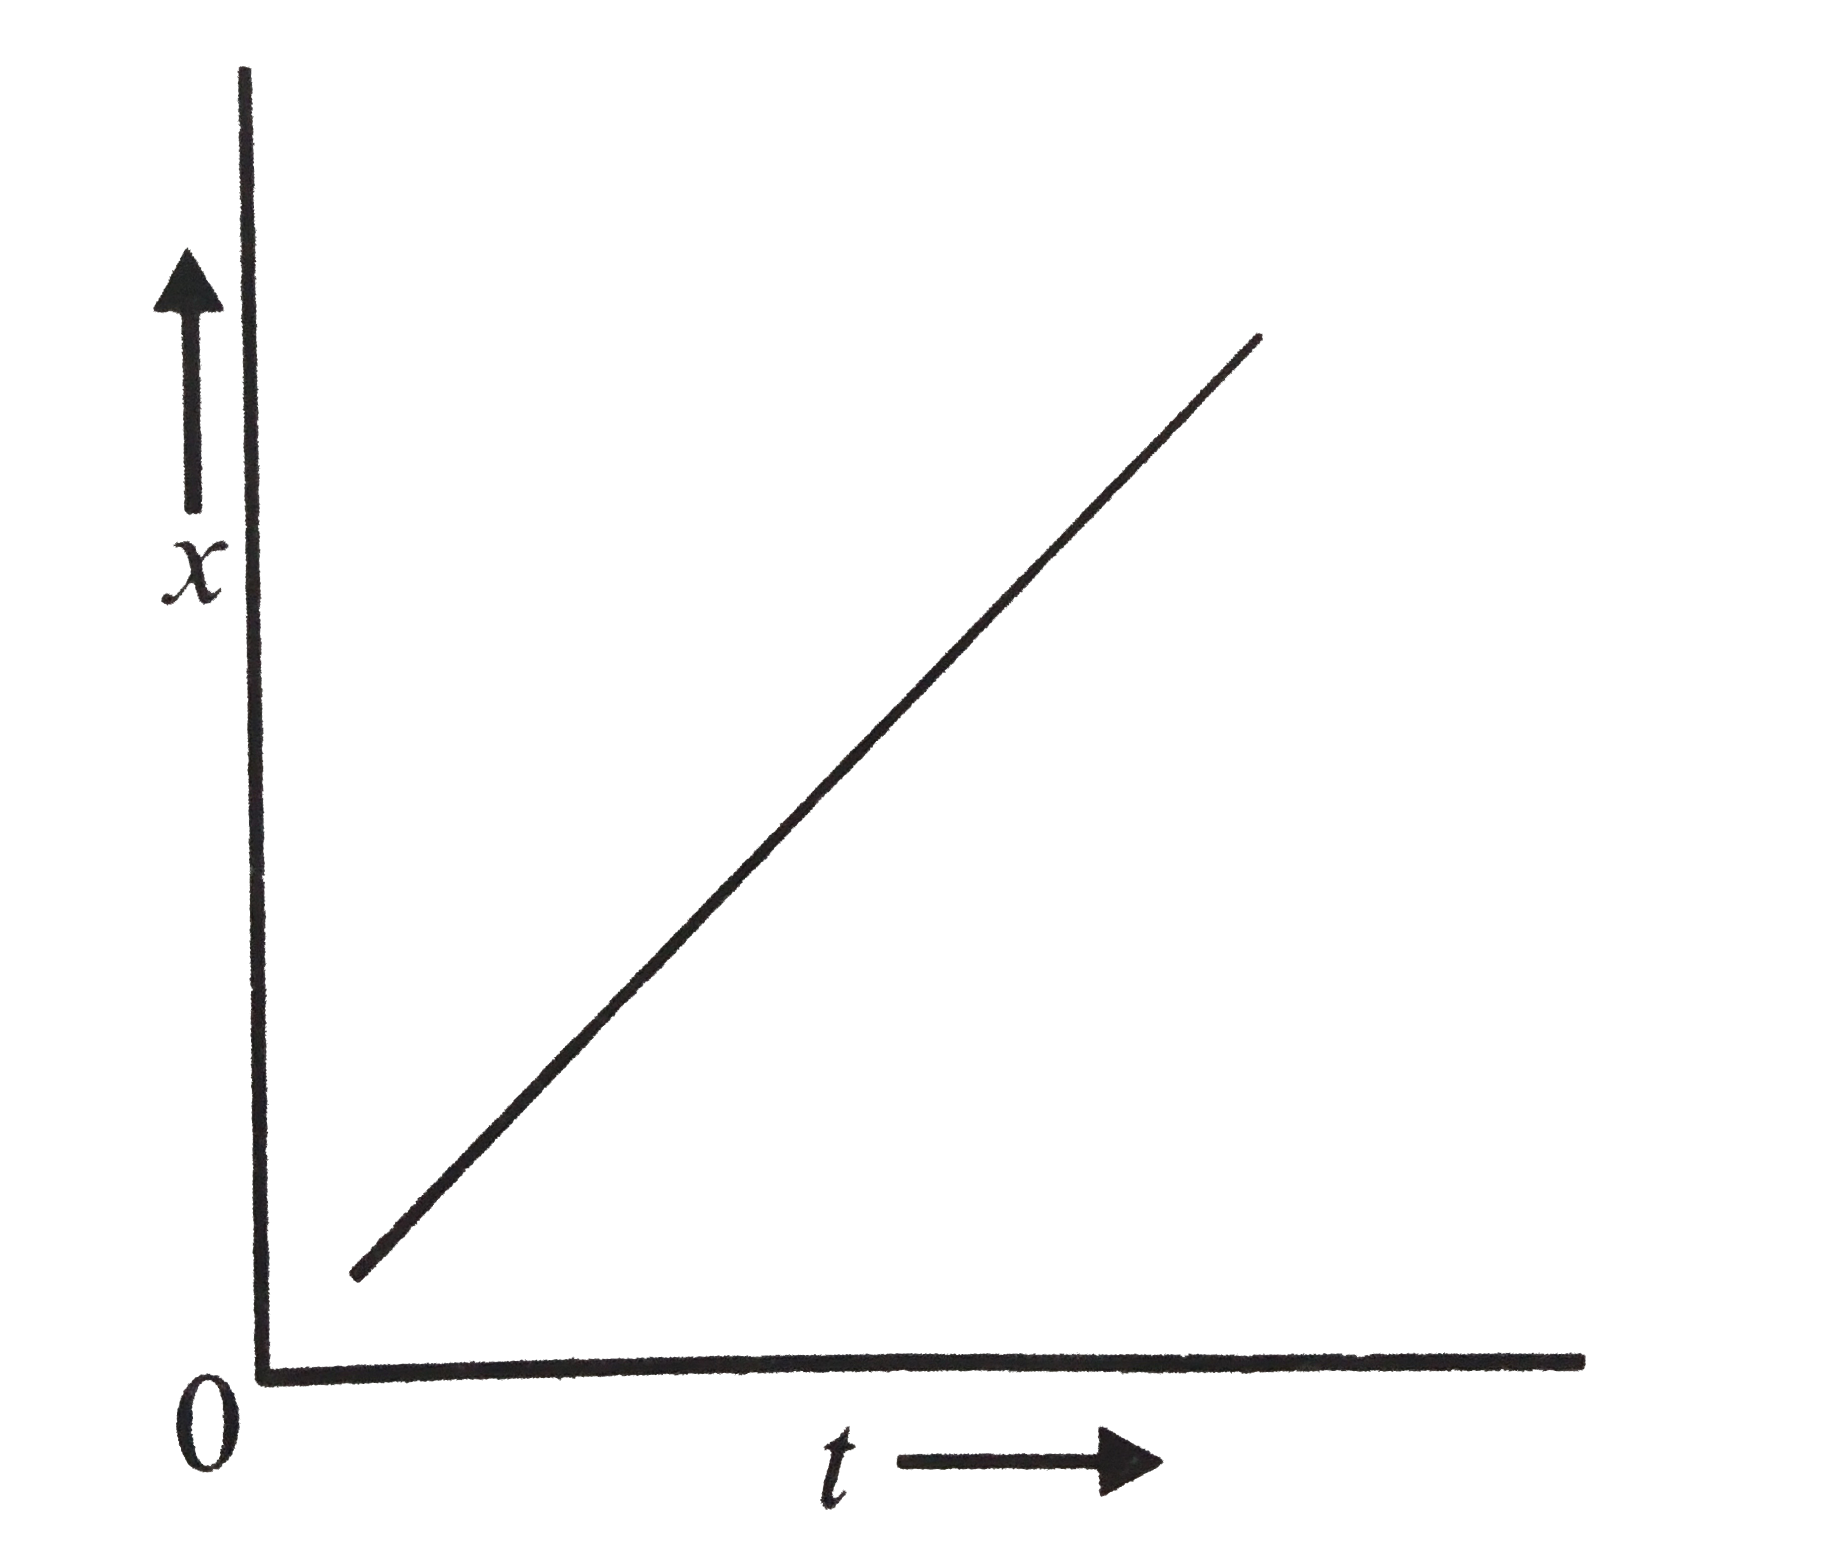
A position-time graph for linear motion of an object in one dimension shows the object's displacement d from some origin at any given time t. If the graph is linear, its slope m is given by
m=riserun=charge in dcharge in t=d1−d2t1−t2=¯v,
where ¯v is the average velocity of the object . (t1,d1) and (t2,d2) are any two points on the line. The graph above is a position time graph for a person who takes a walk from her house .
Which of the following scenarios is consistent with the graph ?
After 20 minutes the displacement of the person from her house is approximately 230 + 230 +410 + 900 =1770 m
The woman reverses direction every 5 minutes during her walk
After the first 5 minutes of her walk , the woman stops for 5 minutes . She then resumes walking.
The woman stops walking briefly at t=5, t=10 and t=15 minutes .
The correct Answer is:C
Similar Questions
Knowledge Check
The position - time (x−t) graph of an object in uniform motion is shown below, the velocity of object is
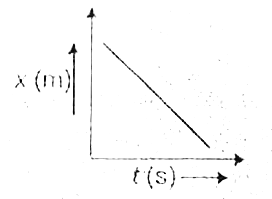 APositiveBNegativeCZeroDNone of these
Draw the position-time graph for an object in uniform motion. Show that the slope of the position-time graph gives the velocity of the object.
View SolutionThe position-time (x-t) graph of an object in uniform motion is shown below, the velocity of object is
(i) Positive
(ii) Negative
(iii) Zero
(iv) None of these
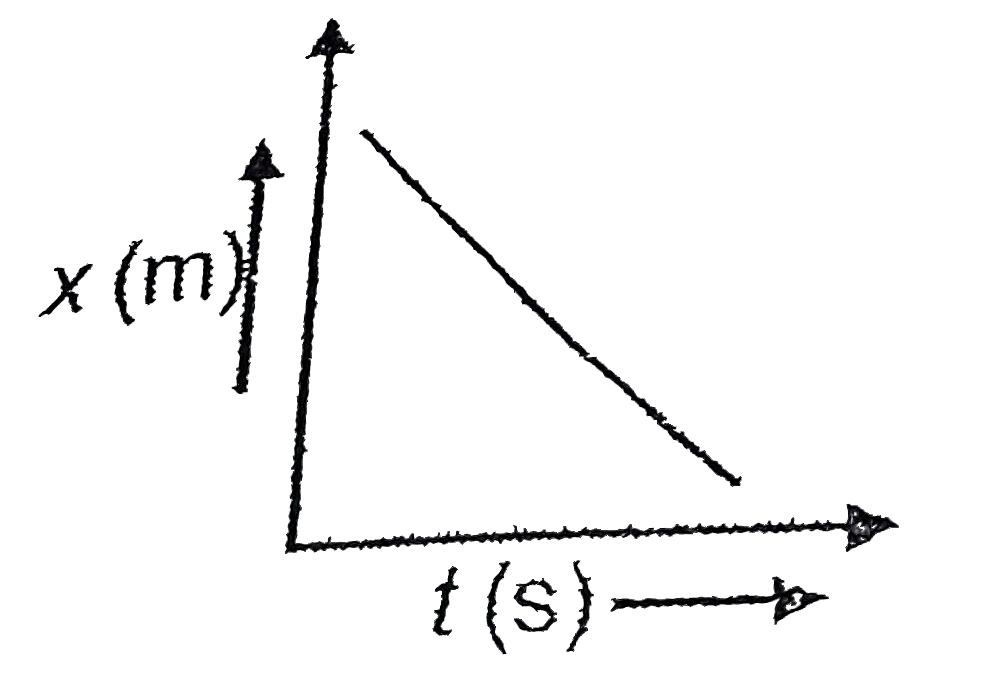
View SolutionThe position-time (x-t) graph of an object in uniform motion is shown below, the velocity of object is
(i) Positive
(ii) Negative
(iii) Zero
(iv) None of these

View SolutionThe figure shows position time graph of two riders C and D. Based on the information represented by the graph, answer the following questions.
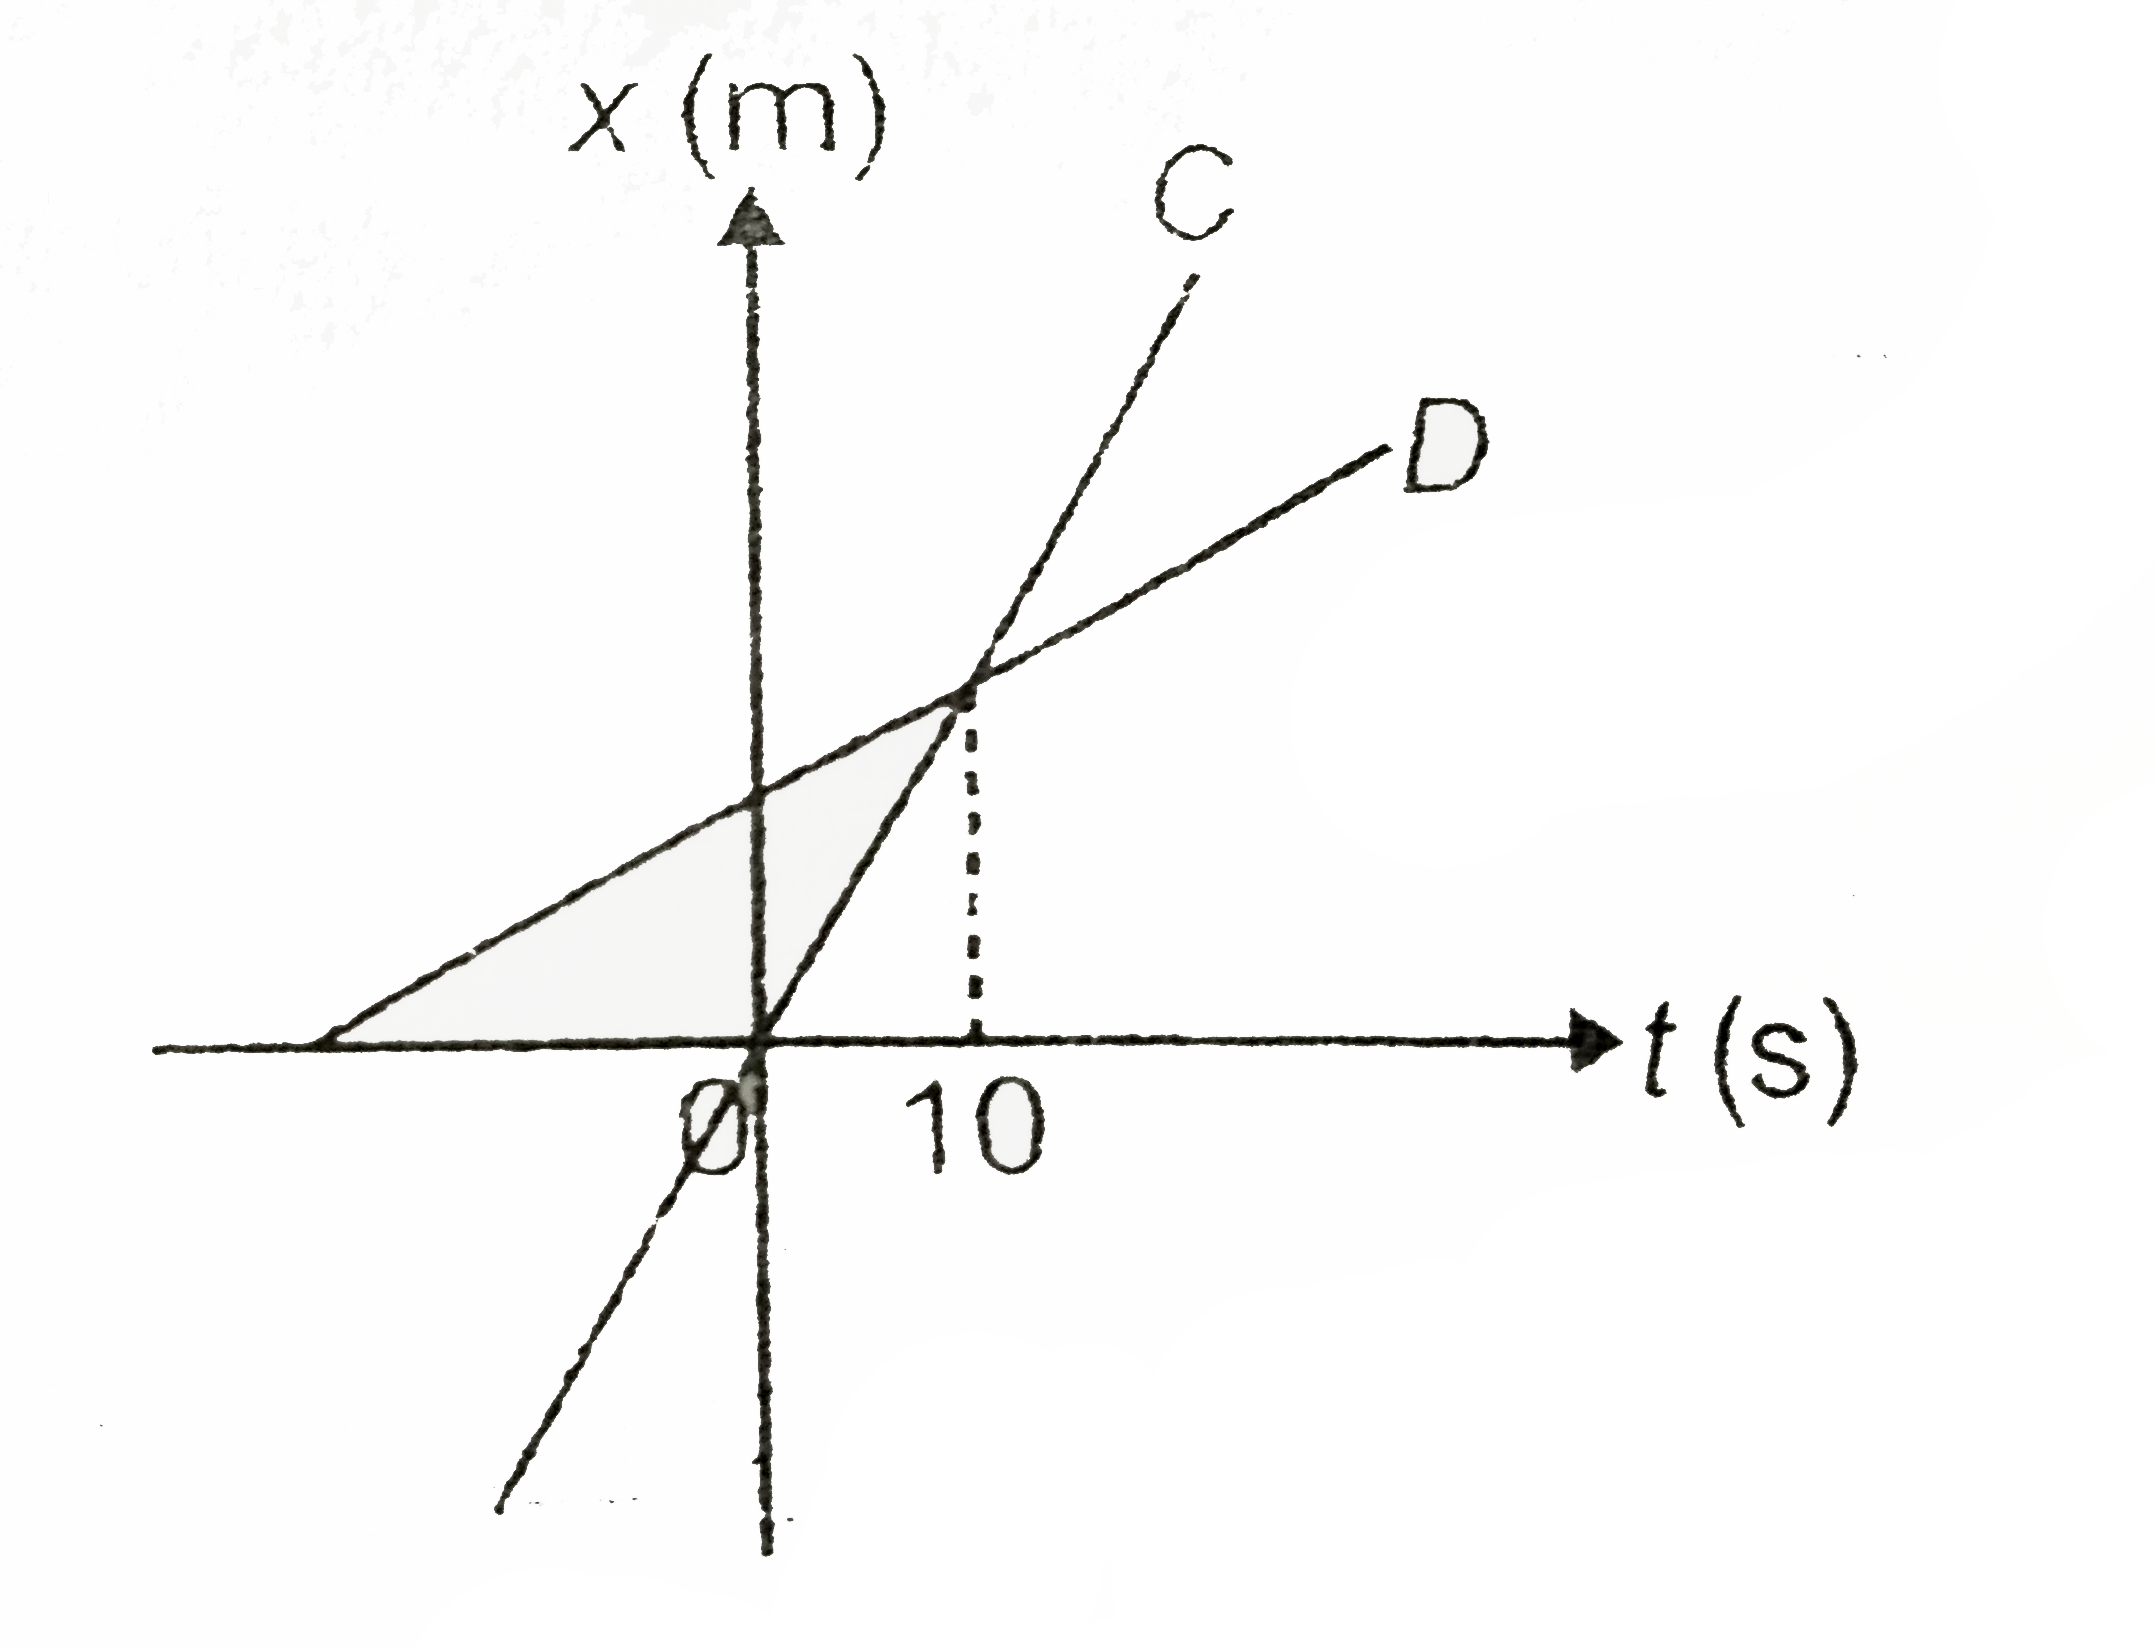
At t = 0 s
View SolutionThe figure shows position time graph of two riders C and D. Based on the information represented by the graph, answer the following questions.
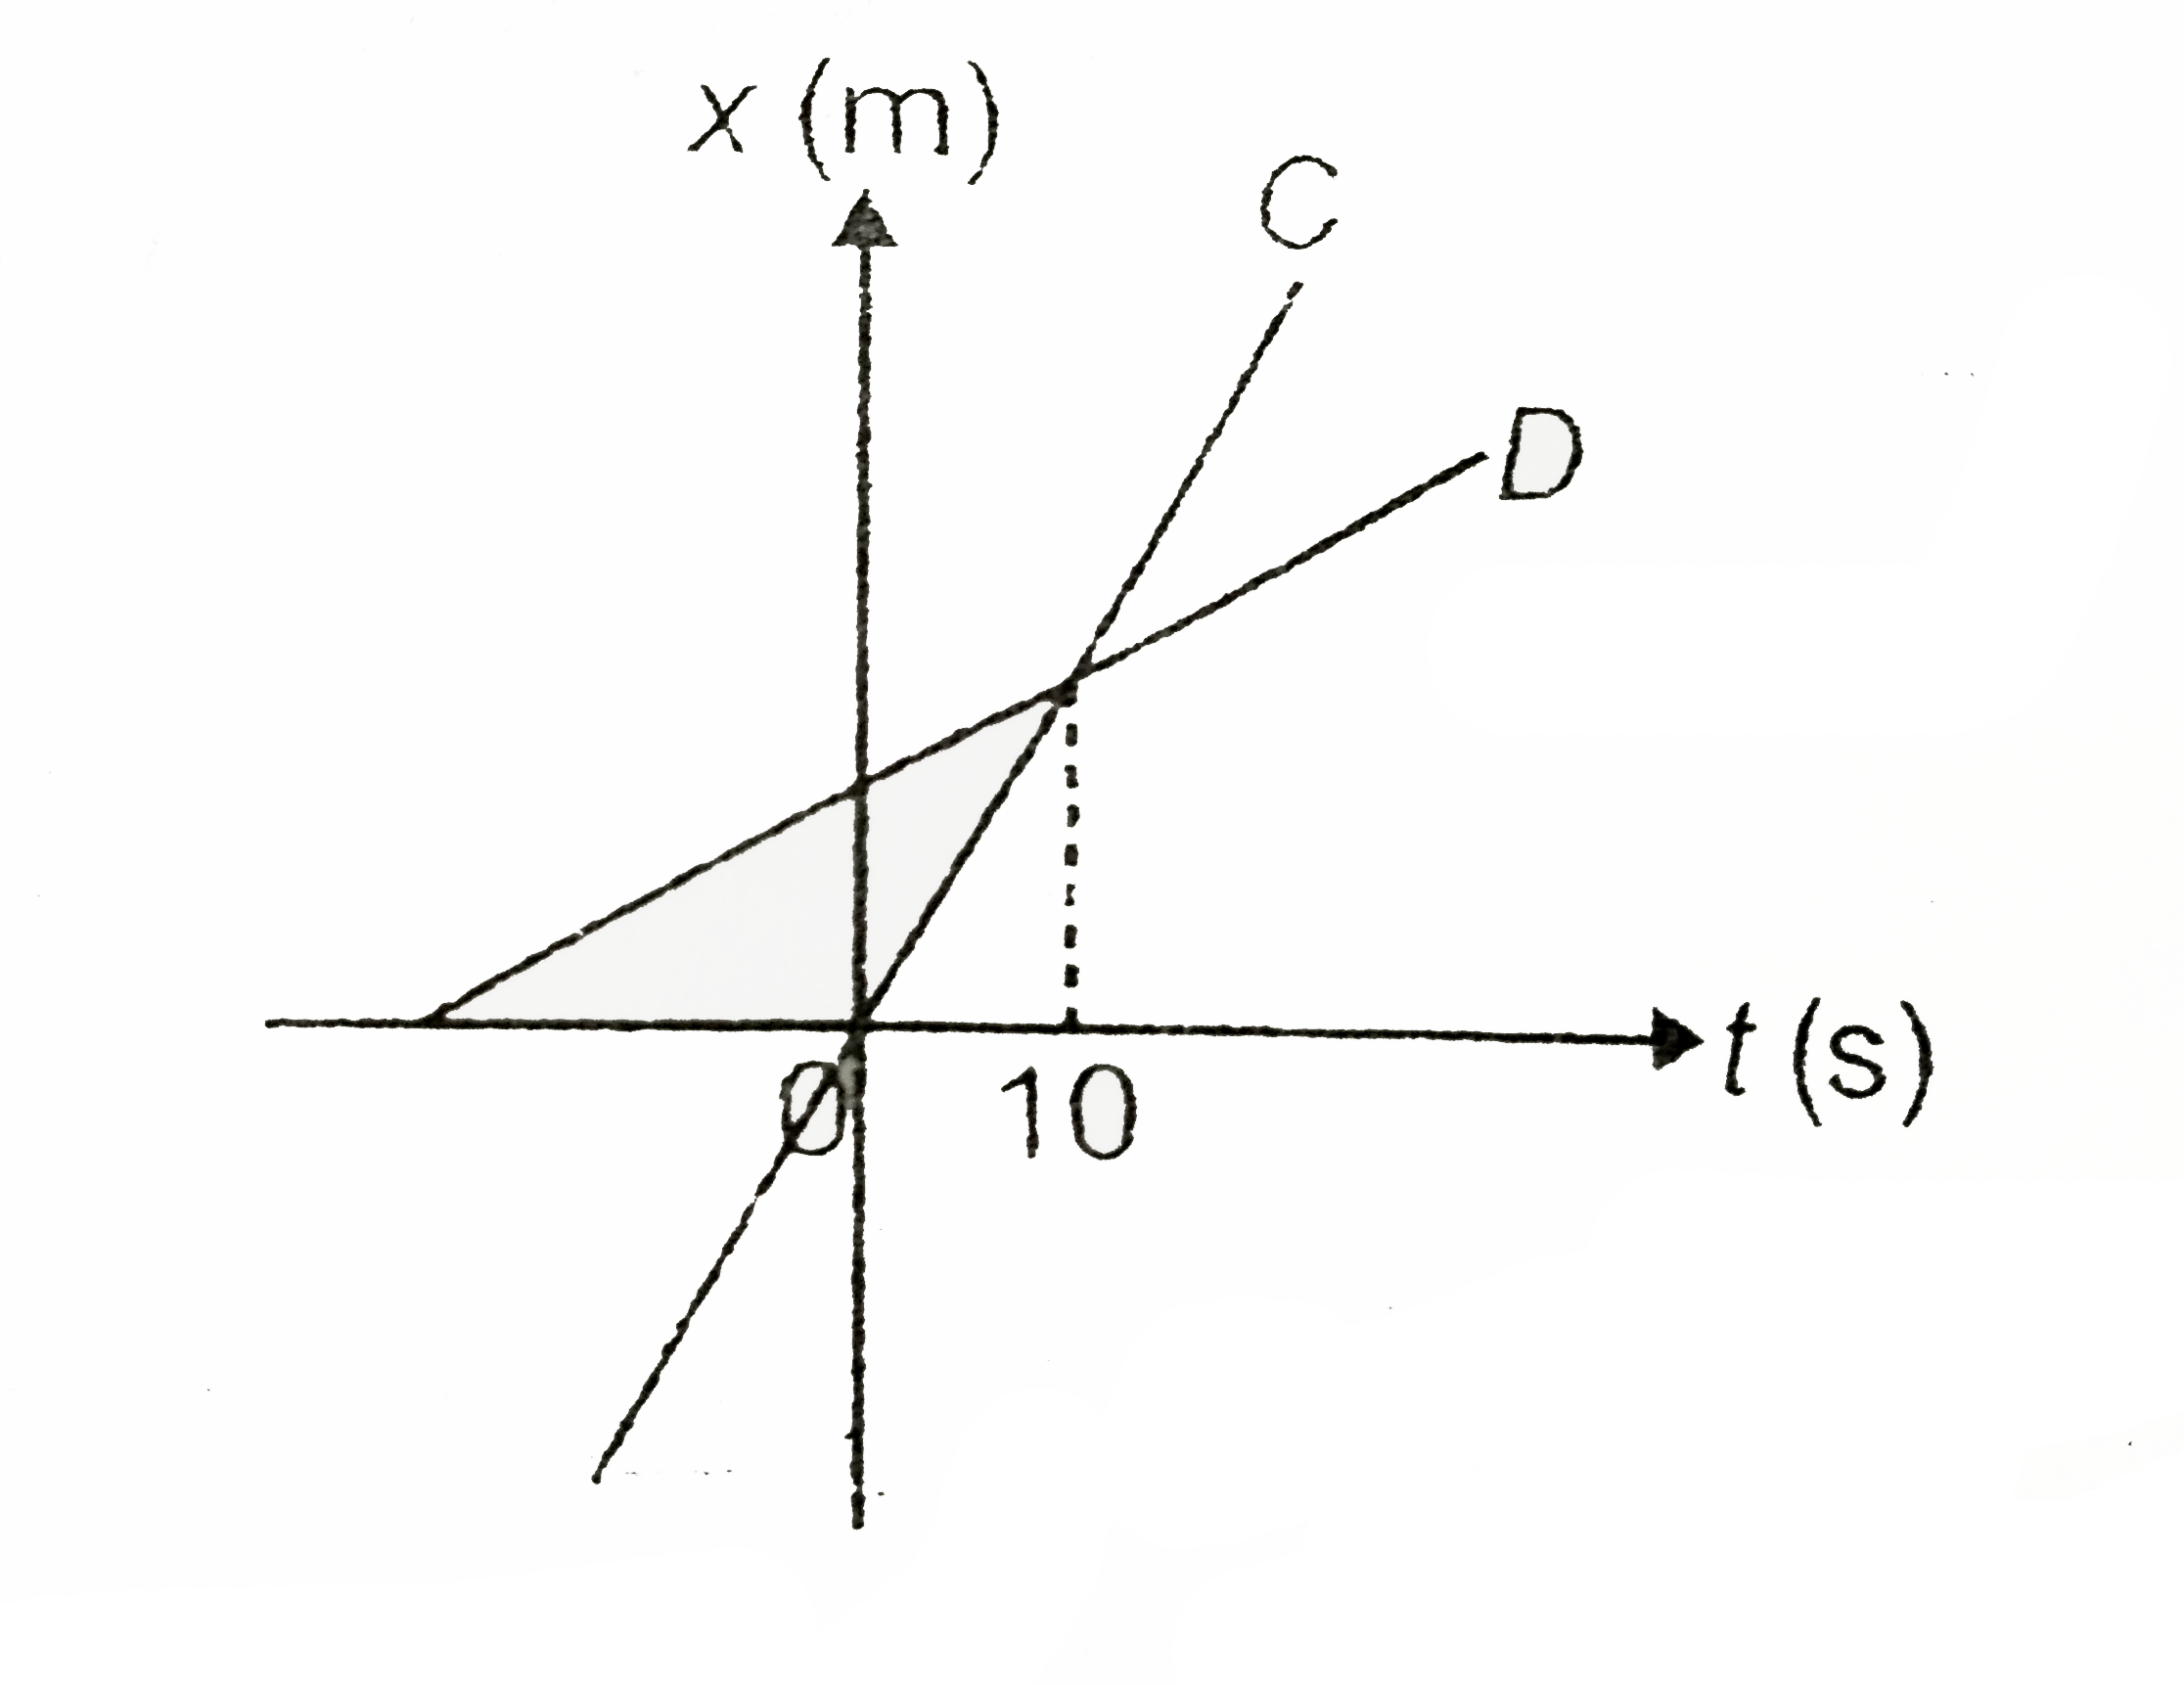
At t = 10 s
View SolutionThe figure shows position time graph of two riders C and D. Based on the information represented by the graph, answer the following questions.

At t = 0 s
View SolutionThe figure shows position time graph of two riders C and D. Based on the information represented by the graph, answer the following questions.

At t = 10 s
View Solution

