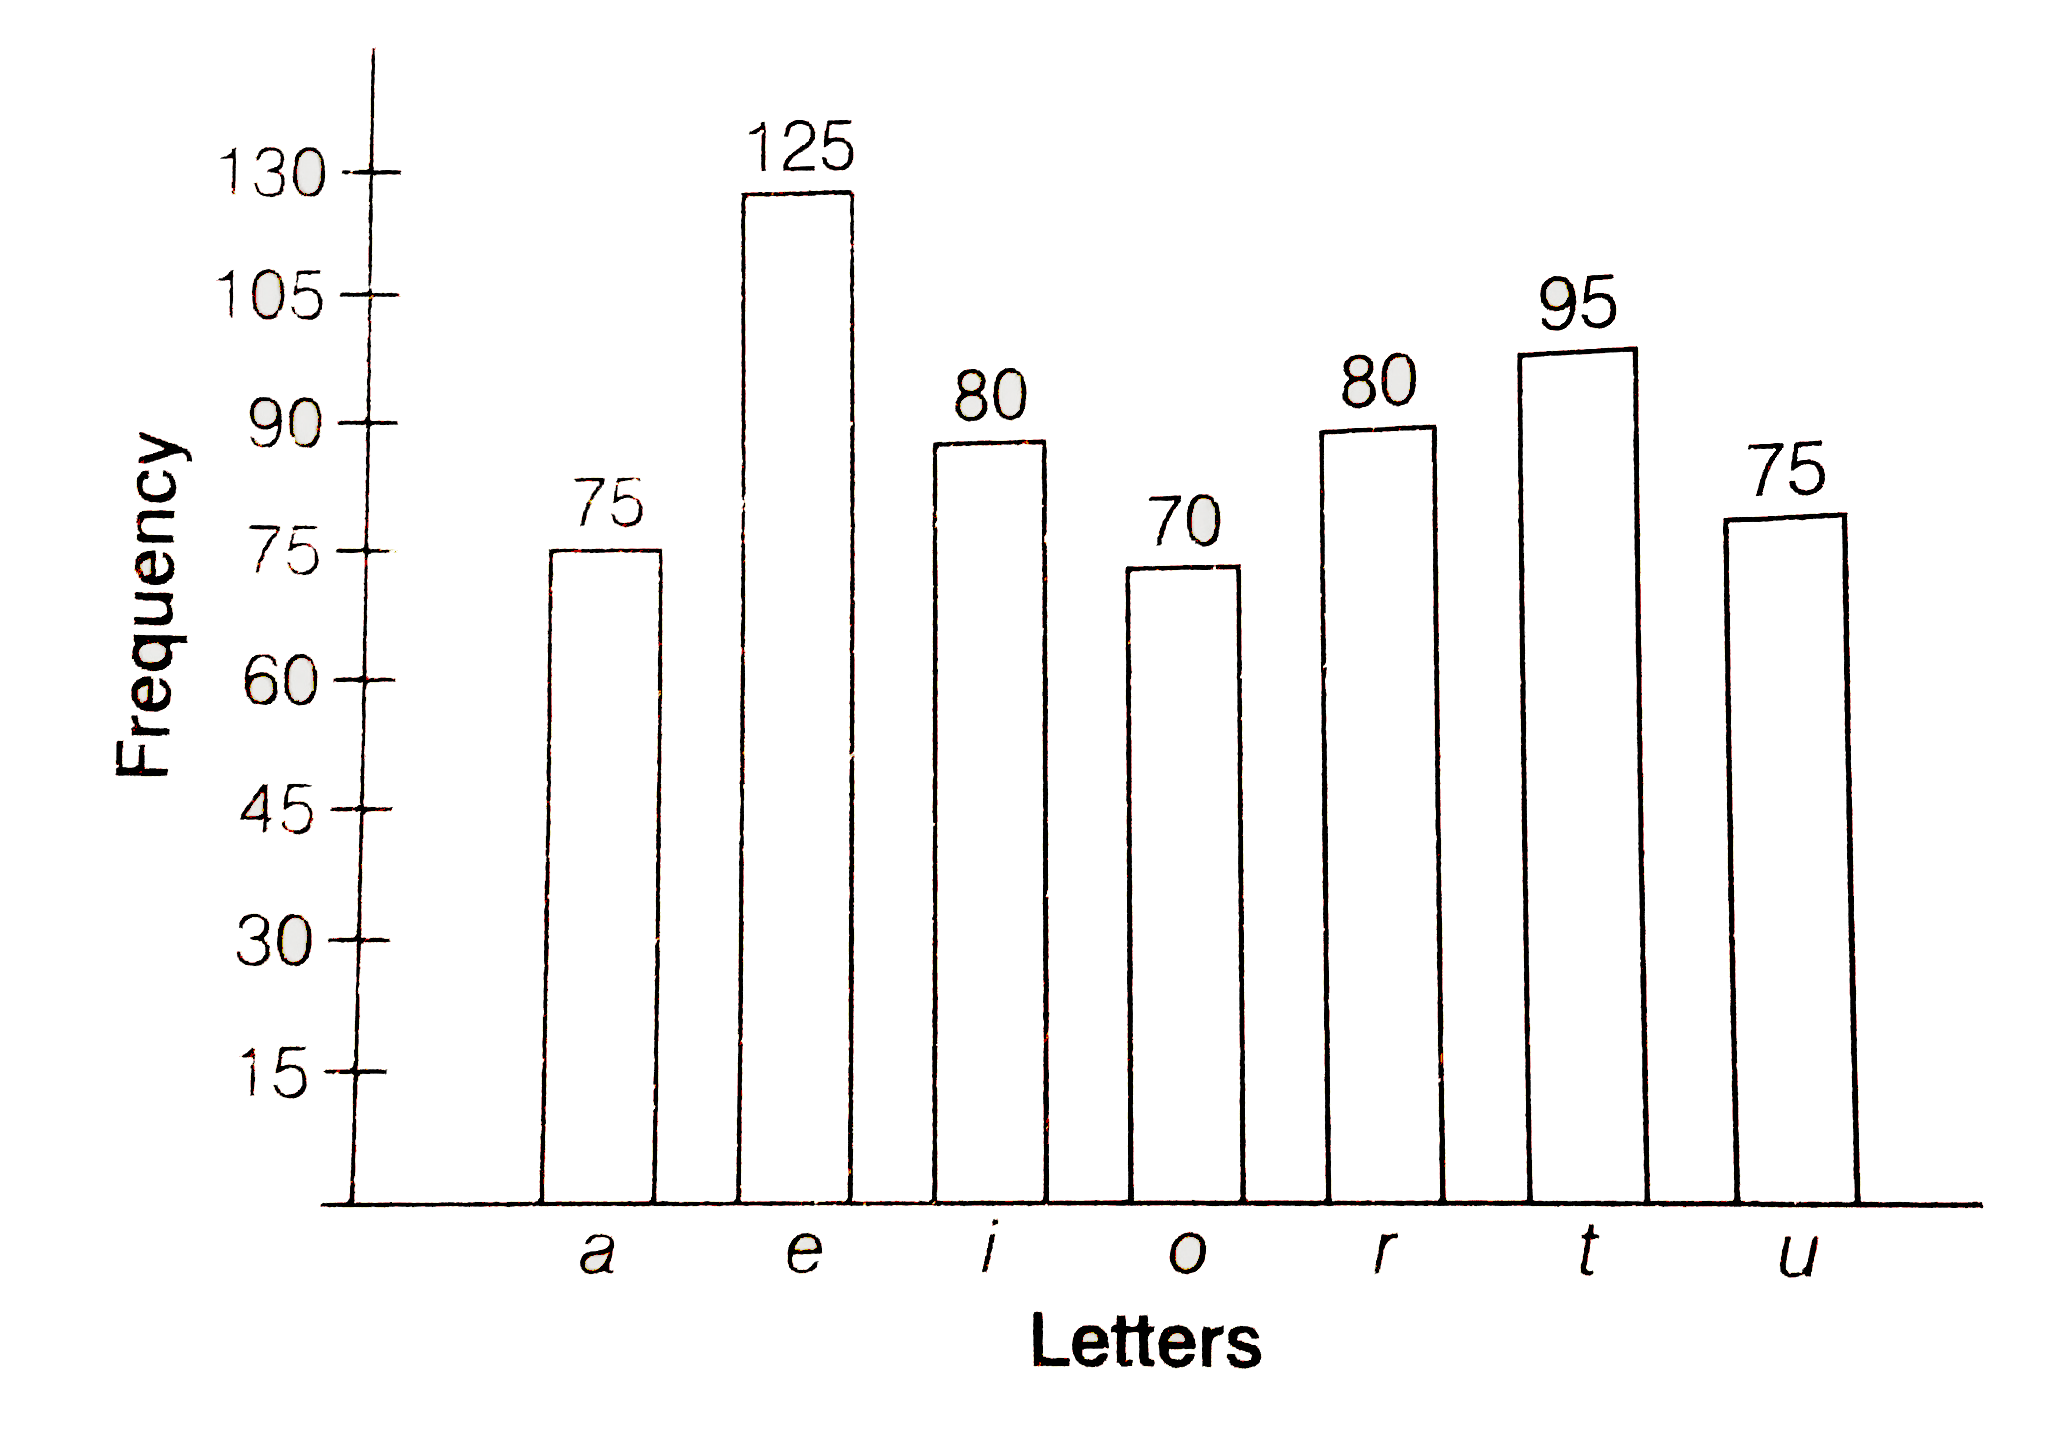
The following table gives the frequencies of most commonly used letters a,e,I,o,r,t,u, from a page of a book

Represent the information above by a bar graph.
We draw bar graph of this data in the followng steps.
Step I We represent the letters (variables) on the horizontal axis choosing any scale, as the width of the bar is not important. But for clarity, we take equal widths for all bars and maintain equal gaps in between them. Let one letter be represented by one unit.
Step II. We represent the letters on the vertical axis, Since, the maximum frequency is 125, we can choose the scale as 1 unit = 15 frequency.
Step III To represent our first letter, i.e., a, we draw a rectangular bar with width 1 unit and height 5 units.
Step IV Similarly, other heads are represented by leaving a gap of 12 unit in between two consecutive bars.
Topper's Solved these Questions
Similar Questions
The following data on the number of girls (to the nearest ten) per thousand boys in different sections of Indian society is given below
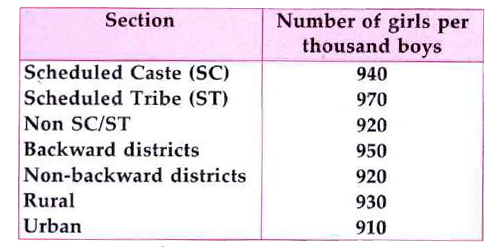
Represent the information above by a bar graph.View SolutionThe following table gives the data of number of schools (stage-wise) of a country in the year 2002.
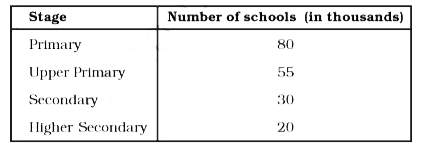
Draw a bar graph to represent the above data:View SolutionThe following table gives the distribution of students of two sections according to the marks obtained by them. Represent the marks of the students of botht the sections on the same graph by two frequency polygon. From the two polygons compare the performance of the two sections.
View SolutionThe following table represents income of a Gram Panchayat from different sources in a particular year:
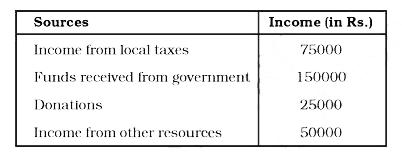
Draw a bar graph to represent the above informationView SolutionThe following table gives the GDP in rupees (crore) by the three sectors

What conclusions can we draw from the bar graph?View SolutionThe following data shows the number of students who attended the school on weekdays. Draw a bar graph to represent information by using appropriate scale.
 View Solution
The following table shows the number of fruits in a fruit shop. Represent the above data by a bar graph
View SolutionThe given table shows the number of tourists who visited Taj Mahal during different months. Month

Draw a bar graph to represent the above information by using appropriate scale.View SolutionThe table represents number of tourists visiting a zoo for 5 months.

Make a bar graph representing the above information.View SolutionObserve this bar graph which is showing the sale of shirts in a ready made shop from Monday to Saturday.
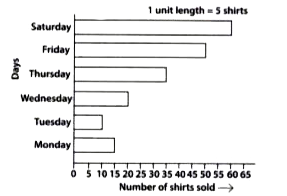
Now answer the following questions :
What information does the above bar graph give ?View Solution

