Present the following data by a devidation bar diagram showning the difference between sale proceeds and cost of a firm

Step by step video & image solution for Present the following data by a devidation bar diagram showning the difference between sale proceeds and cost of a firm by Economics experts to help you in doubts & scoring excellent marks in Class 11 exams.
Updated on:21/07/2023Topper's Solved these Questions
- DIAGRAMMATIC PRESENTATION OF DATA BAR DIAGRAMS AND PIE DIAGRAMSBOOK - TARUN JAIN & VK OHRICHAPTER - DIAGRAMMATIC PRESENTATION OF DATA BAR DIAGRAMS AND PIE DIAGRAMSEXERCISE - NCERT Question (With Hints to Answers)
3 Videos
- DIAGRAMMATIC PRESENTATION OF DATA BAR DIAGRAMS AND PIE DIAGRAMSBOOK - TARUN JAIN & VK OHRICHAPTER - DIAGRAMMATIC PRESENTATION OF DATA BAR DIAGRAMS AND PIE DIAGRAMSEXERCISE - Essential praticals
1 Videos
- CORRELATIONBOOK - TARUN JAIN & VK OHRICHAPTER - CORRELATIONEXERCISE - NCERT Questions (with Hints to Answers)
10 Videos
- FREQUENCY DIAGRAMS - HISTOGRAM, POLYGON AND OGIVEBOOK - TARUN JAIN & VK OHRICHAPTER - FREQUENCY DIAGRAMS - HISTOGRAM, POLYGON AND OGIVEEXERCISE - EXERCISE NCERT
7 Videos
Similar Questions
Knowledge Check
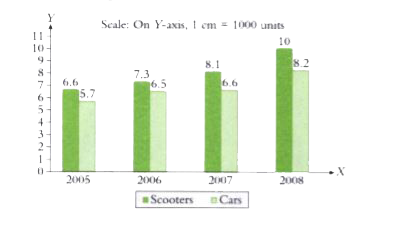
Directions for questions : These questions are based on the following data. Read the following bar graph and answer the following.

Find the maximum difference between sales of scooters and that of cars, in any year, in the given period.A1500B1700C1800D2000There is no difference between a firm and an industry in :
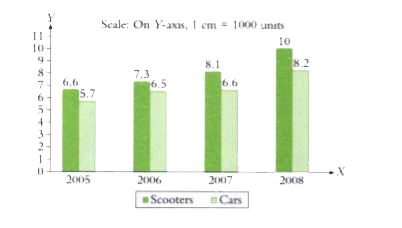
Aperfect competitionBmonopolyCmonopolistic competitionDoligopoly.Directions for questions : These questions are based on the following data. Read the following bar graph and answer the following.

In which year is the difference between the sales of the scooters and the sales of cars the least?A2005B2006C2007D2008
Represent the following data, using a percentage bar diagram :

View SolutionPresent the following data in the form of horizontal bar diagram :

View SolutionPresent the following data in the form of a multiple bar diagrm:

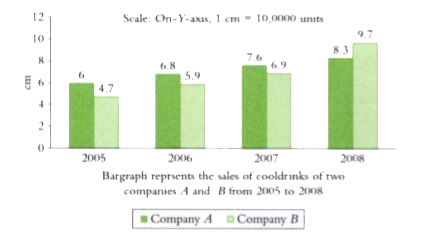
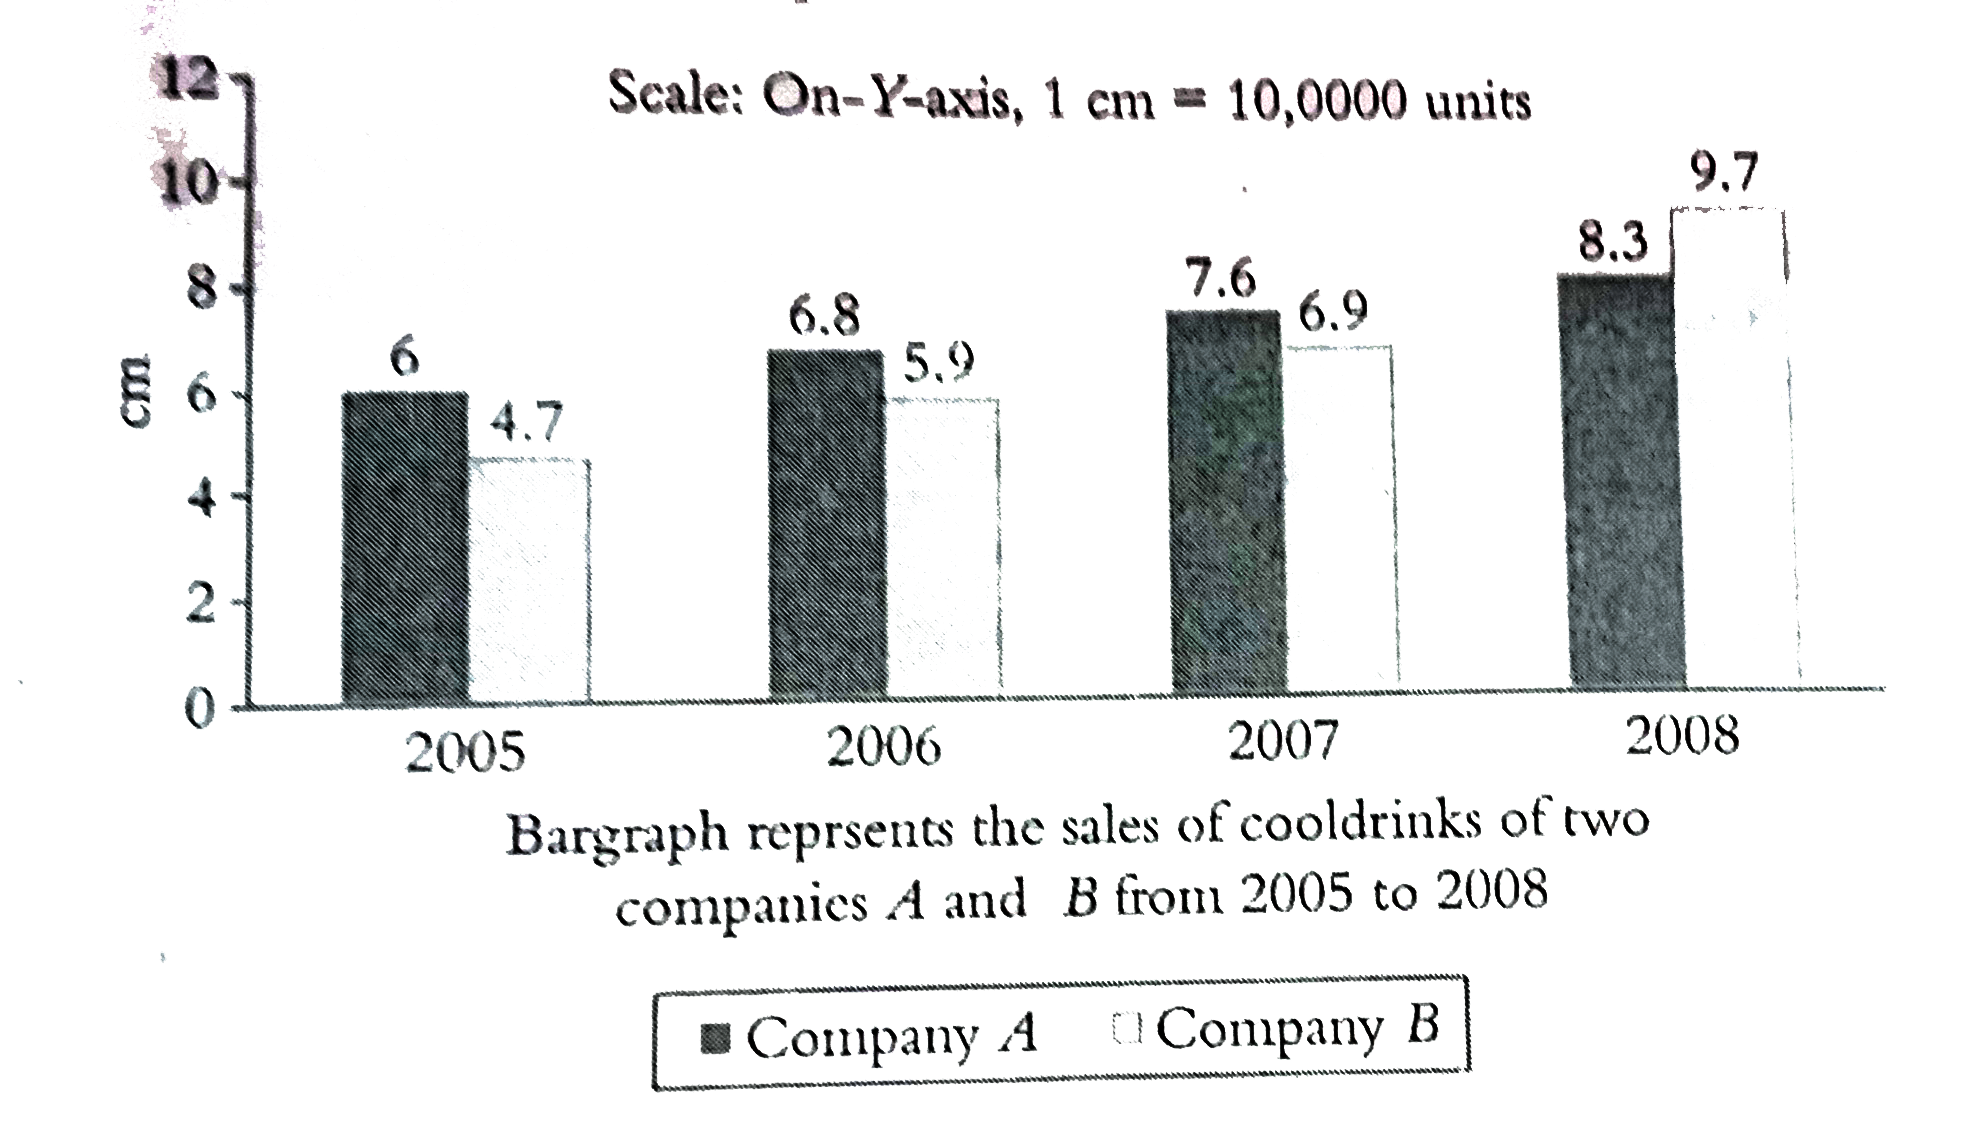
View SolutionDirections for questions : These questions are based on the following data. Read the following bar graph and answer the questions.

Find the maximum difference between the sales of A and sales of B in any year in the given period.
View Solution
In which year is the difference between the sales of A and the sales of B the highest ?
View Solution


