Make a bar diagram of the following data on india's population:

Video Solution
|
Answer
Step by step video & image solution for Make a bar diagram of the following data on india's population: by Economics experts to help you in doubts & scoring excellent marks in Class 11 exams.
Updated on:21/07/2023Topper's Solved these Questions
- DIAGRAMMATIC PRESENTATION OF DATA BAR DIAGRAMS AND PIE DIAGRAMSBOOK - TARUN JAIN & VK OHRICHAPTER - DIAGRAMMATIC PRESENTATION OF DATA BAR DIAGRAMS AND PIE DIAGRAMSEXERCISE - NCERT Question (With Hints to Answers)
3 Videos
- DIAGRAMMATIC PRESENTATION OF DATA BAR DIAGRAMS AND PIE DIAGRAMSBOOK - TARUN JAIN & VK OHRICHAPTER - DIAGRAMMATIC PRESENTATION OF DATA BAR DIAGRAMS AND PIE DIAGRAMSEXERCISE - Essential praticals
1 Videos
- CORRELATIONBOOK - TARUN JAIN & VK OHRICHAPTER - CORRELATIONEXERCISE - NCERT Questions (with Hints to Answers)
10 Videos
- FREQUENCY DIAGRAMS - HISTOGRAM, POLYGON AND OGIVEBOOK - TARUN JAIN & VK OHRICHAPTER - FREQUENCY DIAGRAMS - HISTOGRAM, POLYGON AND OGIVEEXERCISE - EXERCISE NCERT
7 Videos
Similar Questions
Knowledge Check
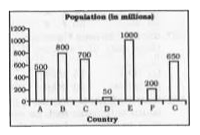
The bar graph shows the population of different countries. Study the diagram and answer the following questions.

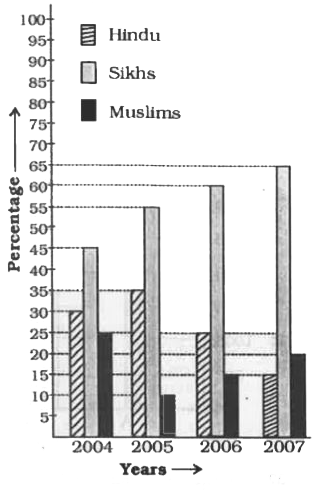
Population of country E is greater than that of country A by _____.A200%B100%C50%D150%The following bar diagram shows the percentage of Hindus, Sikhs and Muslims in a state during the years from 2004 o 2007. Examine the bar diagram and answer the following questions.

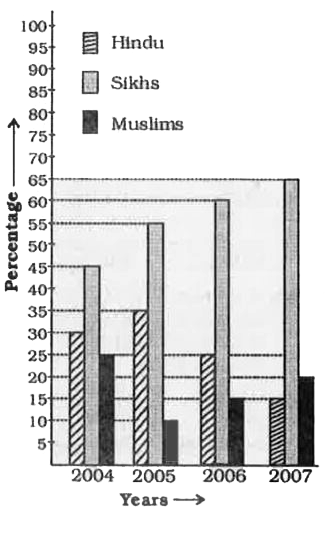
The ratio between the Hindus and Sikhs population in 2004 wasA3:5B1:2C2:3D3:4The following bar diagram shows the percentage of Hindus, Sikhs and Muslims in a state during the years from 2004 to 2007 . Examine the bar diagram and answer the following questions .

The ratio between the Hindus and Sikh populations in 2004 wasA3:5B1:2C2:3D3:4
Make a frequency curve of the following data :

View SolutionWhat is population density?
View SolutionGive a diagrammatic presentation of the following data on india's Exports and Imports:

View SolutionDraw a multiple bar diagram to show the following data :

View SolutionWhat is the annual growth rate of India's population?
View Solution


