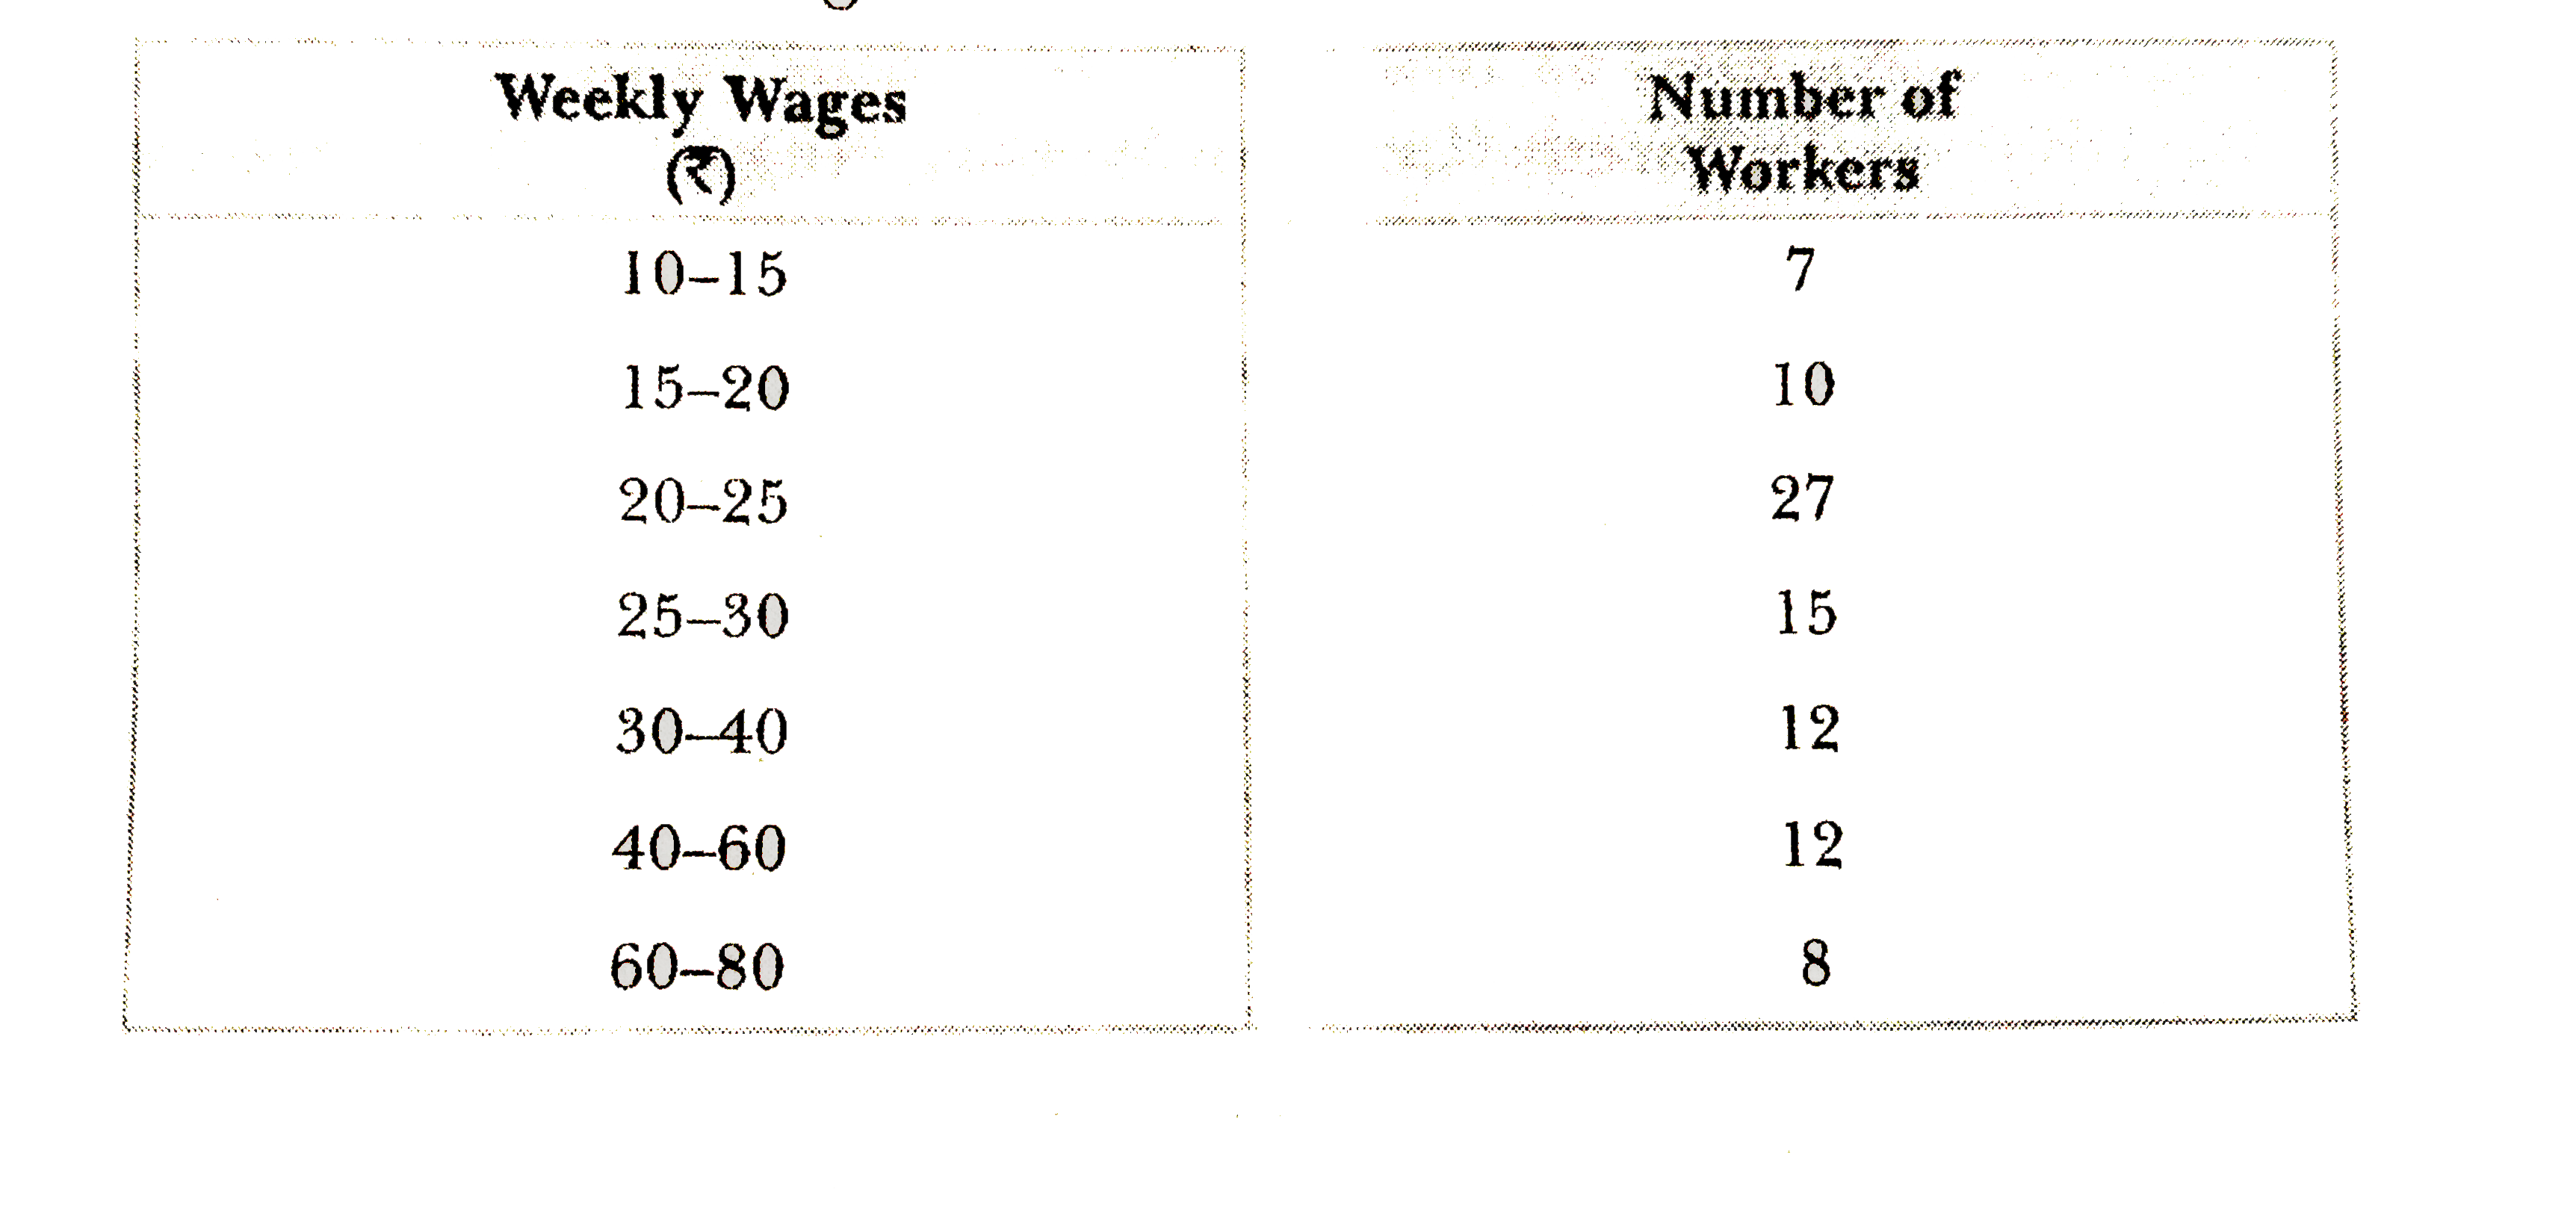
Present the following data on the production of food grains in the form of a sub divided bar diagrm:

Step by step video & image solution for Present the following data on the production of food grains in the form of a sub divided bar diagrm: by Economics experts to help you in doubts & scoring excellent marks in Class 11 exams.
Updated on:21/07/2023Topper's Solved these Questions
- DIAGRAMMATIC PRESENTATION OF DATA BAR DIAGRAMS AND PIE DIAGRAMSBOOK - TARUN JAIN & VK OHRICHAPTER - DIAGRAMMATIC PRESENTATION OF DATA BAR DIAGRAMS AND PIE DIAGRAMSEXERCISE - NCERT Question (With Hints to Answers)
3 Videos
- DIAGRAMMATIC PRESENTATION OF DATA BAR DIAGRAMS AND PIE DIAGRAMSBOOK - TARUN JAIN & VK OHRICHAPTER - DIAGRAMMATIC PRESENTATION OF DATA BAR DIAGRAMS AND PIE DIAGRAMSEXERCISE - Essential praticals
1 Videos
- CORRELATIONBOOK - TARUN JAIN & VK OHRICHAPTER - CORRELATIONEXERCISE - NCERT Questions (with Hints to Answers)
10 Videos
- FREQUENCY DIAGRAMS - HISTOGRAM, POLYGON AND OGIVEBOOK - TARUN JAIN & VK OHRICHAPTER - FREQUENCY DIAGRAMS - HISTOGRAM, POLYGON AND OGIVEEXERCISE - EXERCISE NCERT
7 Videos
Similar Questions
Present the following data in the form of a histogram :

View SolutionPresent the following data in the form of a histogram :

View SolutionWhat does sub-divided bar diagram show ?
View SolutionPresent the following data in the form of horizontal bar diagram :

View SolutionThe following data gives the production of food grains (in thousand tonnes) for some years: Year 1995 1996 1997 1998 1999 2000 Production (in thousand tonnes) 120 150 140 180 170 190 Represent the above data with the help of a bar graph.
View SolutionPresent the following data in the form of a frequency polygon :

View SolutionPresent the following data in the form of a multiple bar diagrm:

View SolutionDirection :- The following table shows the production of food grains (in million tonnes) in a state for the period 1988 to 1992. Read the table and answer the following questions.

View SolutionRepresent the following data, using a percentage bar diagram :

View SolutionReprent the following data by a deviation bar diagram :

View Solution
