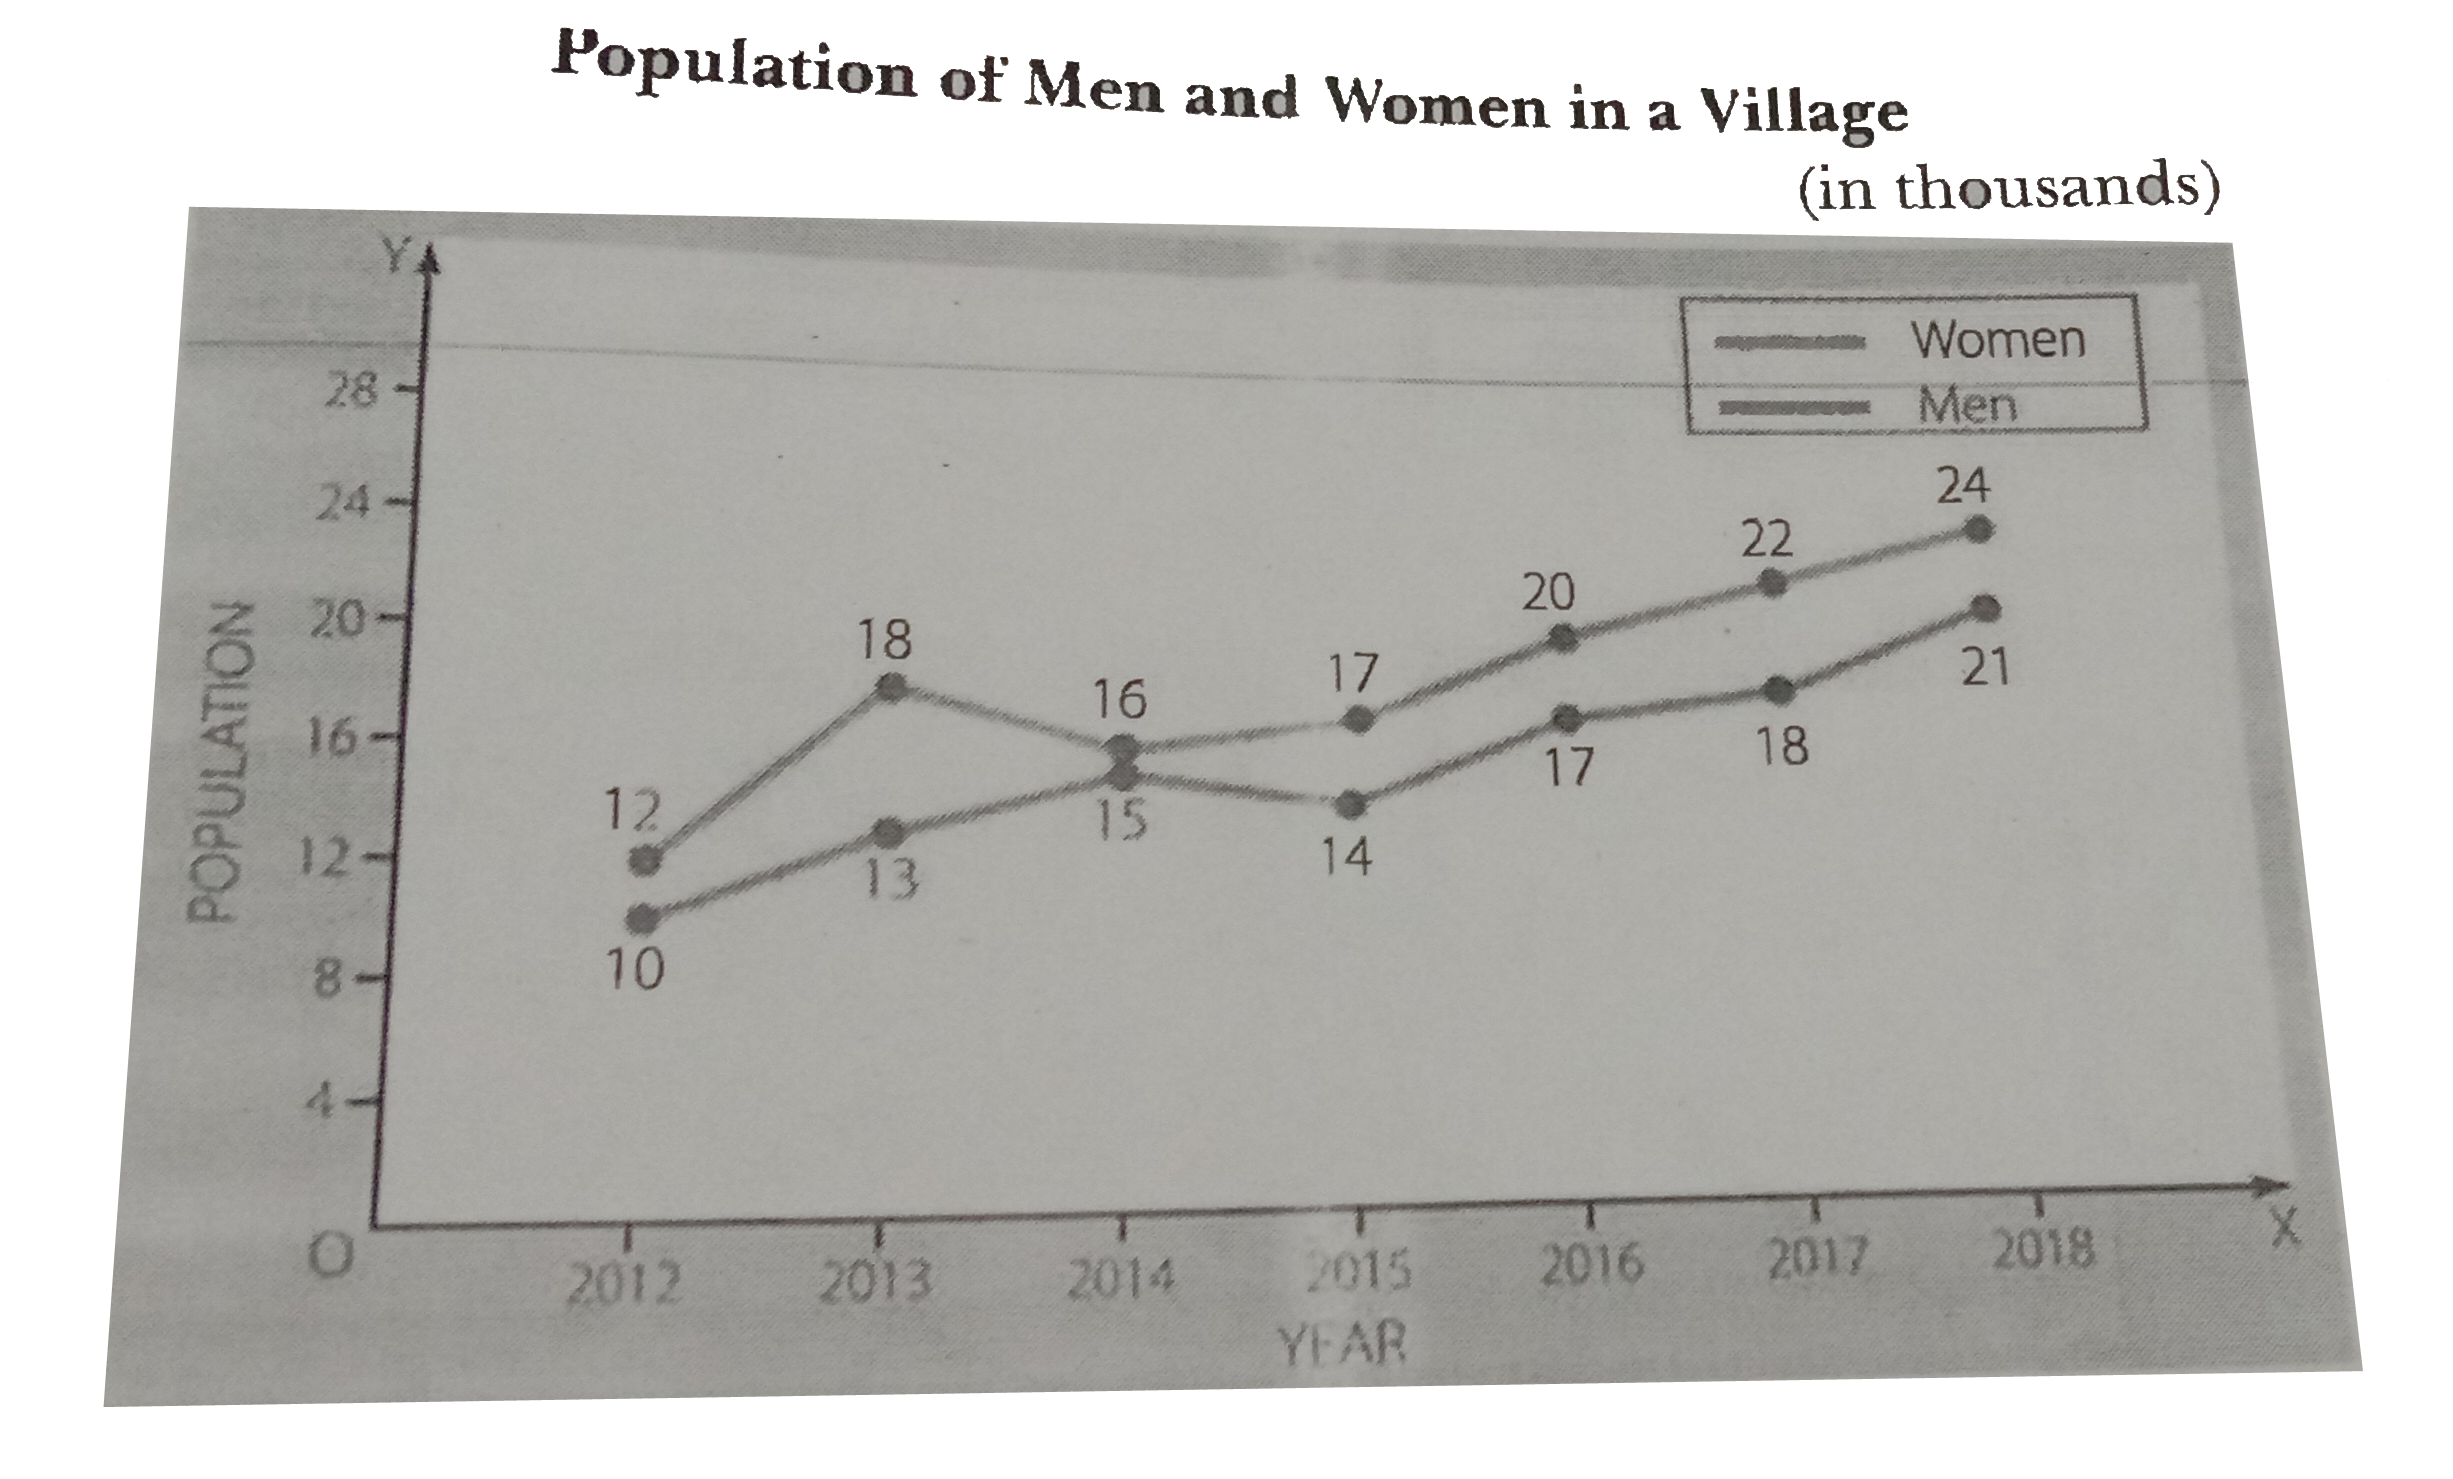
Represent the following data related to population (in thousands) of men and women in a village in different years graphically:
Year2012201320142015201620172018Number of Men10131514171821Number of Women12181617202224
Topper's Solved these Questions
- BOOK - TARUN JAIN & VK OHRICHAPTER - ARITHMETIC LINE-GRAPHS OR TIME SERIES GRAPHSEXERCISE - A. Mupltiple Choice Questions6videos
ARITHMETIC LINE-GRAPHS OR TIME SERIES GRAPHS
- BOOK - TARUN JAIN & VK OHRICHAPTER - ARITHMETIC LINE-GRAPHS OR TIME SERIES GRAPHSEXERCISE - B. Fill in the blank4videos
ARITHMETIC LINE-GRAPHS OR TIME SERIES GRAPHS
- BOOK - TARUN JAIN & VK OHRICHAPTER - CENSUS AND SAMPLE METHODS OF COLLECTION OF DATAEXERCISE - NCERT Question9videos
CENSUS AND SAMPLE METHODS OF COLLECTION OF DATA
Similar Questions
Represent the following data related to export and imports to India (hypothetical figures) graphically:
Year2012201320142015201620172018Exports (in Rs. crore)300350400380450280250Imports (in Rs. crore)420460600480550450400View SolutionRepresent the following data (hypothetical data) graphically:
Year2012201320142015201620172018Production of Wheat (in million tonnes)581316201722View Solution
Knowledge Check
- Question 1 - Select One
The range of the data
12,25,15,18,17,20,22,0,16,11,8,19,10,30,20,38, isA10B15C18D38
Taking 2004 as base year, construct the index numbers of the year 2014 and 2018.
Year200420142015201620172018Prices (Rs.) 10 14 16 20 22 24View SolutionCalcilation Q1,Q3,D6andP85 from the following data :
Size101112131415161718Frequency34512107521View SolutionDraw a histogram representing the following information :
NAV( Rupees)8−1010−1212−1414−1616−18Number of mutual funds2040302515View SolutionFrom the following data , determine the mode by grouping method :
Size7891011121314151617Frequency236122024257531View SolutionFollowing table gives hypothetical figures of exports from India during the years 2013-14 to 2017-18. Present the information in the form of a suitable graph.
Year2013−142014−152015−162016−172017−18Exports (Rs. core)600640670780900View SolutionFind the mean deviation about the mean for the following data :
17,20,12,13,15,16,12,18,15,19,12,11View SolutionThe following table shows the number of toys sold by a mart during a week. Draw a line graph to represent the given data.
WeekMonTueWedThursFriSatSunNumber of Toys21101724101620View Solution


