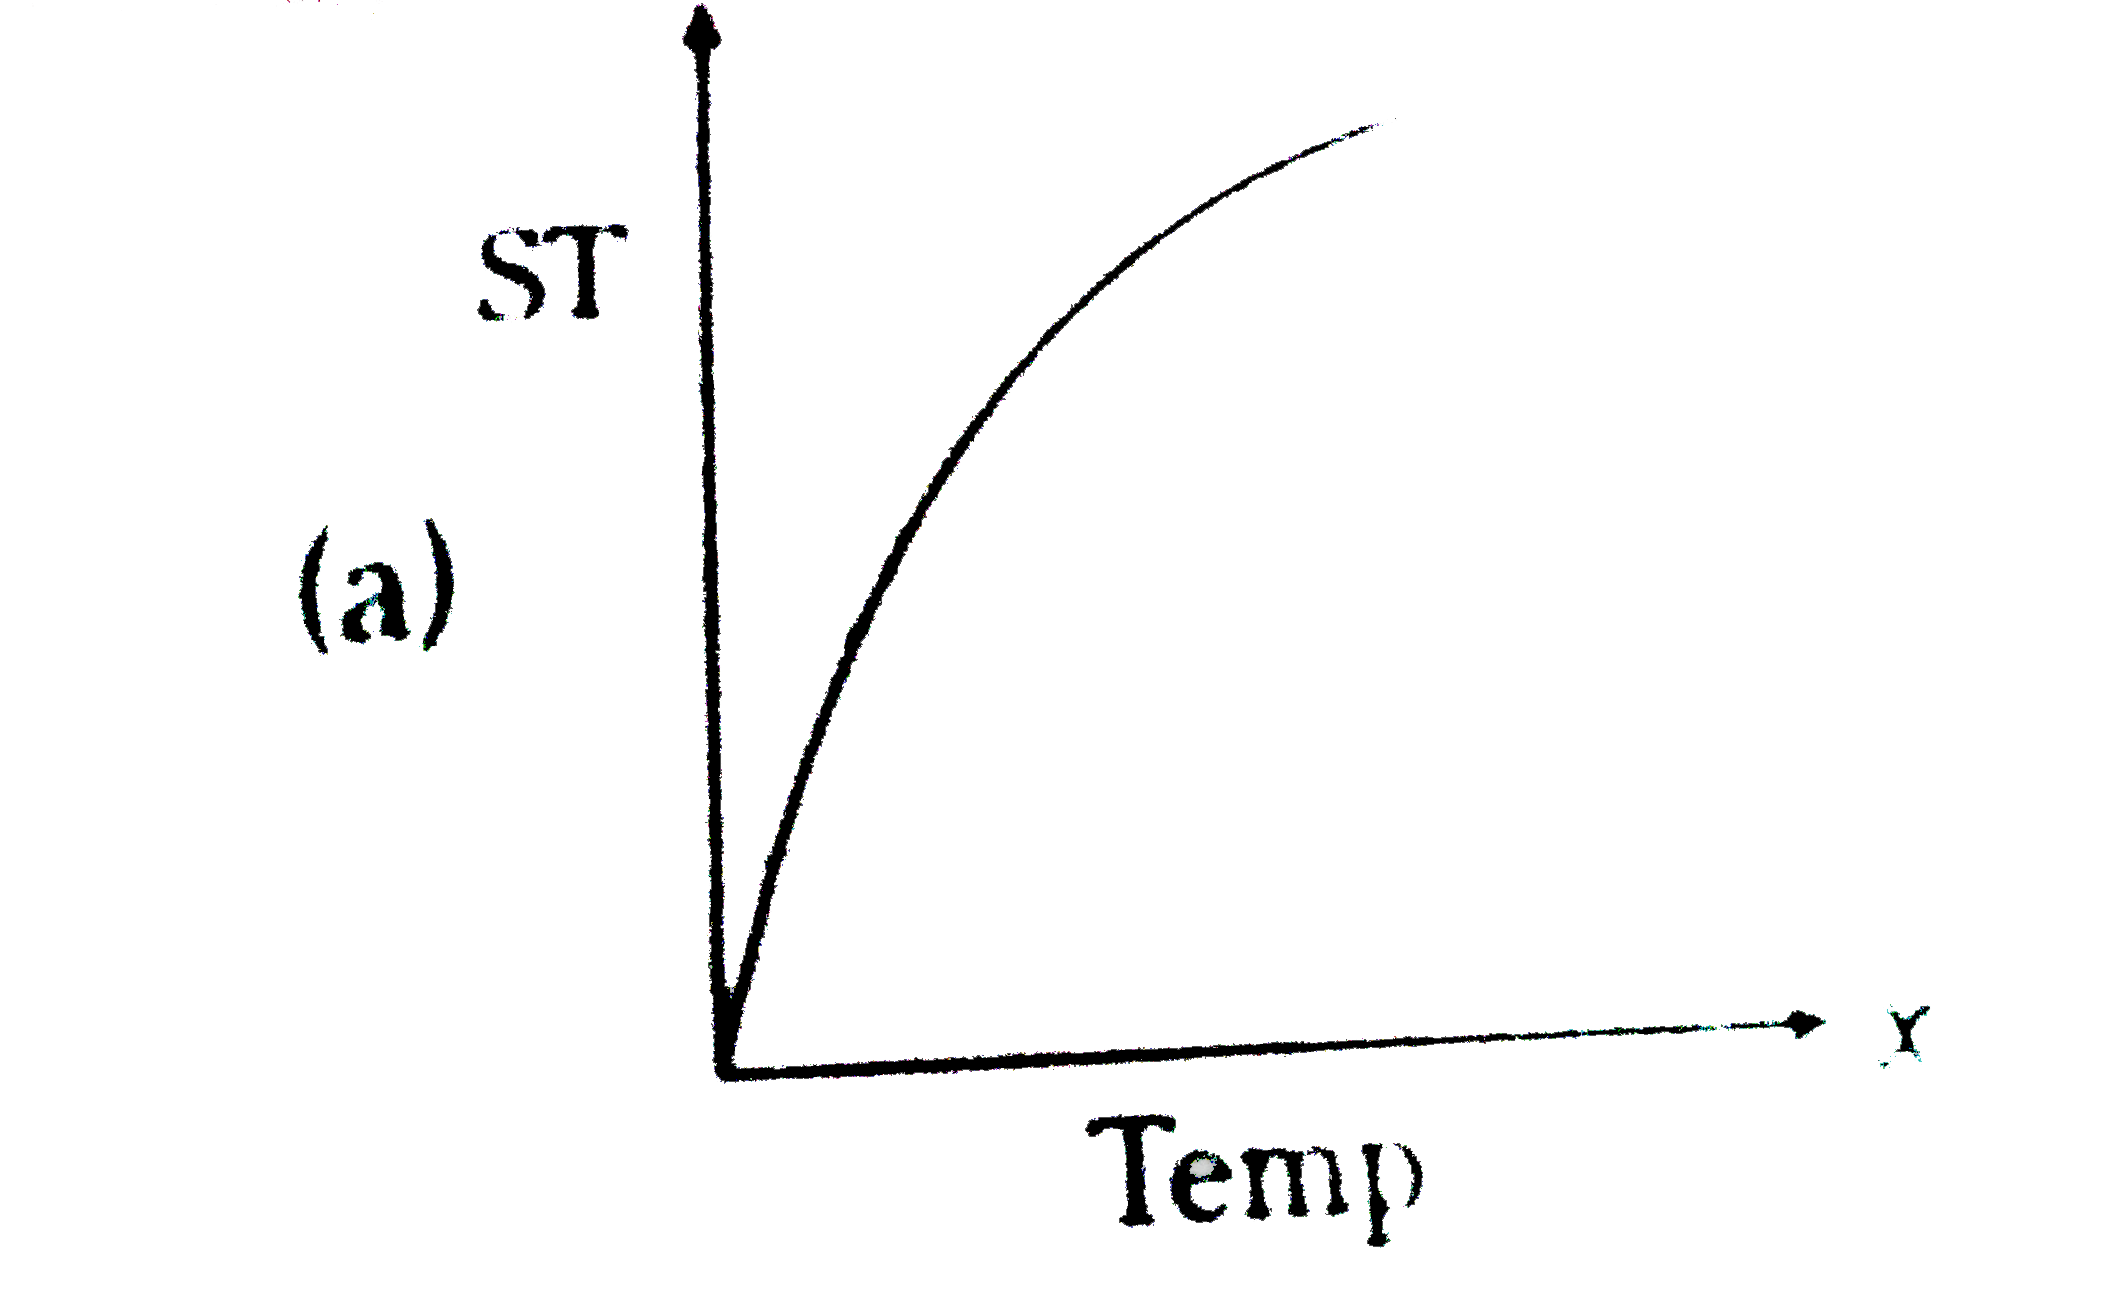
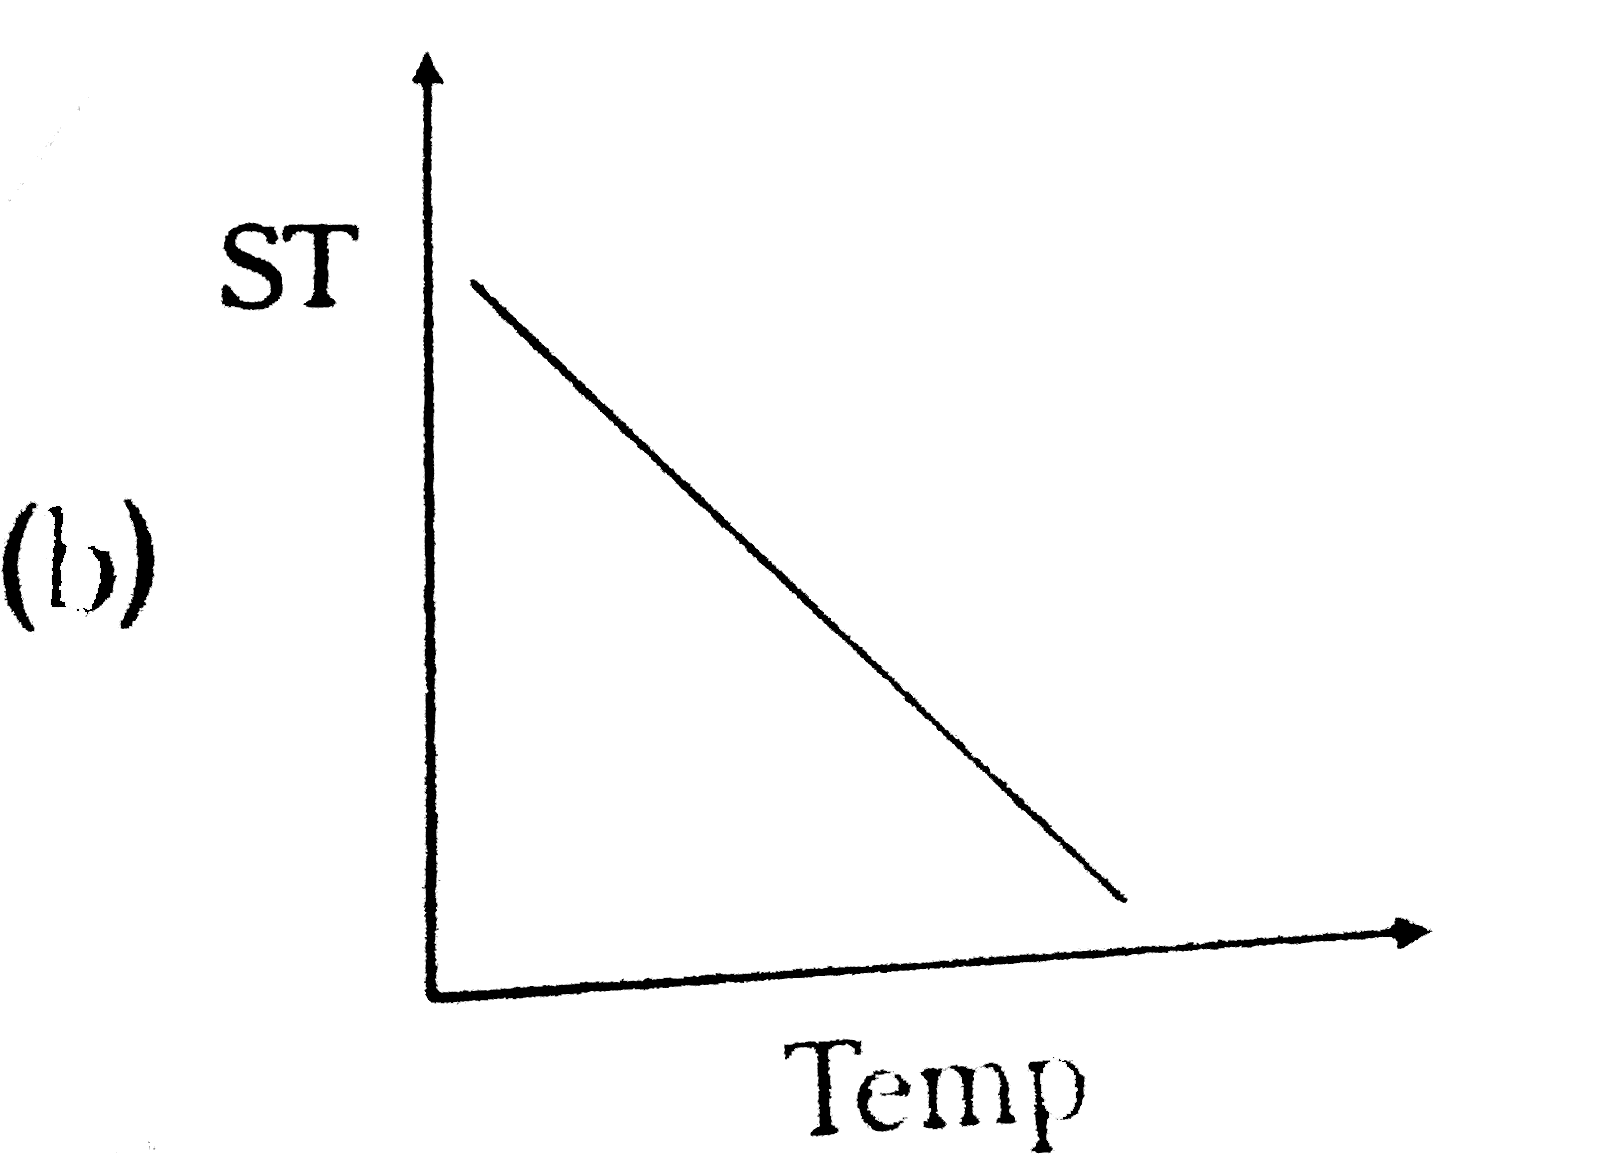
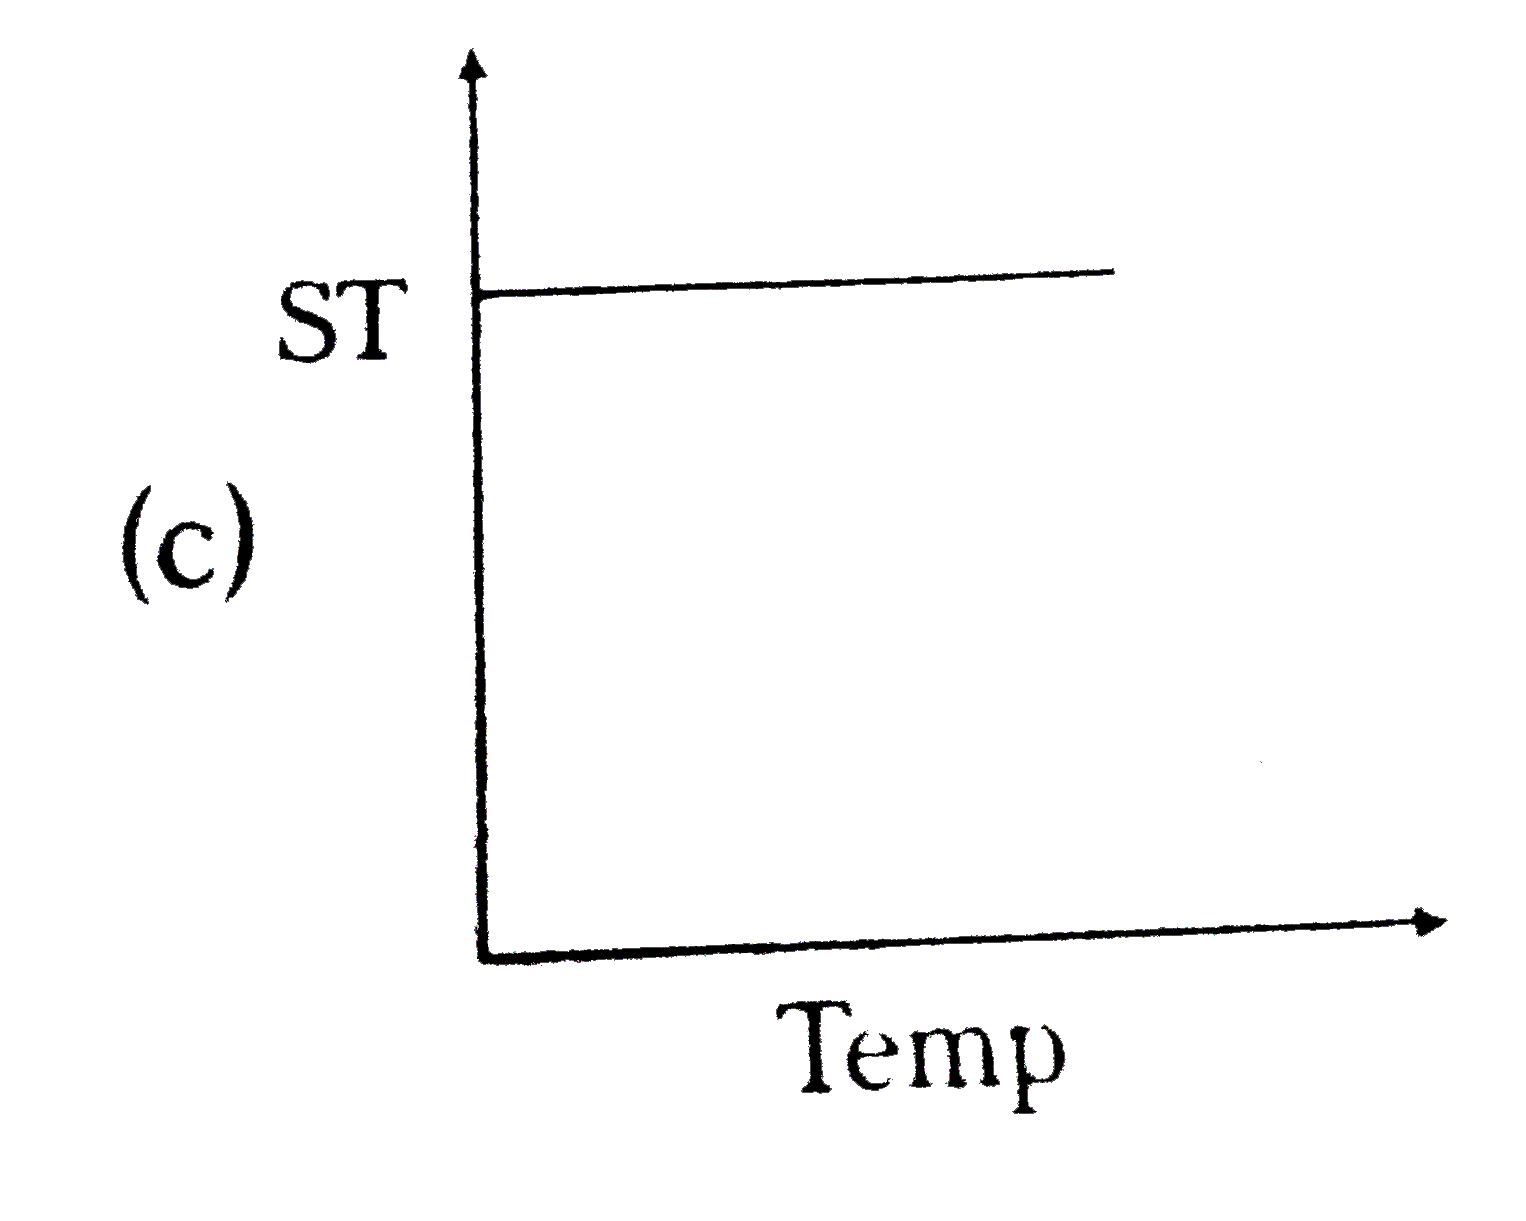
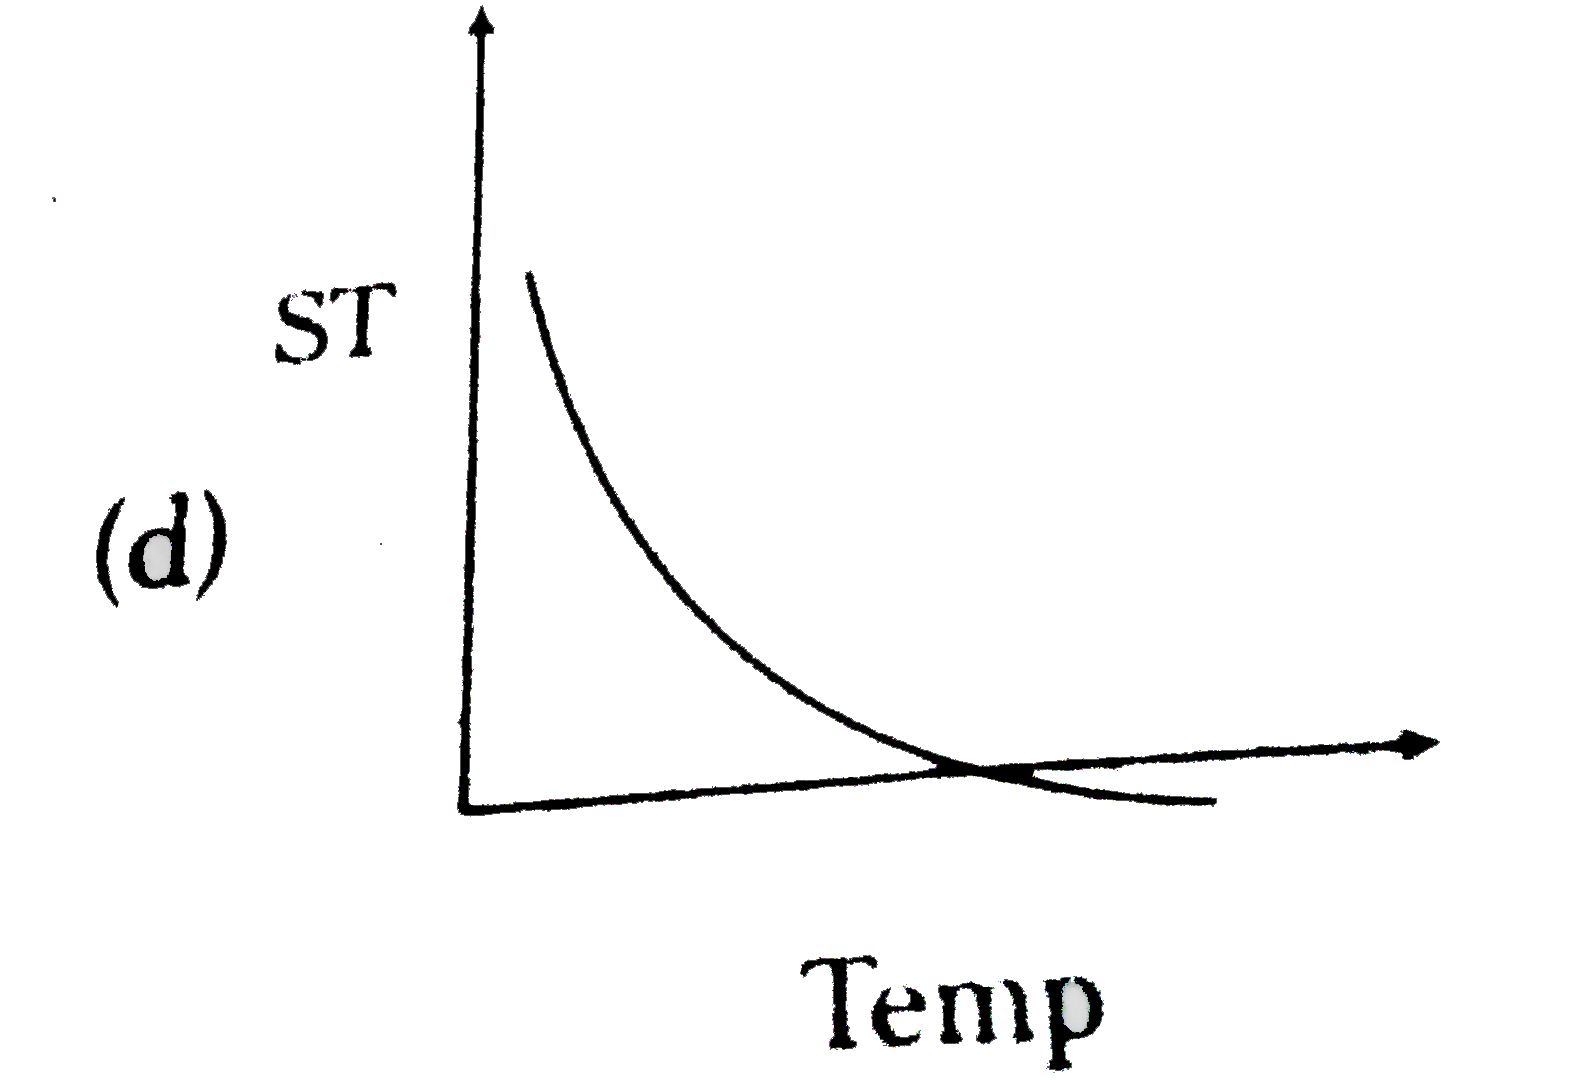
Which graph represents the variation of surface tension with temperature over small temperature ranges for water?
A

B

C

D

Video Solution
Text Solution
The correct Answer is:B
T_(c)=T_(0)(1-alphat)" i.e., surface tension decreses linerly with increase intemperature.
|
Updated on:21/07/2023
Topper's Solved these Questions
- BOOK - DC PANDEYCHAPTER - FLUID MECHANICSEXERCISE - B) Medical entrance special format question19videos
FLUID MECHANICS
- BOOK - DC PANDEYCHAPTER - FLUID MECHANICSEXERCISE - Match the columns6videos
FLUID MECHANICS
- BOOK - DC PANDEYCHAPTER - FLUID MECHANICSEXERCISE - Check point 13.410videos
FLUID MECHANICS
- BOOK - DC PANDEYCHAPTER - EXPERIMENTSEXERCISE - Subjective15videos
EXPERIMENTS
- BOOK - DC PANDEYCHAPTER - GENERAL PHYSICSEXERCISE - INTEGER_TYPE2videos
GENERAL PHYSICS
Similar Questions
Knowledge Check
- Question 1 - Select One
Which one of the following graphs represents the variation of surface tension of water with temperture for a small range of temperature ?
A B
B C
C D
D
- Question 2 - Select One
Which one of the following represents correctly the variations of surface tension with temperature θ ?
AT∝θBT∝θ−1CT∝θ2DT∝θ−2 - Question 3 - Select One
The graph between surface tension and temperature T is
A B
B C
C D
D
Which one of the following given graphs represents the variation of rate constant (k) with temperature (t) for an endothermic reaction ?
View SolutionShow variation of resistivity of SI with temperature in a graph.
View SolutionArrhenius equation is :
k=Ae−E/RT
Which of the following graphs represents the variation of rate constant k against temperatureT ?View Solutionwhich of the following graph represents the variation of resistivity (ρ) with temperature (T) for copper?
View SolutionWhich of the following curve represent variation of density of water with temperature best-
View Solution
