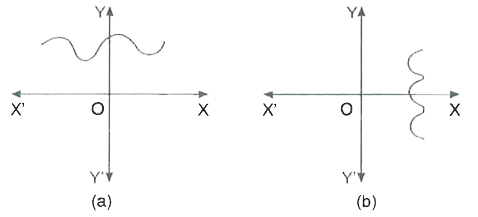
Which one of the following graphs represent the realationship of emperature (in degree centigrade) and enzyme activity in bacteria found in hot springs?
A

B

C

D

Text Solution
The correct Answer is:B
|
Similar Questions
Knowledge Check
Which one of the following graphs represents motion?
A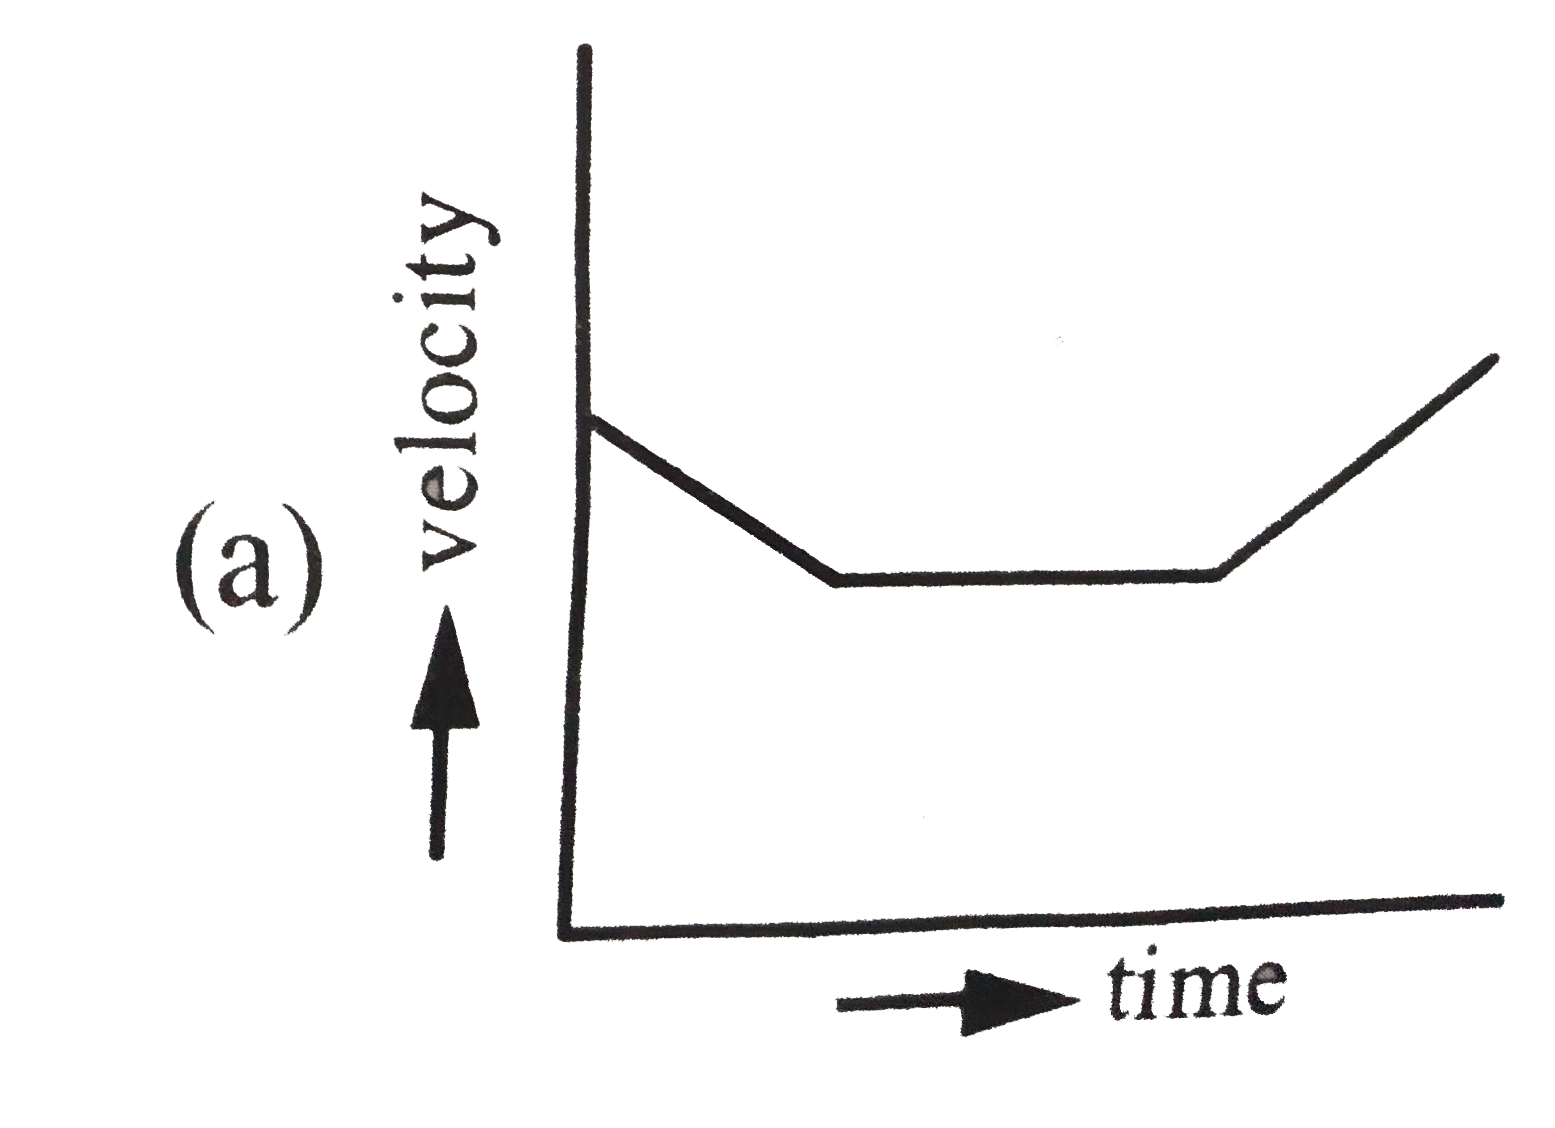 B
B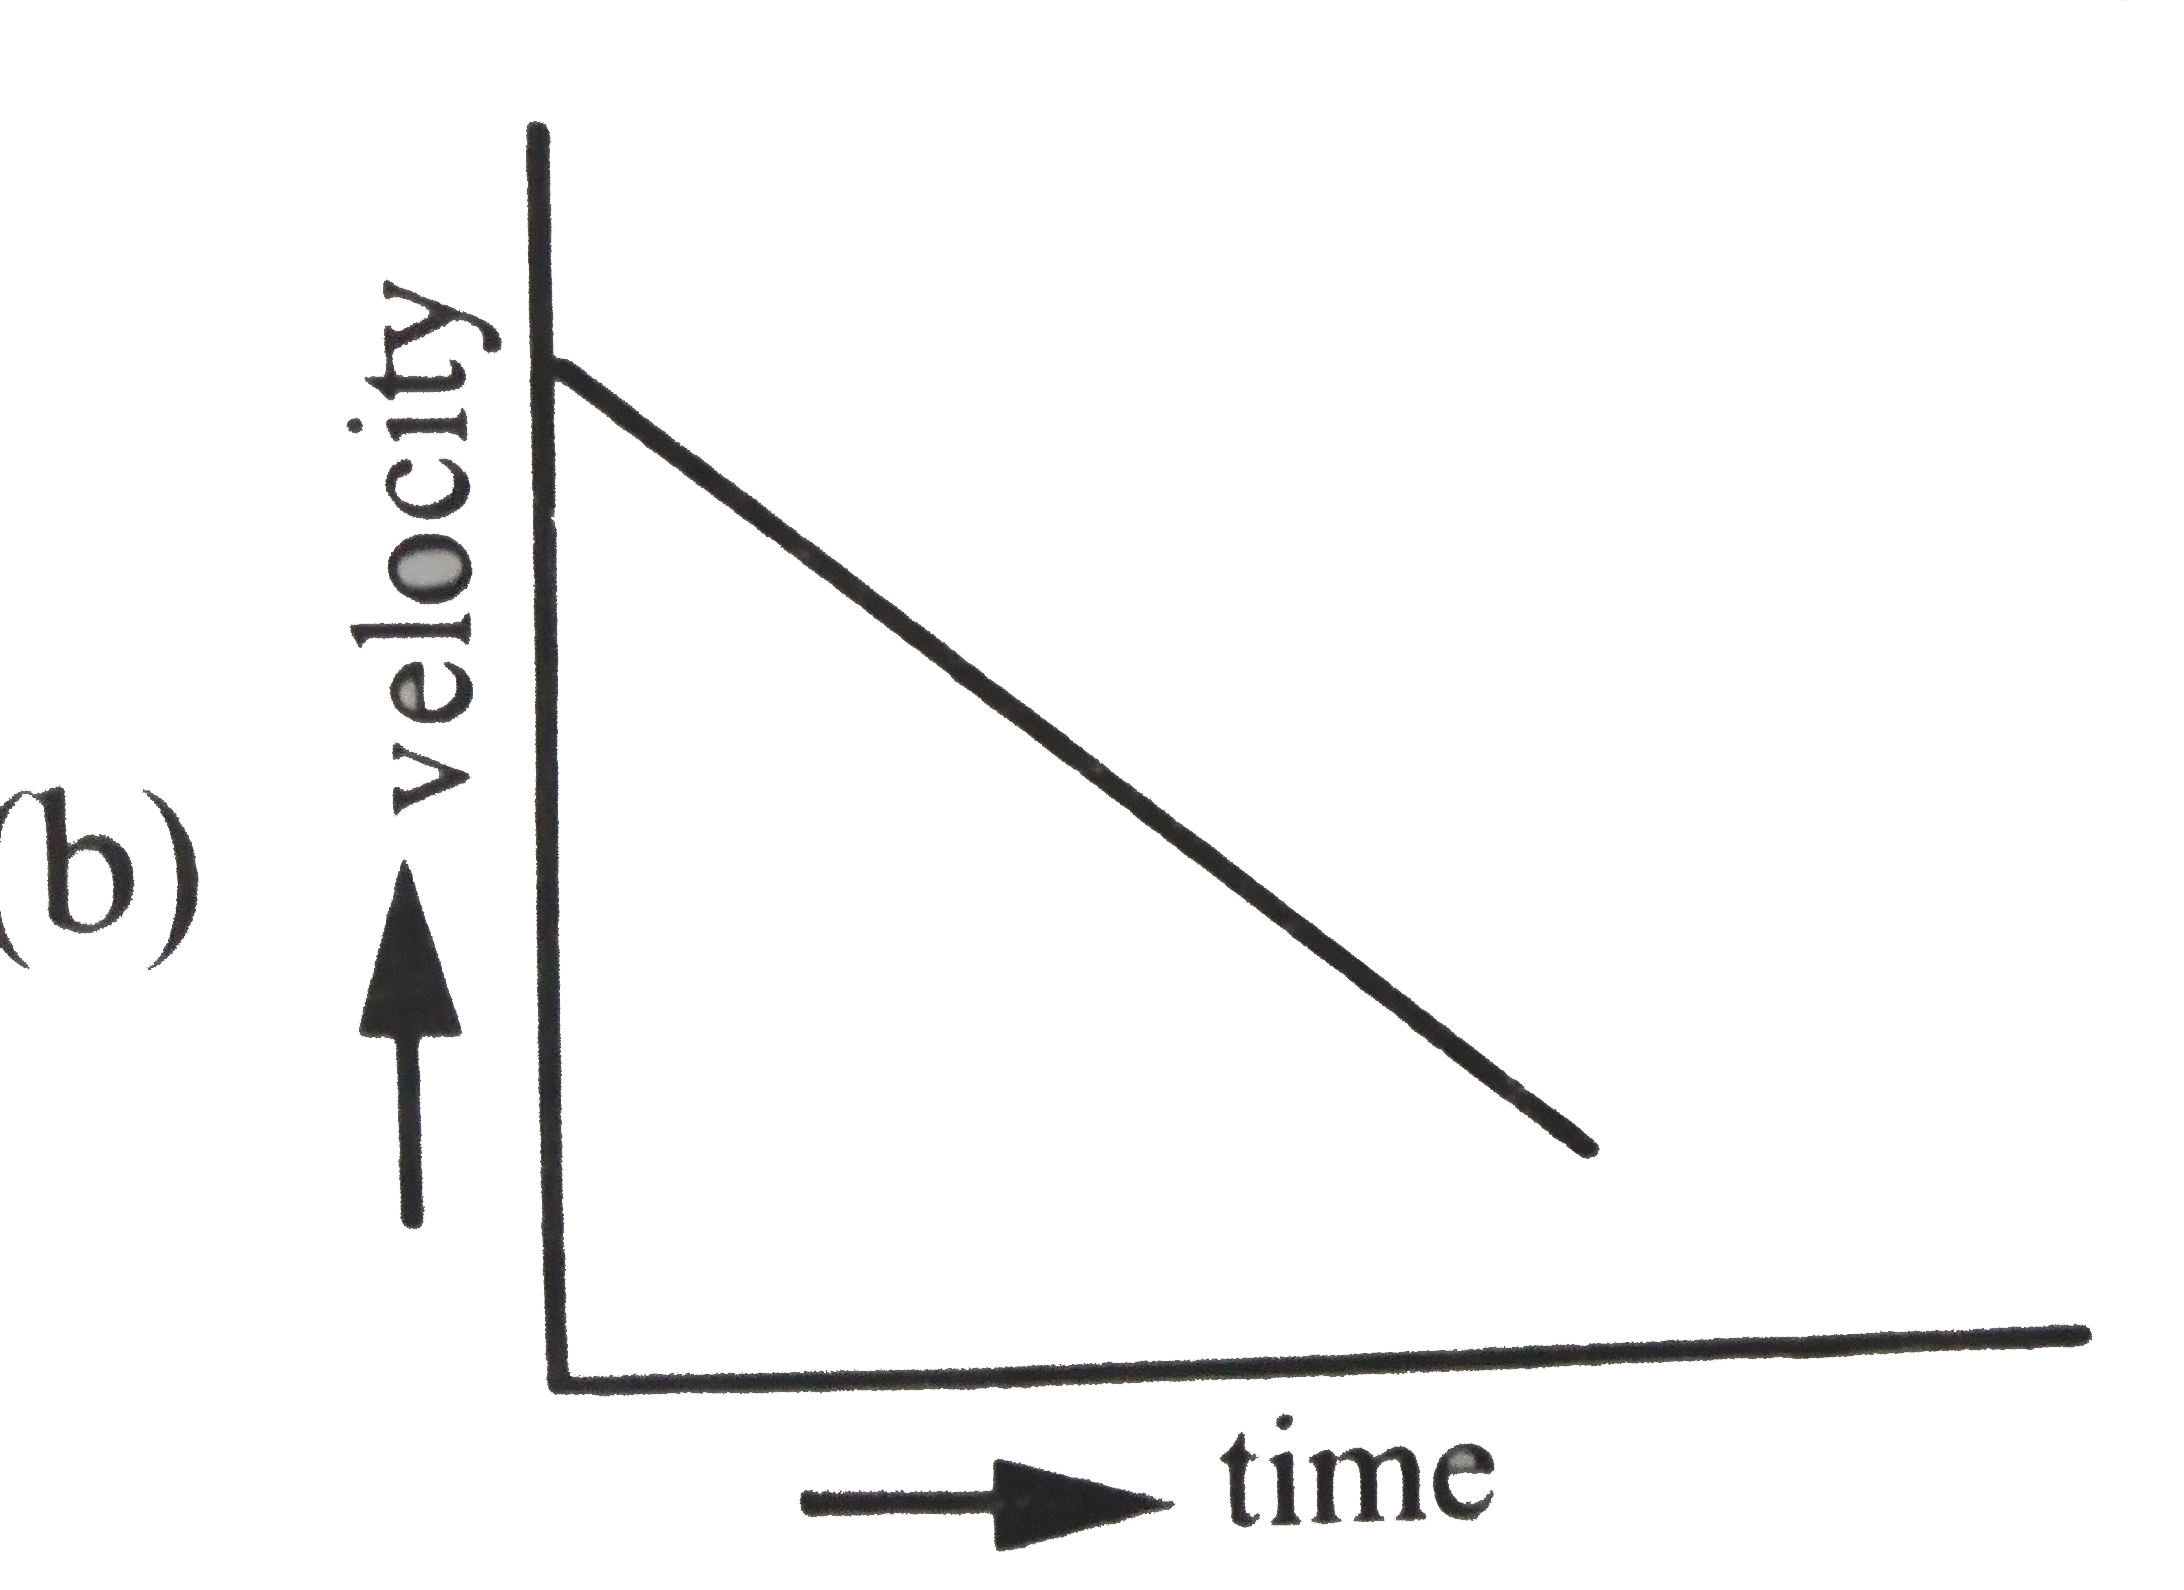 C
C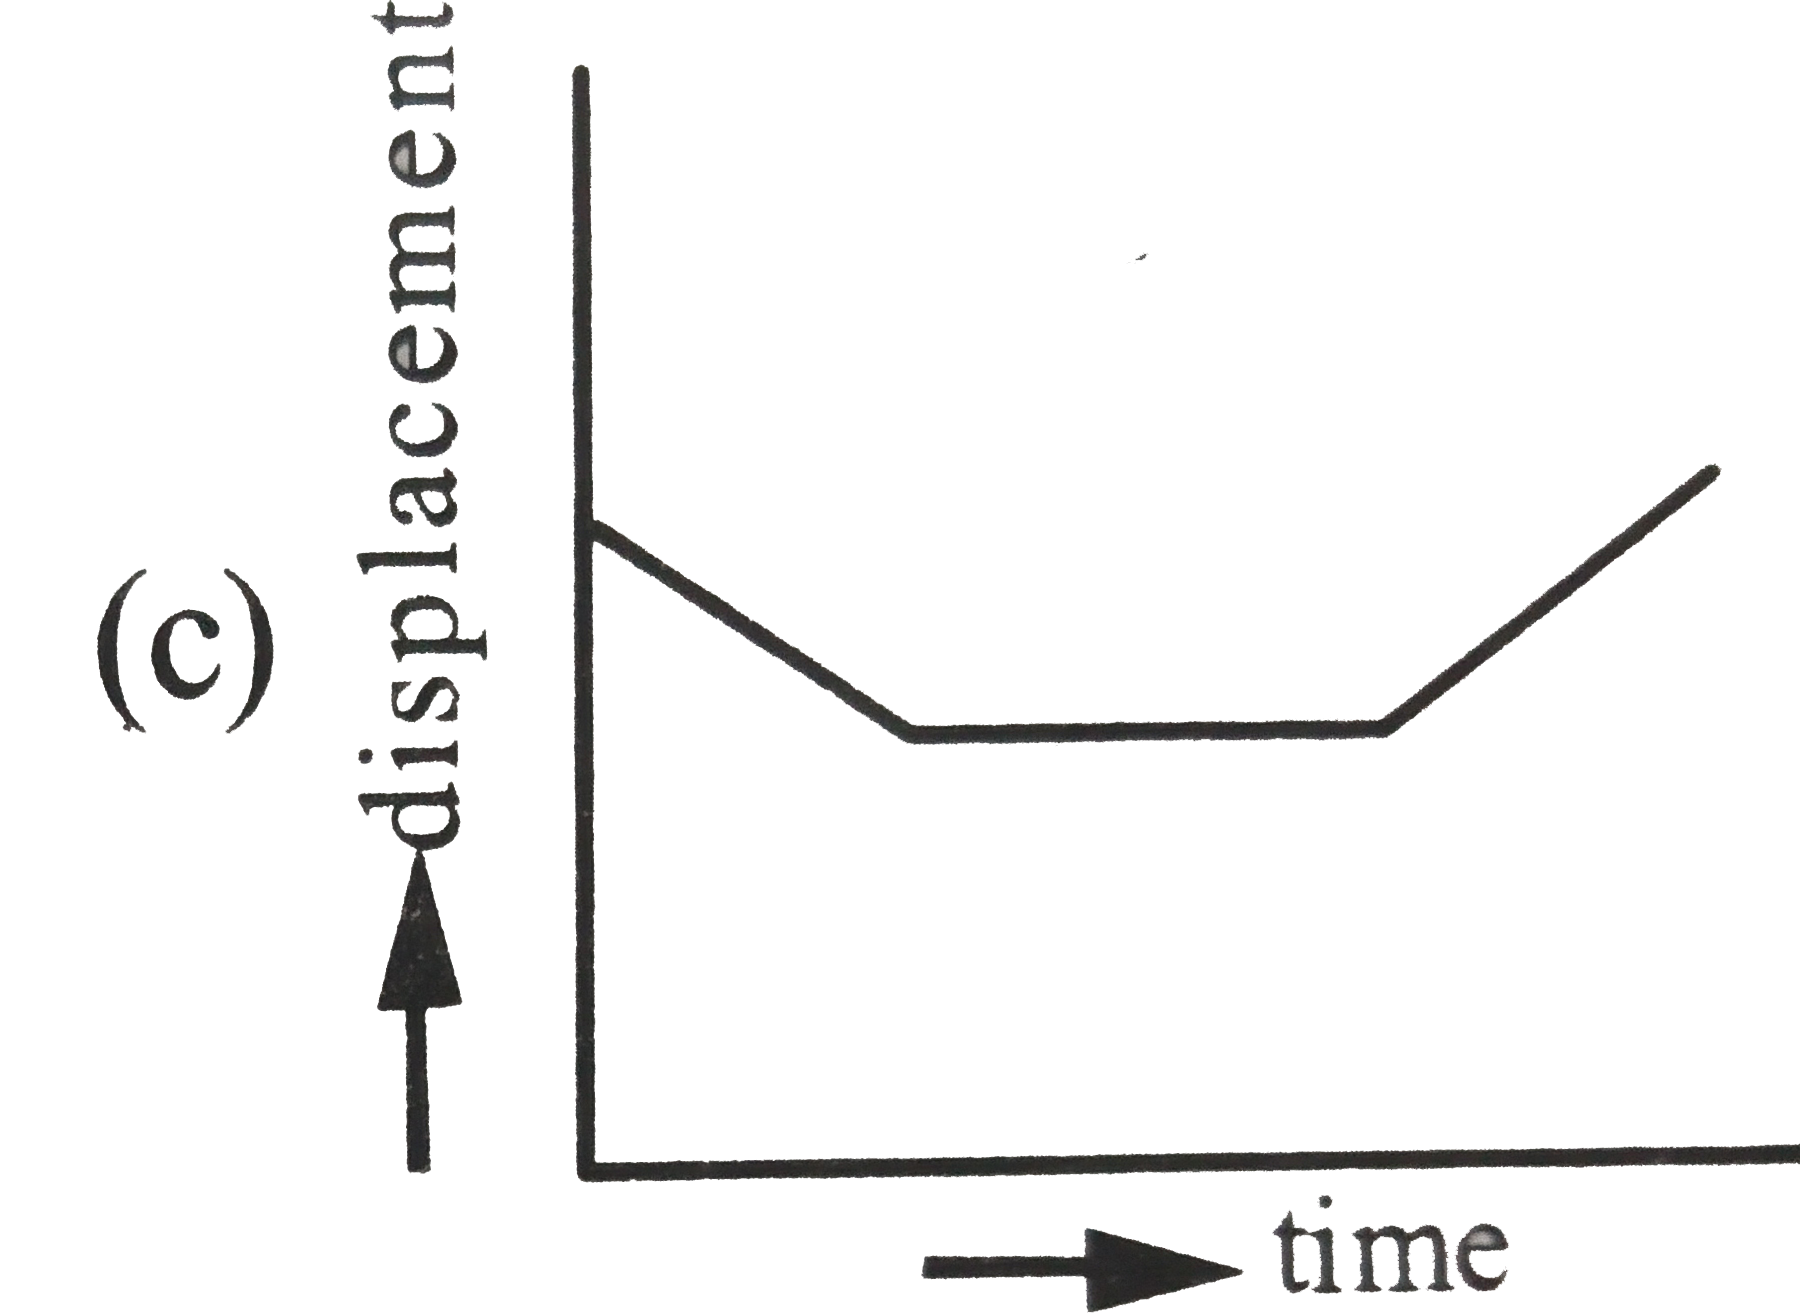 D
D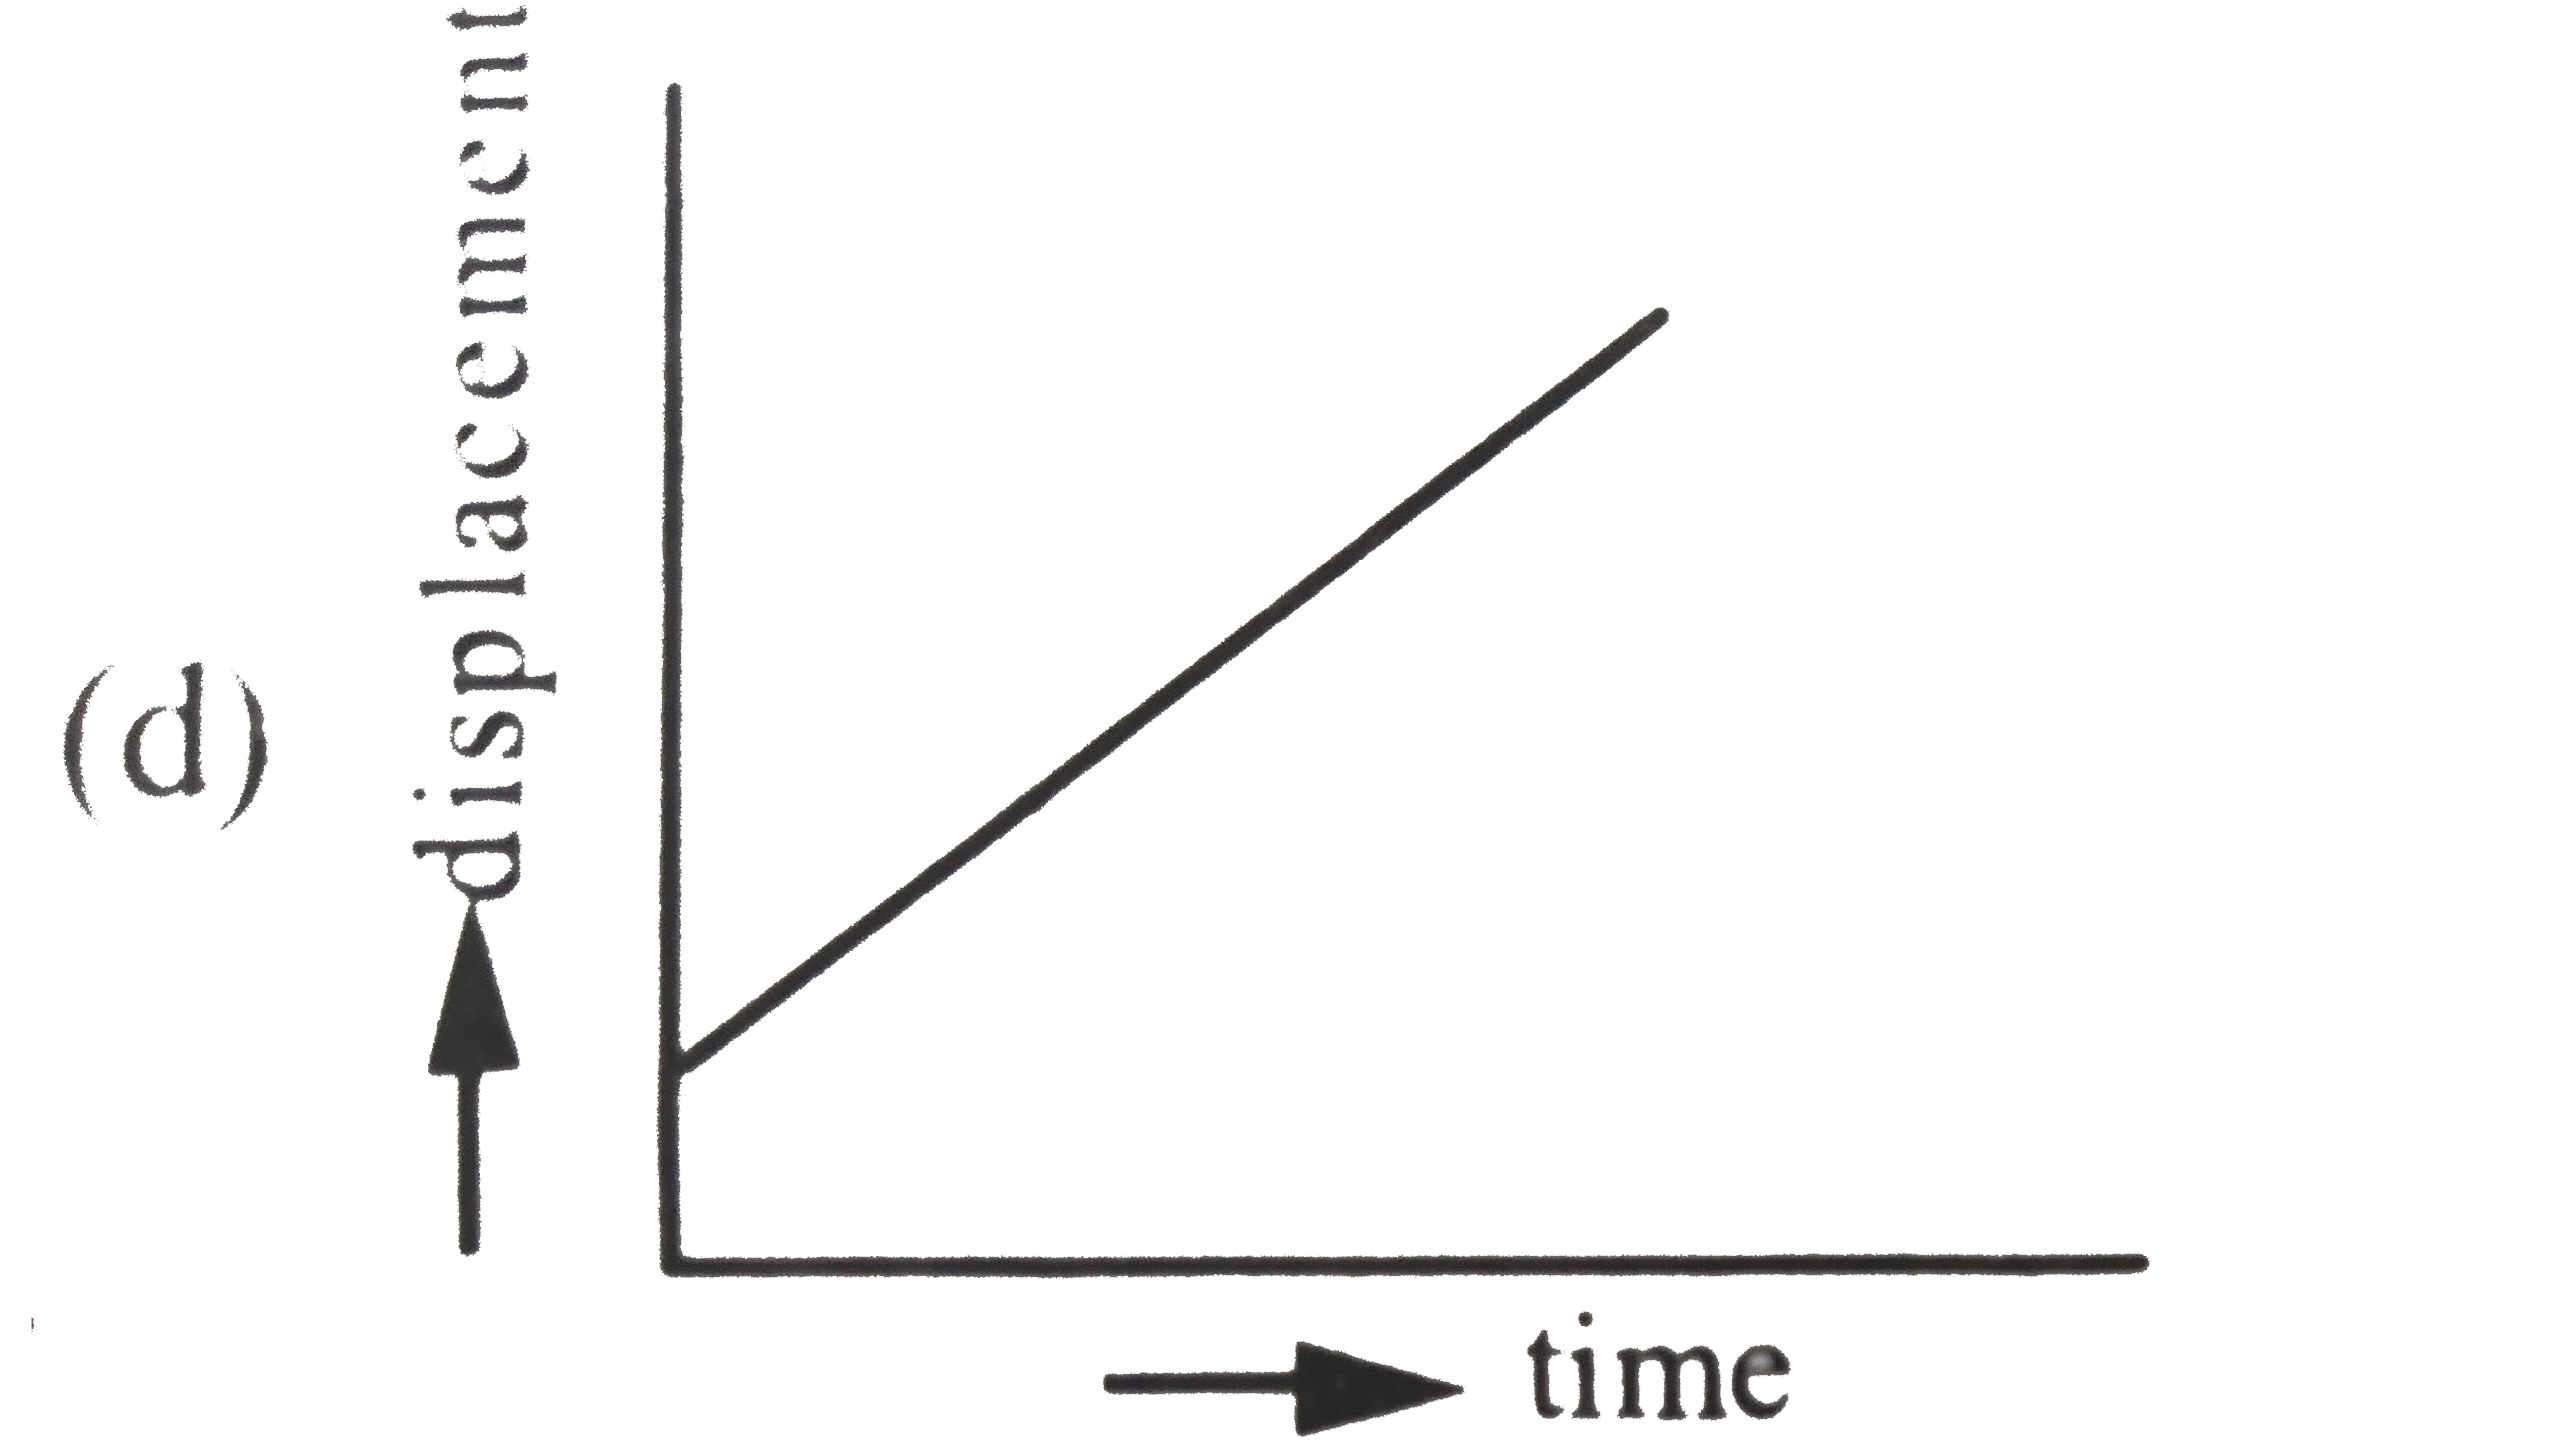
which of the following kingdom represent bacteria?
A1-MoneraB2-ProtistaC3-ProtozoaD4-MetazoaWhich of the following graphs cannot represent one dimensional motion of a particle?
A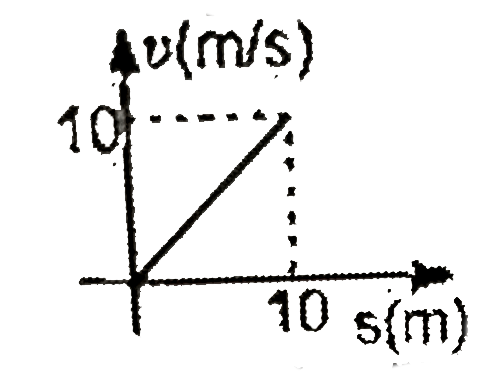 B
B C
C D
D
Which of the following graphs represents rate of cooling of hot water?
View SolutionWhich one of the following graphs represent a one-one function? (FIGURE)
View SolutionWhich one of the following diagrams represents the most common relationships between temperature and enzyme activity, when the temperature is raised gradually from 0- 80∘ C?
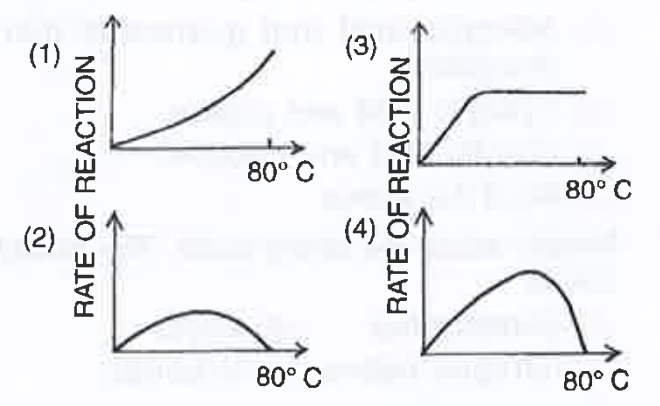
View SolutionWhich of the following graph is correct for the enzyme catalysis ?
View SolutionWhich of the following graph is correct for the enzyme catalysis ?
View Solution

