The top speeds of 30 different land animals have been organised into a frequency table given below:

Draw a histogram for the given data.
Step by step video & image solution for The top speeds of 30 different land animals have been organised into a frequency table given below: Draw a histogram for the given data. by Maths experts to help you in doubts & scoring excellent marks in Class 8 exams.
Updated on:21/07/2023Topper's Solved these Questions
- DATA HANDLING BOOK - RS AGGARWALCHAPTER - DATA HANDLING EXERCISE - Exercise 21B
6 Videos
- CUBES AND CUBE ROOTSBOOK - RS AGGARWALCHAPTER - CUBES AND CUBE ROOTSEXERCISE - Test Paper-4 (Fill in the blanks)
4 Videos
- DIRECT AND INVERSE PROPORTIONSBOOK - RS AGGARWALCHAPTER - DIRECT AND INVERSE PROPORTIONSEXERCISE - TEST PAPER -12 (Fill in the blanks )
5 Videos
Similar Questions
The ages (in years) of 360 patients treated in a hospital on a particular day are given below:

Draw a histogram for the given data.
View SolutionIn a class of 40 students, the marks obtained (out of 50) are as given below:

Draw a histogram to represent the given data.
View SolutionMake a frequency polygon and histogram using the given data :

View SolutionThe marks scored by students in Mathematics in a certain examinations are given below:

Draw histogram for the above data.
View SolutionThe marks scored by students in Mathematics in a certain examinations are given below:

Draw histogram for the above data.
View SolutionIn a district, the number of branches of different banks is given below:

Draw a pie chart for this data.
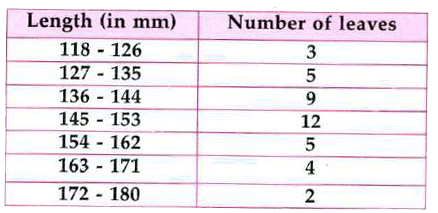
View SolutionThe length of 40 leaves of a plant are measured correct to one millimetre, and the obtained data is represented in the following table:

Draw a histogram to represent the given data. [Hint: First make the class intervals continuous]
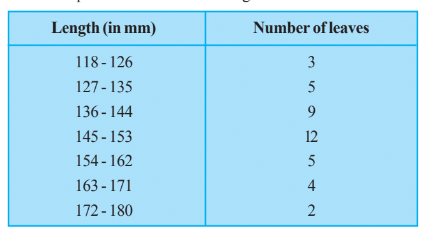
View SolutionThe length of 40 leaves of a plant measured correct to one millimetre and the obtained data is represented in the following table:

(i) Draw a histogram to represent the given data.
(ii) Is there any other suitable graphical representation for the same data?
(iii) Is it correct to conclude that the maximum number of leaves 153 mm long and why?
View SolutionThe length of 40 leaves of a plant are measured correct to one millimeter, and the obtained data is represented in the following table:

(i) Draw a histogram to represent the given data.
(ii) Is there any other suitable graphical representation for the same data?
(iii) Is it correct to conclude that the maximum number of leaves are 153 mm long?Why?
View SolutionPresent the data given in the table below in a histogram :

View Solution
