Draw the graph of y=sin−1(2x1+x2)
Text Solution
We have y=f(x)=sin−1(2x1−x2)
Let x =tan,θ,θ∈(−π/2,π/2)
⇒ θ=tan−1x
Now sin−1(2x1+x2)=sin−1(2tanθ1+tan2θ)
=sin−1(sin2θ)
=sin−1(sinα),where α∈(−π,π)
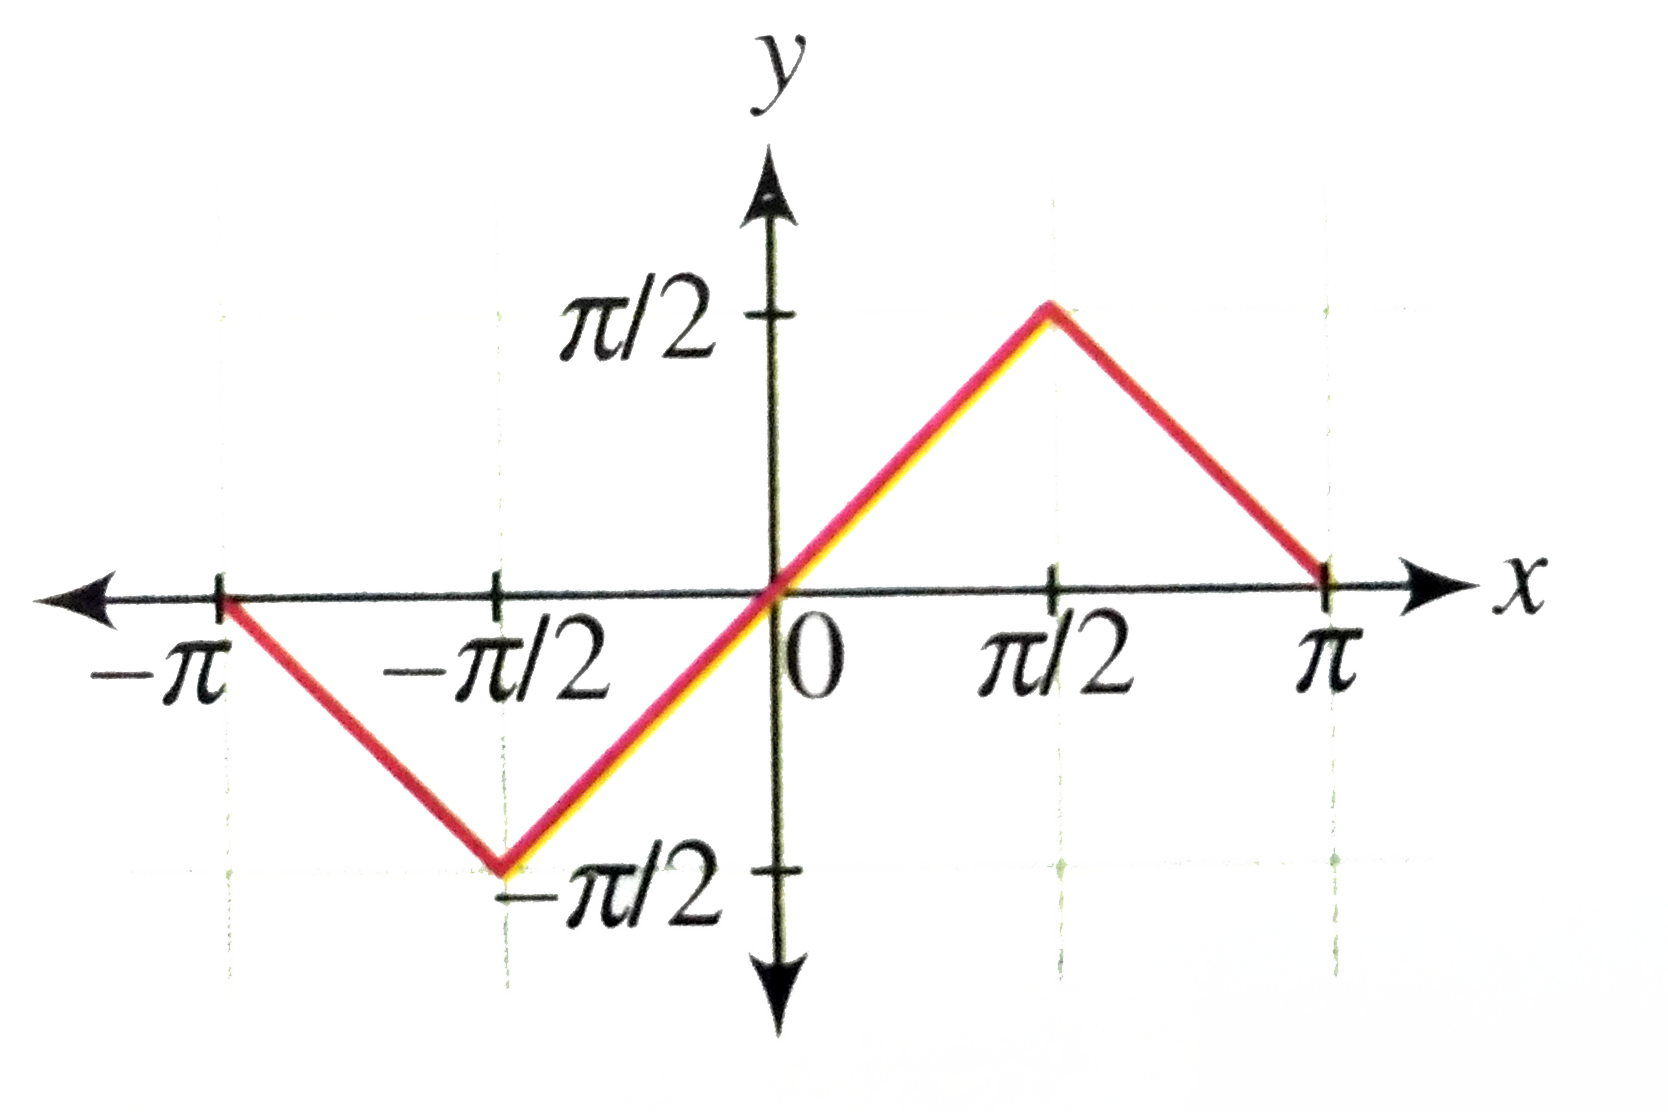
Now consider the graph of y=sin−1(sinα),where α∈(−π,π)

From the graph.
sin−1(2x1+x2)=sin−1(sinα)
=⎧⎪⎨⎪⎩−α−π−π<α<−π/2α−π/2≤α≤π/2−α+ππ/2<α<π
=⎧⎪
⎪⎨⎪
⎪⎩−2tan−1x−π−π<2tan−1x<−π/22tan−1x−π−π/2≤2tan−1x≤π/2−2tan−1x+π−π/2<tan−1x<π
=⎧⎪
⎪⎨⎪
⎪⎩−2tan−1x−π−π<2tan−1x<−π/42tan−1x−π−π/2≤2tan−1x≤π/4−2tan−1x+π−π/4<tan−1x<π/2
=⎧⎪⎨⎪⎩−2tan−1x−πx<−12tan−1x−1≤x≤1−2tan−1x+πx>1
f(x)=⎧⎪
⎪
⎪
⎪
⎪⎨⎪
⎪
⎪
⎪
⎪⎩−21+x2x<−121+x2−1<x<1−21+x2x>1
So f(x) decreases for x<−1x> and f(x) increases for−1<x<1
limx→−∞(−2tan−1x−π)=0 and −2tan−1(−1)−π−π2
Thus, sin−1(2x1+x2)decreses form 0 to−π2when x increases form −∞ to −1
f(−1)=2tan−1−π2,f(1)=2tan−1(1)=π2
Thus, sin−1(2x1+x2) increases form −π2 to π2 when x increases form -1 to 1
−2tan−1(1)+π=π2 andlimx→∞(−2tan−1x+π)=0
Thus, sin−1(2x1+x2)decreases form π2 to 0 when x increases form 1 to ∞.
Also f(x) is non-differentiable at x=±1
From the above information, the graph of y=f(X) is as shown in the following figure.

From this information, we can draw the graph of y=sin−1(2x1+x2) as follows.
Here y = 0 is an asymtote.
|
Topper's Solved these Questions
- GRAPH OF INVERSE TRIGONOMETRIC FUNCTIONSBOOK - CENGAGECHAPTER - GRAPH OF INVERSE TRIGONOMETRIC FUNCTIONSEXERCISE - Exercise
18 Videos
- GETTING STARTED WITH GRAPHSBOOK - CENGAGECHAPTER - GETTING STARTED WITH GRAPHSEXERCISE - Exercise
18 Videos
- GRAPHICAL TRANSFORMATIONSBOOK - CENGAGECHAPTER - GRAPHICAL TRANSFORMATIONSEXERCISE - Exercise
22 Videos
Similar Questions
Draw the graph of y=sin−1(x2)
View SolutionDraw the graph of y=sin−1(x2)
View SolutionDraw the graph of y=tan−1(2x1−x2)
View SolutionDraw the graph of y=tan−1(2x1−x2)
View SolutionDraw the graph of y=sin−1(2x√1−x2)
View SolutionDraw the graph of y=sin−1(2x√1−x2)
View SolutionDraw the graph of y=sin−1(sinx)
View SolutionDraw the graph of y=sin−1(sinx)
View SolutionDraw the graph of y=sin−1,1x
View SolutionDraw the graph of y=sin−1,1x
View Solution
