PV versus T graph of equal masses ofH2, He and CO2 is shown in figure. Choose the correct alternative
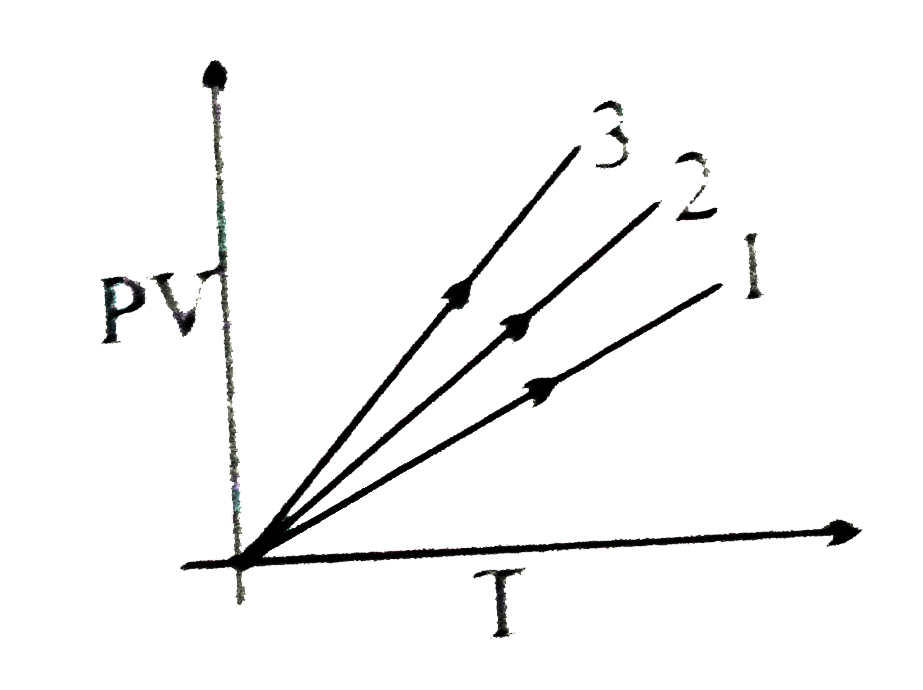
3 corresponds to H2,2 to He and 1 to CO2
1 corresponds to He,2 to H2 and 3 to CO2
1 corresponds to He,3 to H2 and 2 to CO2
1 corresponds to CO2,2 to H2 and 3 to He
The correct Answer is:A
PVT=tanθ=nR
∴ slope α no. of moles
Topper's Solved these Questions
- TEST PAPERSBOOK - BANSALCHAPTER - TEST PAPERSEXERCISE - Physics, SECTION-1 (PART-A) [COMPREHENSION TYPE]
2 Videos
- TEST PAPERSBOOK - BANSALCHAPTER - TEST PAPERSEXERCISE - Physics, SECTION-1 (PART-A) [MULTIPLE CORRECT CHOICE TYPE]
5 Videos
- TEST PAPERSBOOK - BANSALCHAPTER - TEST PAPERSEXERCISE - MATHS
60 Videos
- PROBABILITYBOOK - BANSALCHAPTER - PROBABILITYEXERCISE - All Questions
1 Videos
- THERMODYNAMICSBOOK - BANSALCHAPTER - THERMODYNAMICSEXERCISE - Match the column
7 Videos
Similar Questions
Knowledge Check
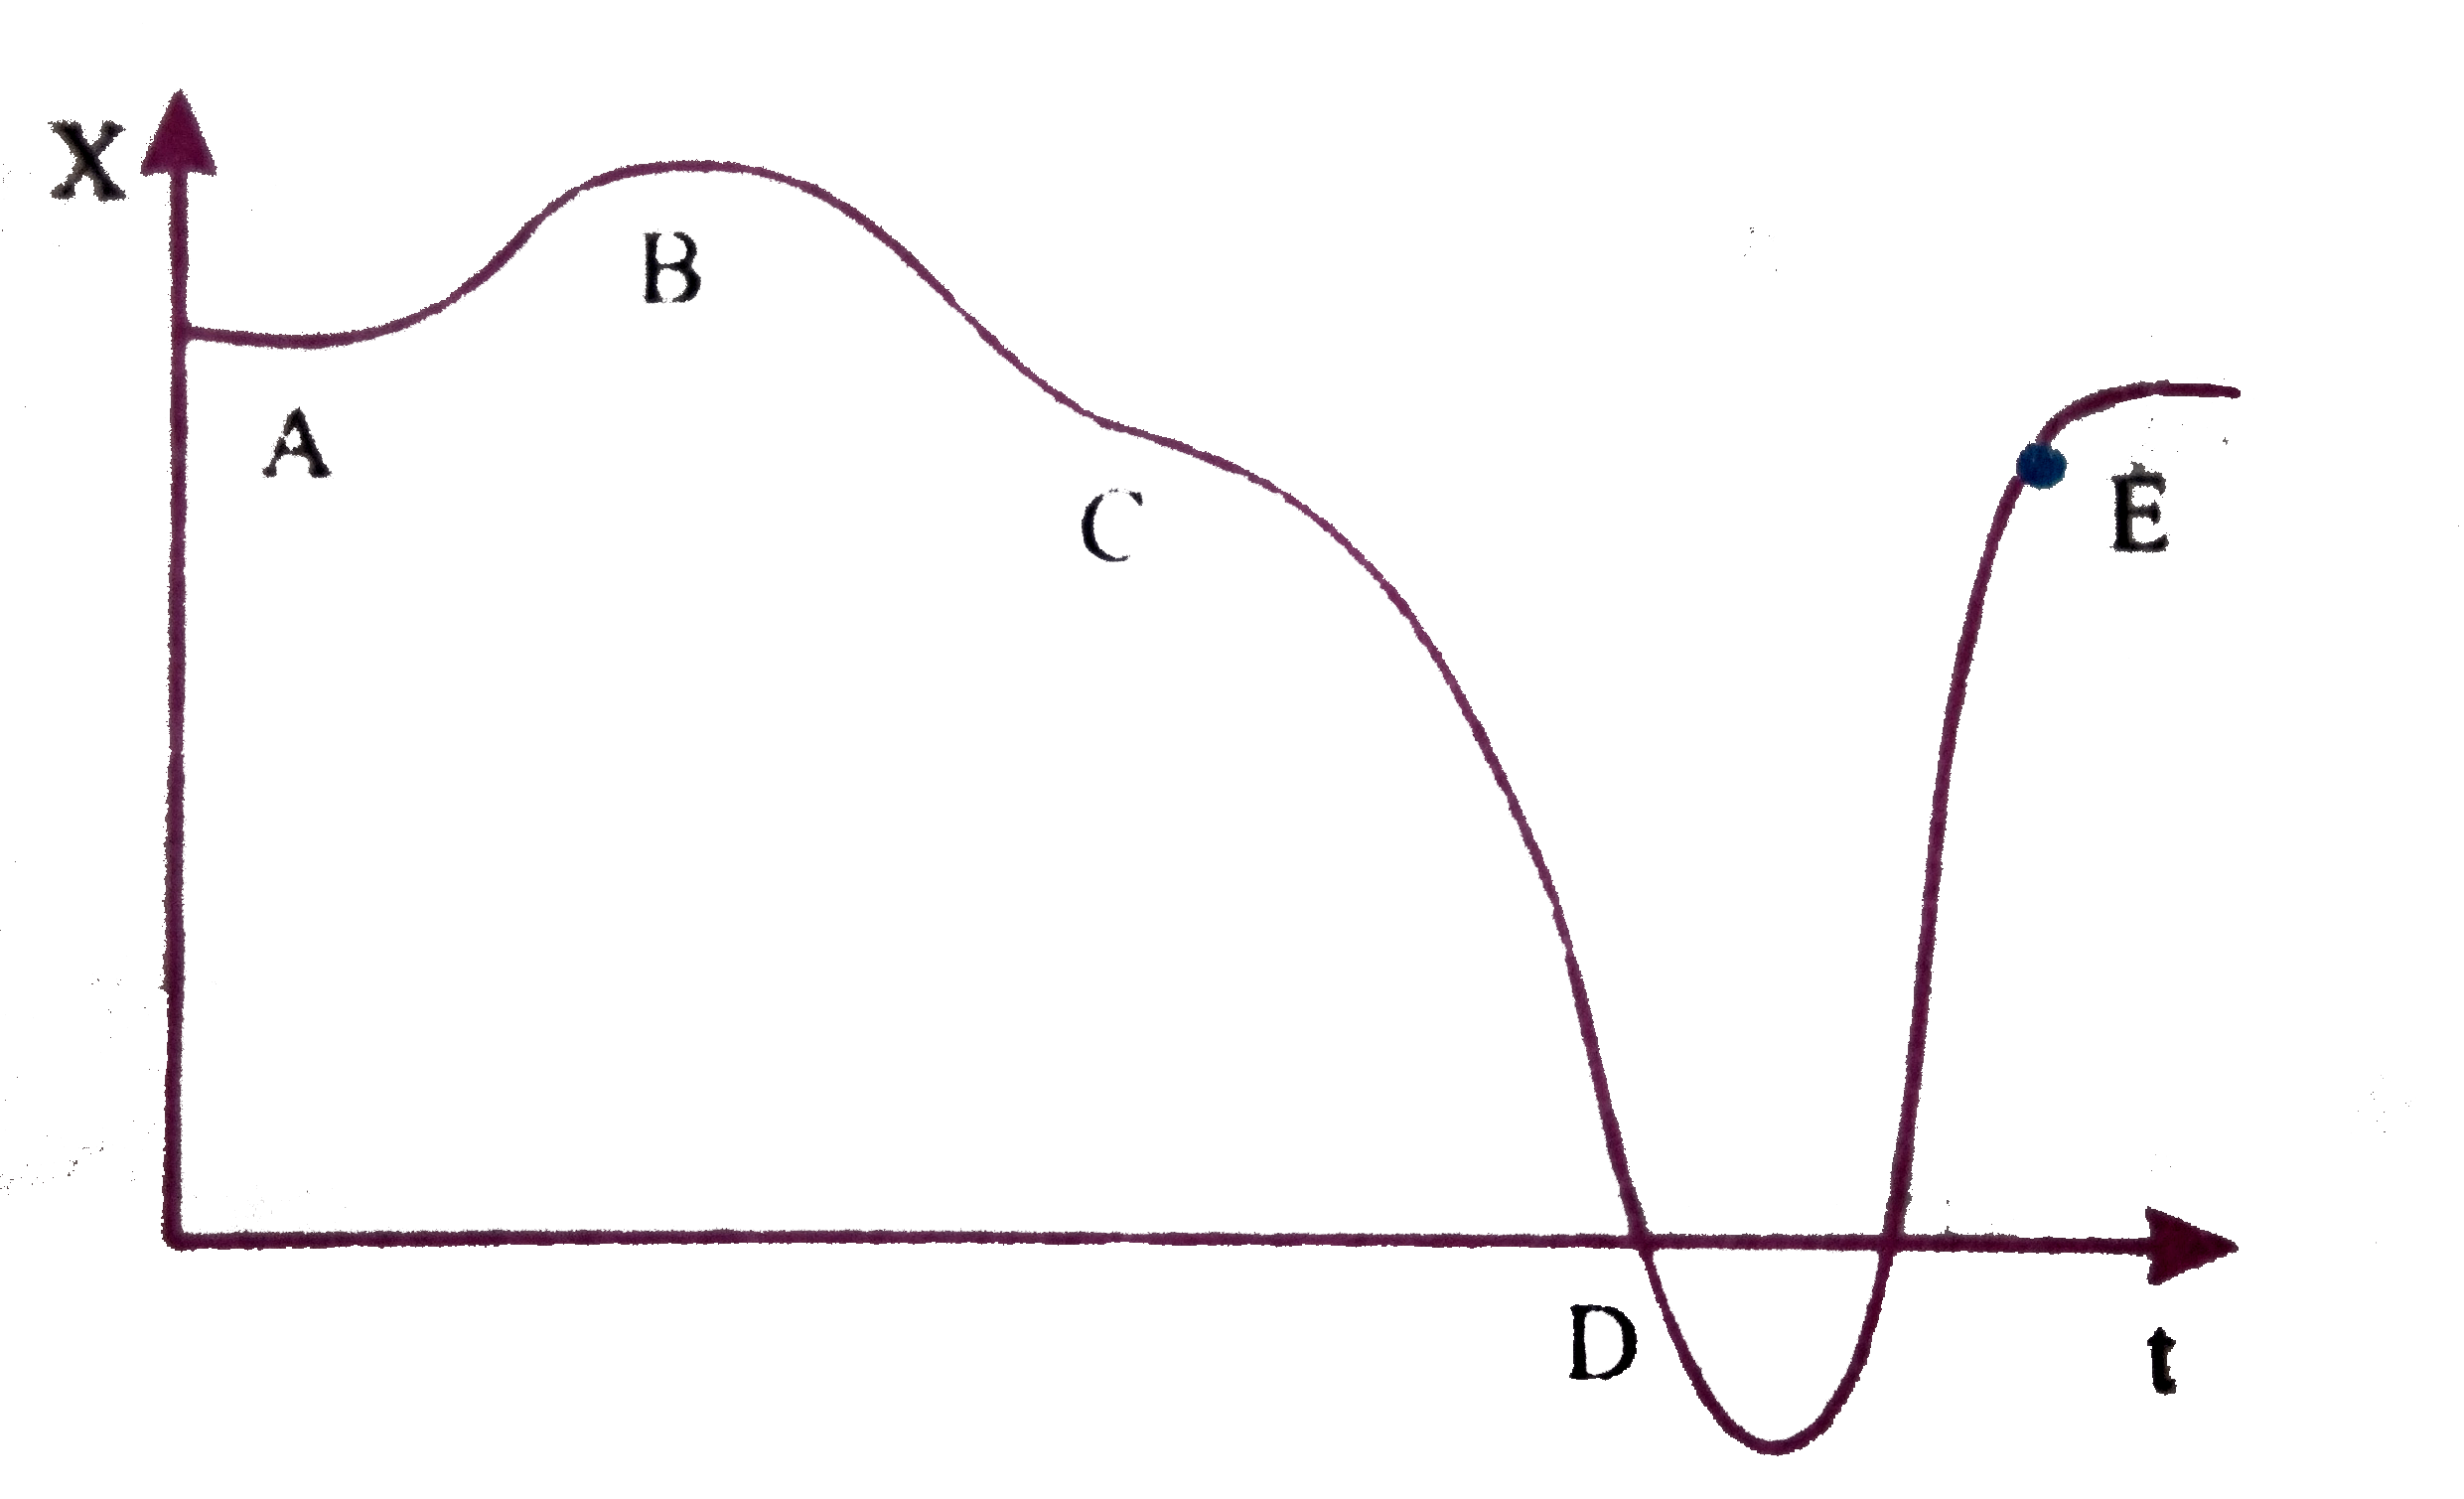
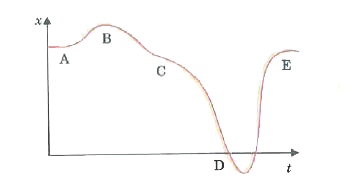
A graph of x versus t is shown in figure. Choose correct alternative from below.AThe particle was released from rest at t=0BAt B, the accleration a>0CAverage velocity for the motion between A and D is positive.DThe speed at D exceeds that at E.Pressure versus temperature graph of an ideal gas of equal number of moles of different volumes is plotted as shown in figure. Choose the correct alternatives.
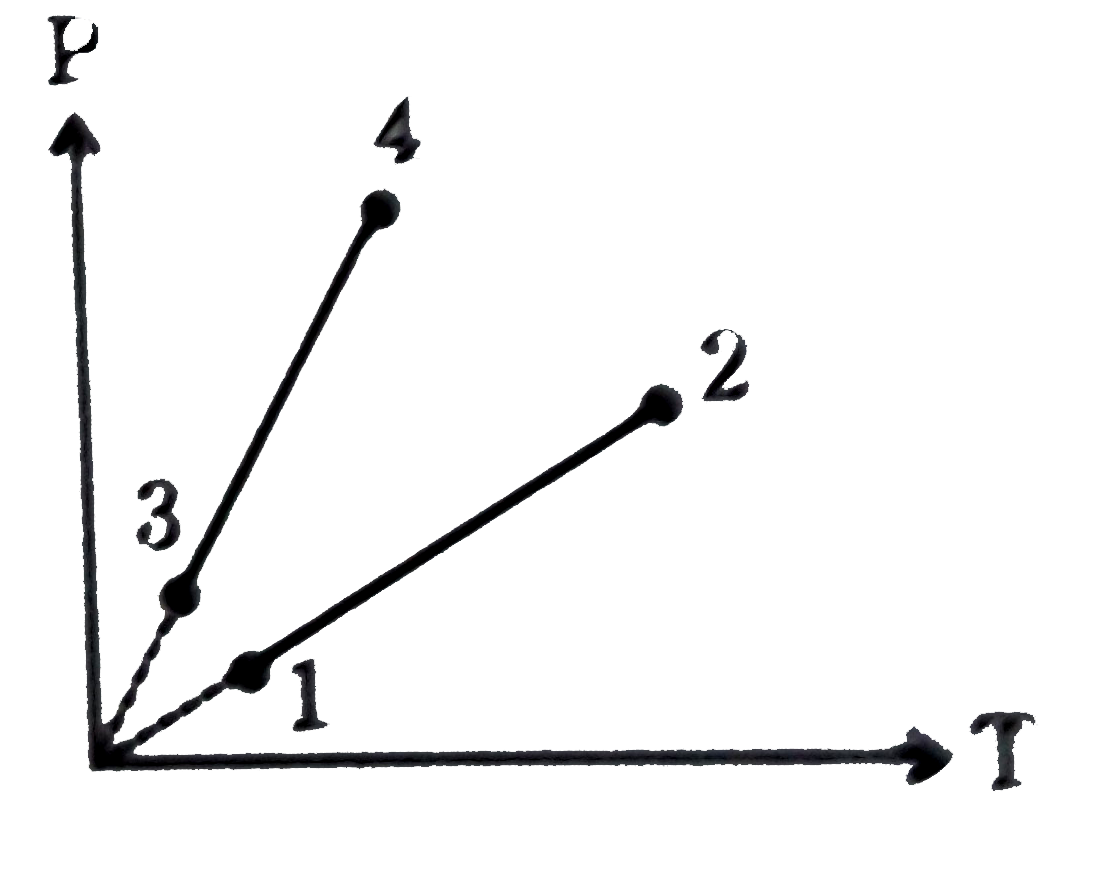 AV1=V2,V3=V4 and V2>V3BV1=V2,V3=V4 and V2<V3CV1=V2=V3=V4DV4>V3>V2>V1
A particle is moving in such a way that its velocity versus time graph is a parabola (t=kv2,k is constant) as shown in the figure. Choose the correct option(s)
 Aacceleration of the particle is √3m/s2 throughout the journeyBaverage acceleration of particle is 1m/s2 for the interval of first 5 secCaverage acceleration of particle is less than √3m/s2 for the interval of first 5 secDaverage acceleration of particle is less than 1m/s2 for the interval of 5 sec to 10 sec
Volume versus temperature (V-T) graph of an ideal gas of equal number of moles is plotted as shown in the figure. Choose the correct alternative.
View SolutionPressure versus temperature graph of an ideal gas of equal number of moles of different volumes is plotted as shown in Fig. Choose the correct alternative.
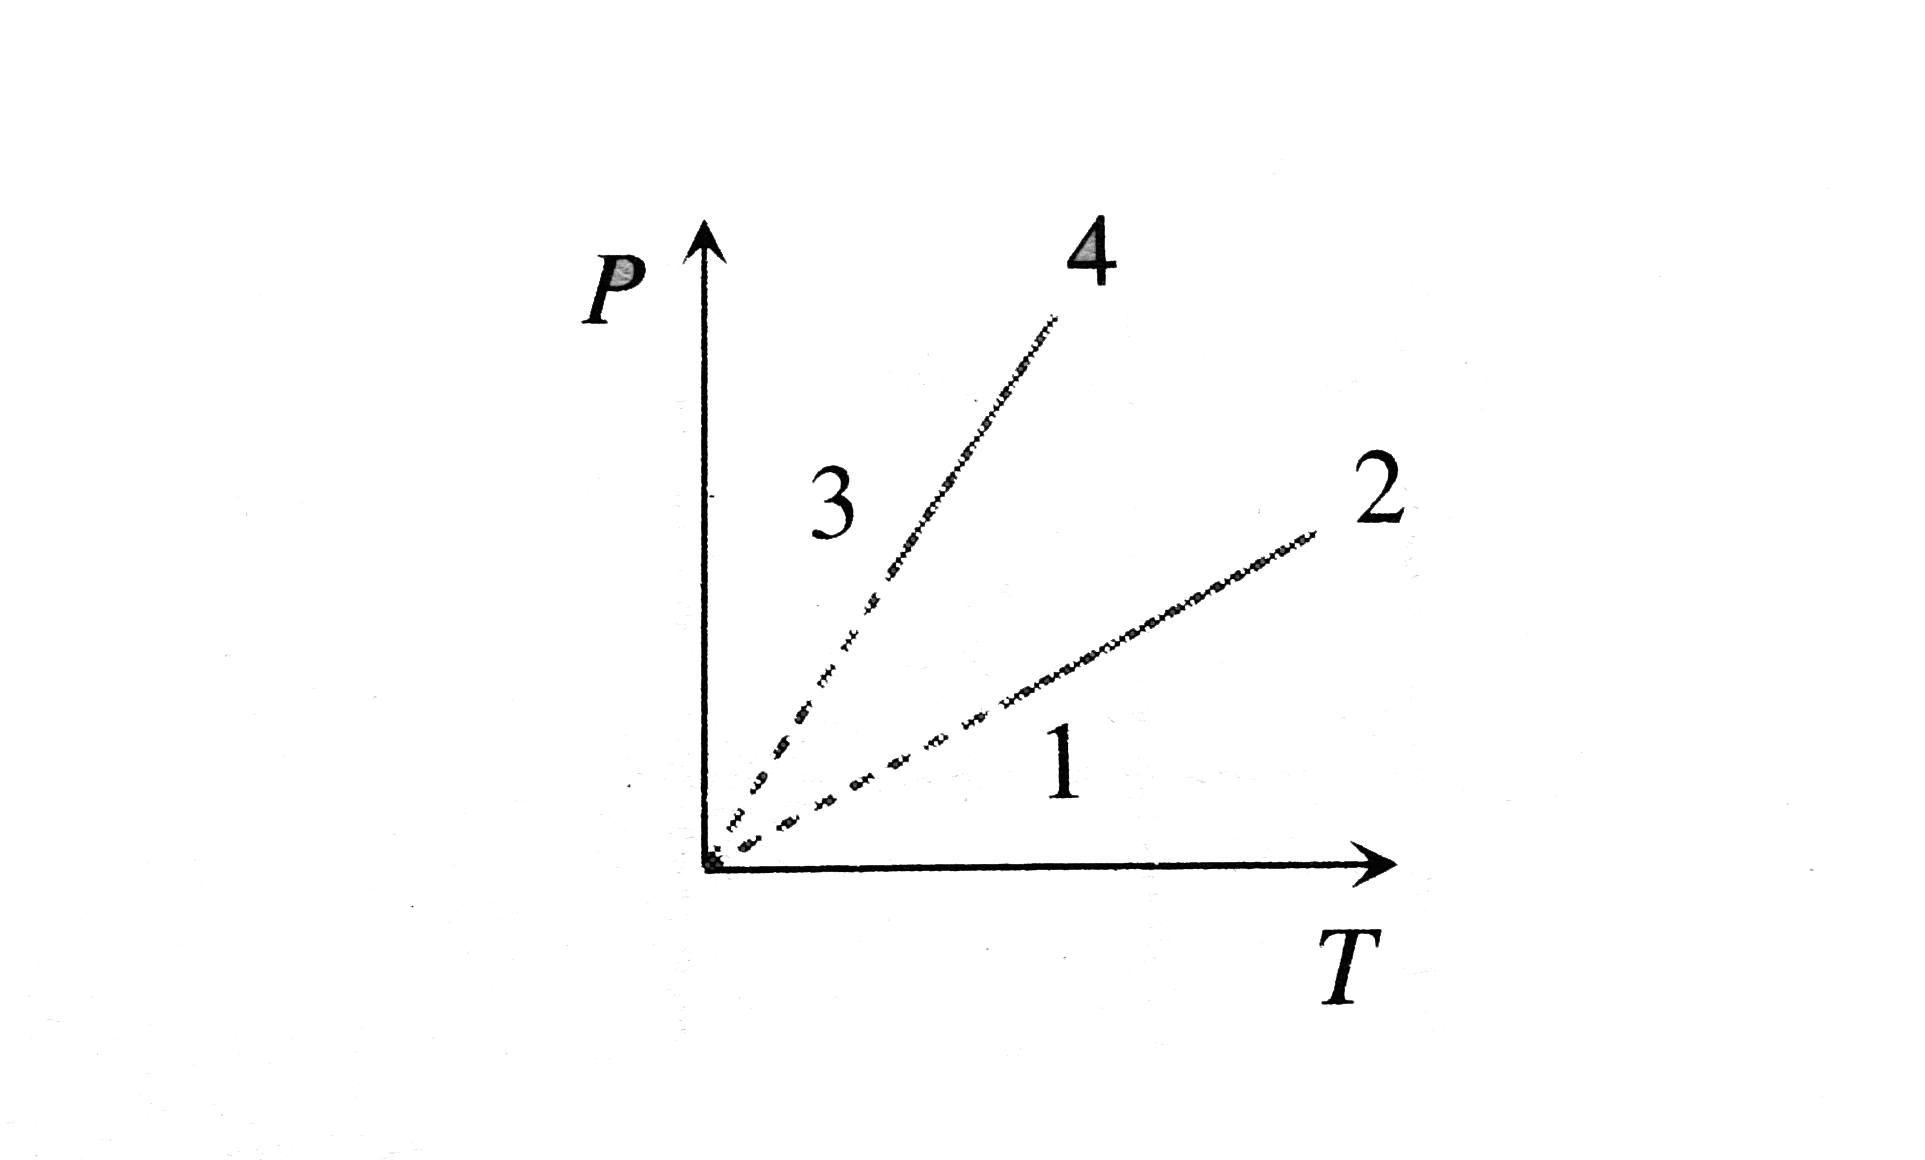
View SolutionPressure versus temperature graph of an ideal gas of equal number of moles of different volumes is plotted as shown in Fig. Choose the correct alternative.

View SolutionPressure versus temperature graph of an ideal gas of equal number of moles of different volumes is plotted as shown in Fig. Choose the correct alternative.

View SolutionA graph of x verus t is shown in the figure given below. Choose correct alternatives from below.
View Solution

