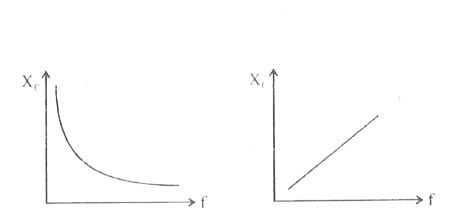
Draw the graph showing the variation of reactance of (a) C and (b) L with frequency v of an A.C circuit.Solution in Tamil
a. XC=12πvC
b. XL=2πvL
∴XC=∝1v XC∝v

Topper's Solved these Questions
- ALTERNATING CURRENT BOOK - NEW JOYTHI PUBLICATIONCHAPTER - ALTERNATING CURRENT EXERCISE - CONTINUOUS EVALUATION (PROJECT)
1 Videos
- ALTERNATING CURRENT BOOK - NEW JOYTHI PUBLICATIONCHAPTER - ALTERNATING CURRENT EXERCISE - CONTINUOUS EVALUATION ( ASSIGNMENT)
5 Videos
- ALTERNATING CURRENT BOOK - NEW JOYTHI PUBLICATIONCHAPTER - ALTERNATING CURRENT EXERCISE - PRACTICE PROBLEMS FOR SELF ASSESSMENT
11 Videos
- ATOMSBOOK - NEW JOYTHI PUBLICATIONCHAPTER - ATOMSEXERCISE - COMPETITIVE EXAM CORNER
5 Videos
Similar Questions
Design of a transformer for producing separate secondary voltages from A.C main input.
View SolutionExplain the mechanism of generation and transmission of electricity.
View SolutionAn electric lamp runs at 120 V d.c and consumes 12 A. It is connected to 200 V, 50 Hz a.c. Find the inductance required and the power factor.
View SolutionThe set which represents the isotope , isobar, isotone respectively is
View SolutionA .C स्त्रोत की आवृत्ति में परिवर्तन के साथ संधारित्र प्रतिघात में विचरण को दर्शाने के लिए ग्राफ खीचिए ।
View SolutionThe figure shows the graphical variation of the reactance of a capacitor with frequency of ac source. (a) find the capacitance of the capacitor (b)an ideal inductor has the same reactance at 100 Hz frequency as the capacitor has the same frequency find the value of the inductor. (c) draw the graph showing the variation of the reactance of this inductor with frequency
View SolutionDraw a graph showing the variation of reactance of (i) a capacitor and (ii) an inductor with the frequency of an a.c circuit.
View SolutionIn a series L–C–R circuit XL,XCandR are the inductive reactance, capacitive reactance and resistance respectively at a certain frequency f. If the frequency of a.c. is doubled, what will be the values of reactances and resistance of the circuit?
View Solutionप्रत्यावर्ती धारा परिपथ में आवृति के साथ प्रतिघात के परिवर्तन को प्रदर्शित करने वाला ग्राफ खींचिए (A) प्रेरकत्व के लिए (b) संधारित्र के लिए ।
View SolutionThe figure shows the graphical variation of the reactance of a capacitor with frequency of ac source. (a) find the capacitance of the capacitor (b)an ideal inductor has the same reactance at 100 Hz frequency as the capacitor has the same frequency find the value of the inductor. (c) draw the graph showing the variation of the reactance of this inductor with frequency
View SolutionSketch a graph showing the variation of capacitive reactance with the change in frequency of the a.c. source.
View Solution(i) Draw the graphs showing variation of inductive reactance and capacitive reactance with frequency of applied a.c. source.
(ii) Can the voltage drop across the inductor or the capacitor in a series LCR circuit be greater than the applied voltage of the a.c. source ? Justify your answer.
View SolutionIf angular frequency of an A.C. source used in L-C-R circuit is decreased, then inductive reactance ....... and capacitive reactance......
View SolutionIf angular frequency of an A.C. source used in L-C-R circuit is increased, then inductive reactance ….... and capacitive reactance.....
View SolutionDraw a labelled graph showing the variation of inductive reactance (X_(L)) verses frequency (f)
View Solution
