The bar graph shown below reveals the data about the no. of students in different disciplines of MBA at a prominent Business School in India.
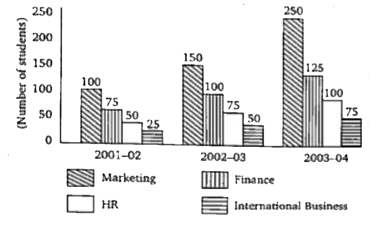
The growth rate of Finance compares to that of marketing is :
less
equal
greater
none of these
The correct Answer is:A
Step by step video, text & image solution for The bar graph shown below reveals the data about the no. of students in different disciplines of MBA at a prominent Business School in India. The growth rate of Finance compares to that of marketing is : by Maths experts to help you in doubts & scoring excellent marks in Class 14 exams.
Updated on:21/07/2023Topper's Solved these Questions
- PERCENTAGESBook:ARIHANT SSCChapter:PERCENTAGESExercise:Exercise (Level - 2)
Explore 50 Videos
- PERCENTAGEBook:ARIHANT SSCChapter:PERCENTAGEExercise:Higher Skill Level Questions
Explore 27 Videos
- PERMUTATIONS & COMBINATIONS Book:ARIHANT SSCChapter:PERMUTATIONS & COMBINATIONS Exercise:FINAL ROUND
Explore 38 Videos
Similar Questions
70 students from a locality use different modes of transport to go to school as given below:

Draw the bar graph representing the above data.
View Solution70 students from a locality use different modes of transport to go to school as given below:
 Draw the bar graph representing the above data.
View Solution
Knowledge Check
The bar graph shown below reveals the data about the no. of students in different disciplines of MBA at a prominent Business School in India.
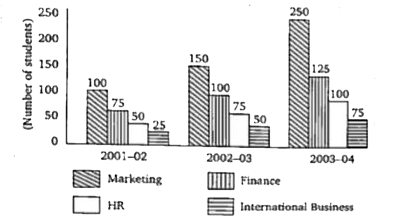
In the session of 2002-03 what percentage of MBA students are studying International Business ?A0.1333B0.25C0.0666D0.24The bar graph shown below reveals the data about the no. of students in different disciplines of MBA at a prominent Business School in India.
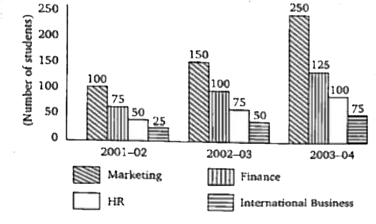
Total no. of MBA students in the session of 2004-05 if the no. of students in 2004-2005 is increasing by 9.09% over the previous year :A555B600C777Dnone of these
Study the double bar graph shown below and answer the questions that follow:
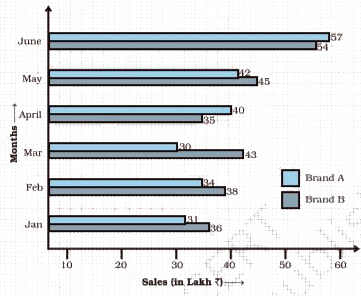
(a) What information is represented by the above double bar graph?
(b) In which month sales of Brand A decreased as compared to the previous month?
(c) What is the difference in sales of both the Brands for the month of June?
(d) Find the average sales of Brand B for the six months.
(e) List all months for which the sales of Brand B was less than that of Brand A.
(f) Find the ratio of sales of Brand A as compared to Brand B for the month of January.
View SolutionGiven below is the data of school going students (boys and girls):

Draw the bar graph to represent the above data.
View SolutionThe following bar graph represents the data for different sizes of shoes worn by the students in a school. Read the graph and answer the following questions.
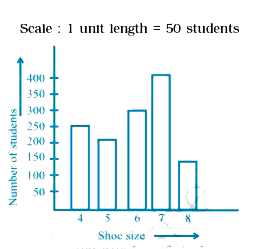
What is the number of students wearing shoe size 6?
View SolutionAnswer the questions based on the information given below:
The given cascade bar graph provides the information about the number of girls and boys participated in a dance competition of NH Goel school on five different days of a week and the table give the details about the percentage of students participated on different days who lost the competition.
Total number of students participated in a day = Number of girls participated in a day + Number of boys participated in a day
Total number of students participated = Total number of students who lost the competition participated + Total number of students who won the competition participated
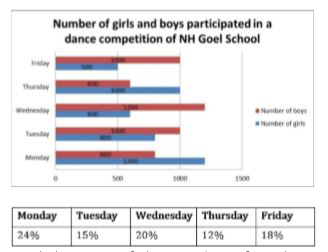
Find the ratio of the number of students who lost the competition on Tuesday to the number of students who won the competition on Wednesday.
View SolutionAnswer the questions based on the information given below:
The given cascade bar graph provides the information about the number of girls and boys participated in a dance competition of NH Goel school on five different days of a week and the table give the details about the percentage of students participated on different days who lost the competition.
Total number of students participated in a day = Number of girls participated in a day + Number of boys participated in a day
Total number of students participated = Total number of students who lost the competition participated + Total number of students who won the competition participated
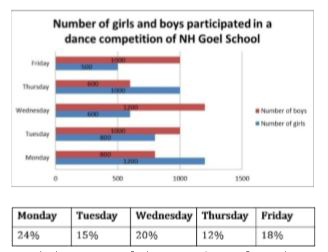
Find the ratio between the number of students who won on Wednesday to the number of students who won on Thursday
View SolutionAnswer the questions based on the information given below:
The given cascade bar graph provides the information about the number of girls and boys participated in a dance competition of NH Goel school on five different days of a week and the table give the details about the percentage of students participated on different days who lost the competition.
Total number of students participated in a day = Number of girls participated in a day + Number of boys participated in a day
Total number of students participated = Total number of students who lost the competition participated + Total number of students who won the competition participated
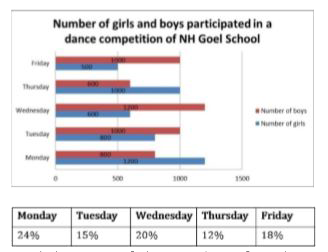
If the ratio of number of girls lost to the number of boys lost on Thursday is 7: 5 respectively, then the number of girls lost on Thursday was what percentage of the number of boys participated on Monday?
View Solution