Water in a lake starts freezing if temperature of surrounding is −20∘C. The graph between thickness of ice y and time is plotted. Which of the following graph correctly represents this situation?
A

B

C

D

Text Solution
The correct Answer is:D
|
Topper's Solved these Questions
- PHYSICS PART2BOOK - FIITJEECHAPTER - PHYSICS PART2EXERCISE - MCQ
21 Videos
- PHYSICS PART2BOOK - FIITJEECHAPTER - PHYSICS PART2EXERCISE - Assertion-Reasoning MCQ
12 Videos
- PHYSICS PART2BOOK - FIITJEECHAPTER - PHYSICS PART2EXERCISE - Section (I) : Subjective
4 Videos
- PHYSICS PART-IIIBOOK - FIITJEECHAPTER - PHYSICS PART-IIIEXERCISE - NUMERICAL BASED QUESTIONS DECIMAL TYPE
11 Videos
- ROTATIONAL MECHANICSBOOK - FIITJEECHAPTER - ROTATIONAL MECHANICSEXERCISE - COMPREHENSION - IV
2 Videos
Similar Questions
Knowledge Check
Which of the following graph is correctly represented?
A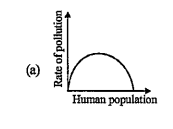 B
B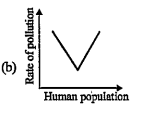 C
C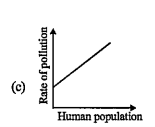 D
D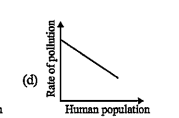
'These days prices have started rising.'' Which amongst the following graphs represents this situation?
A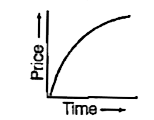 B
B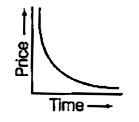 C
C D
D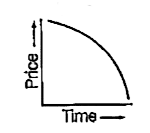
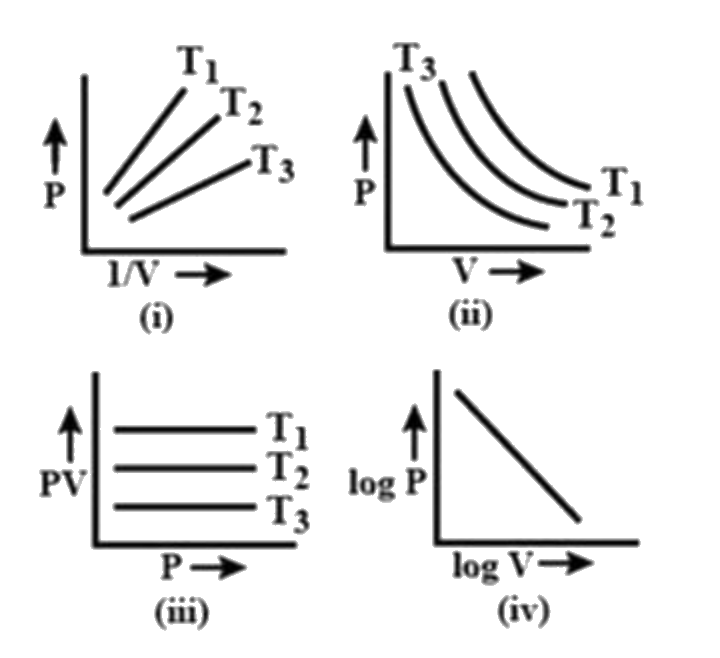
which of the following graphs represents Charles' law correctly ?
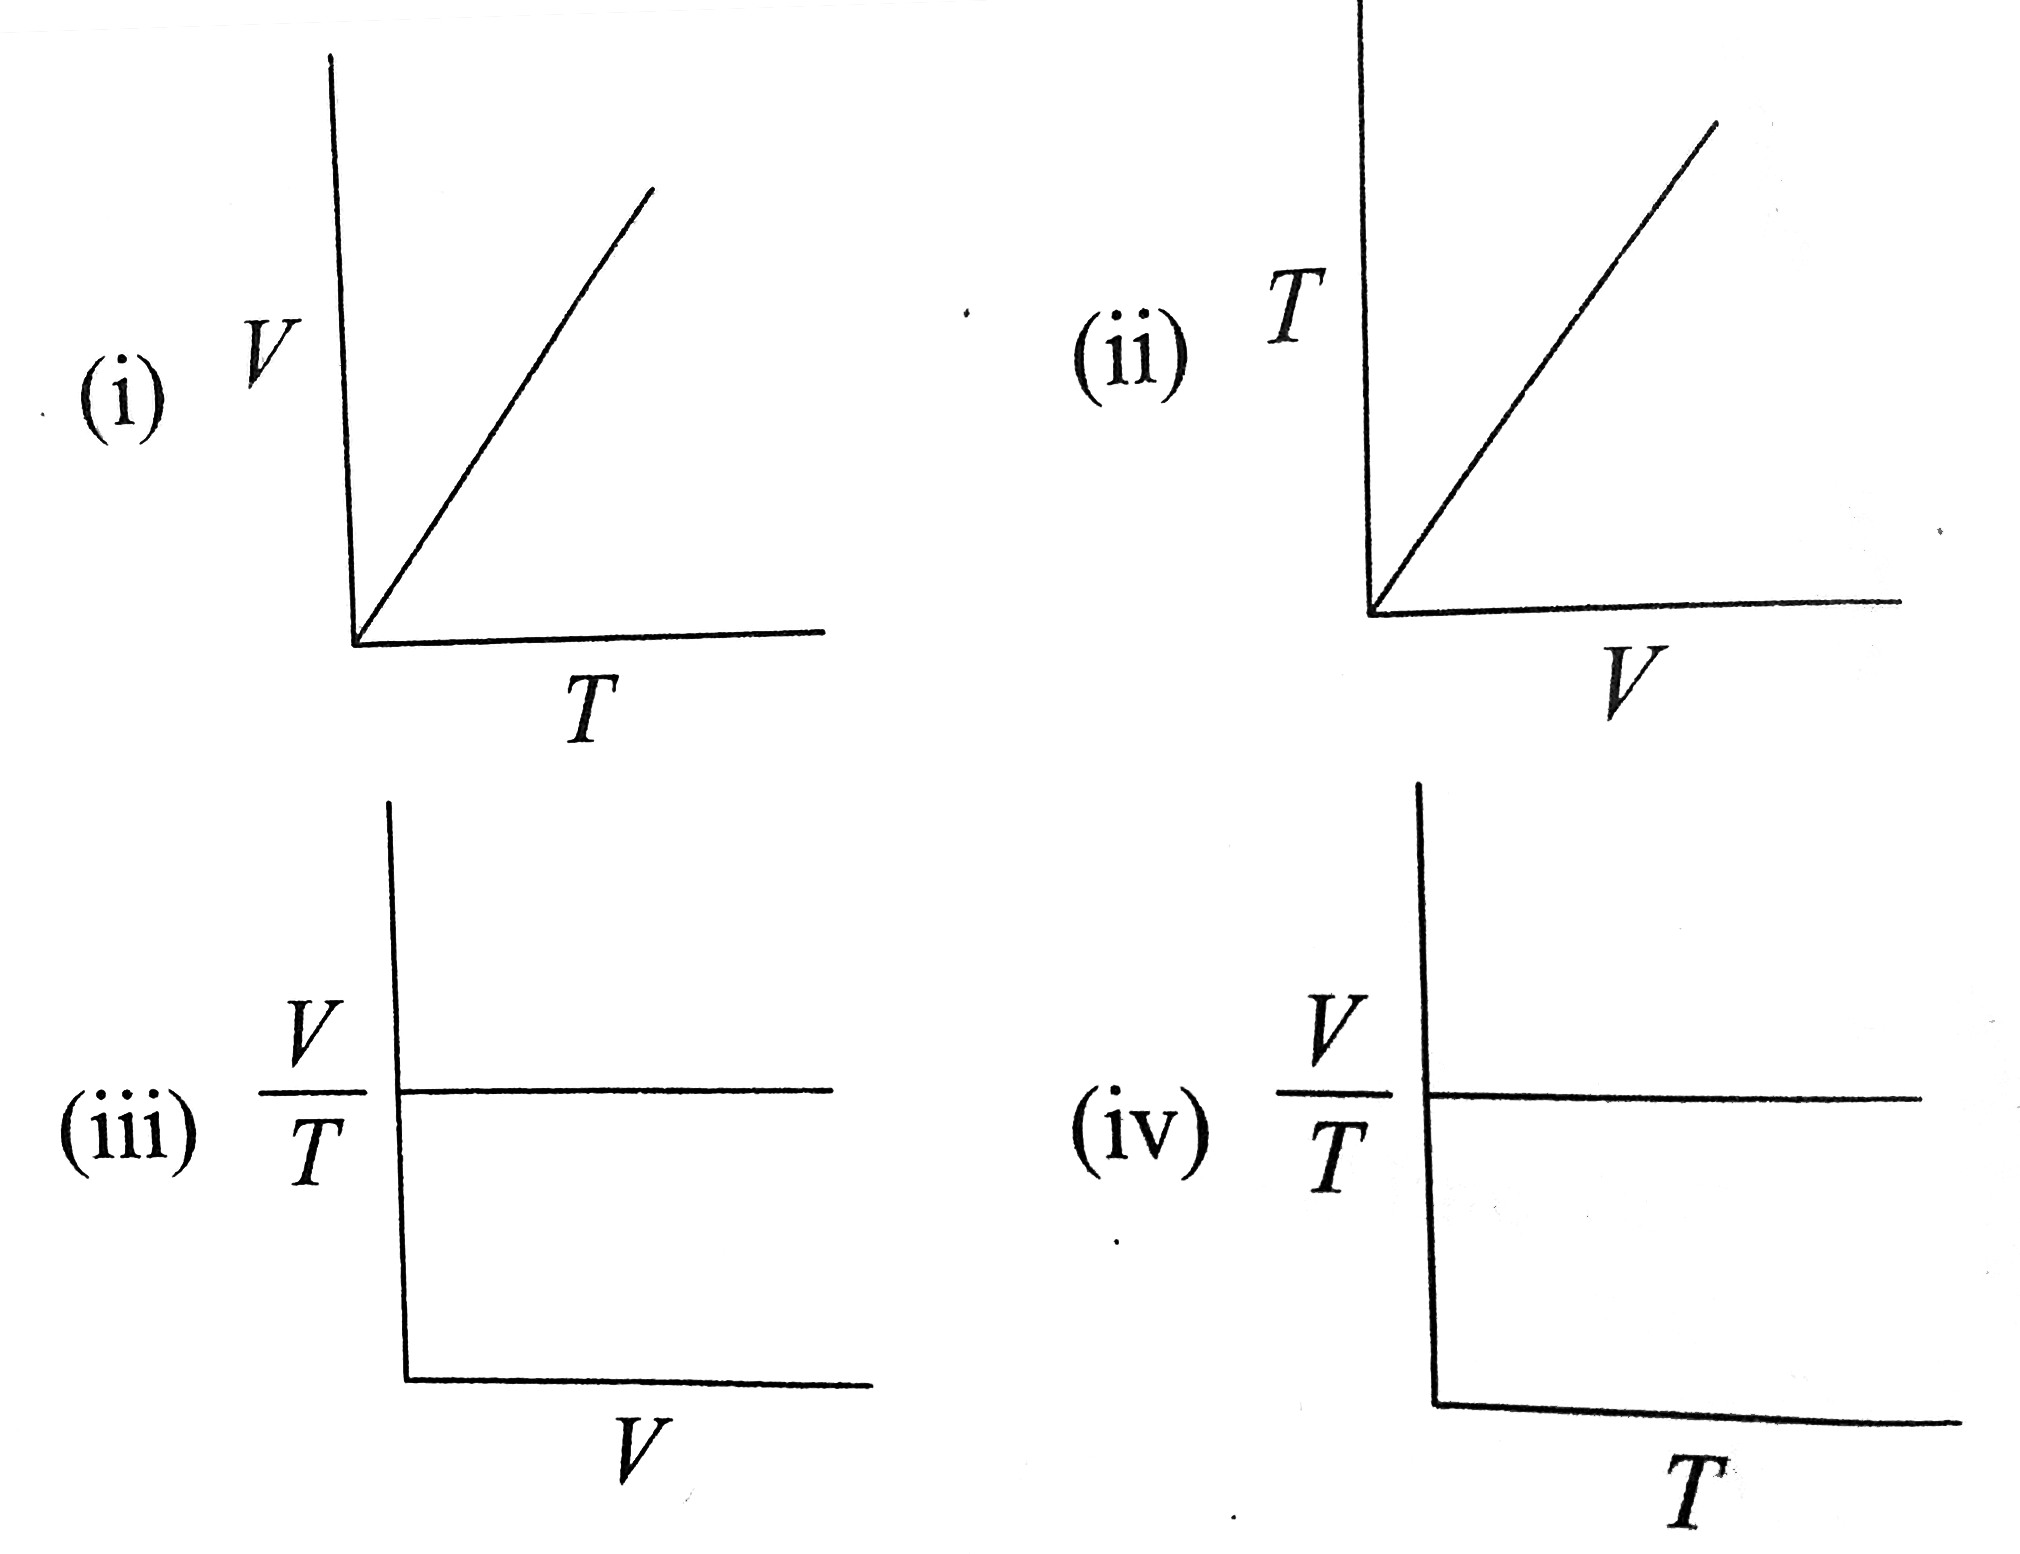 A(i),(iii)B(ii),(iv)C(i),(ii),(iii),(iv)D(iii),(iv)
Which of the following graphs represents Boyle's law correctly?
(i)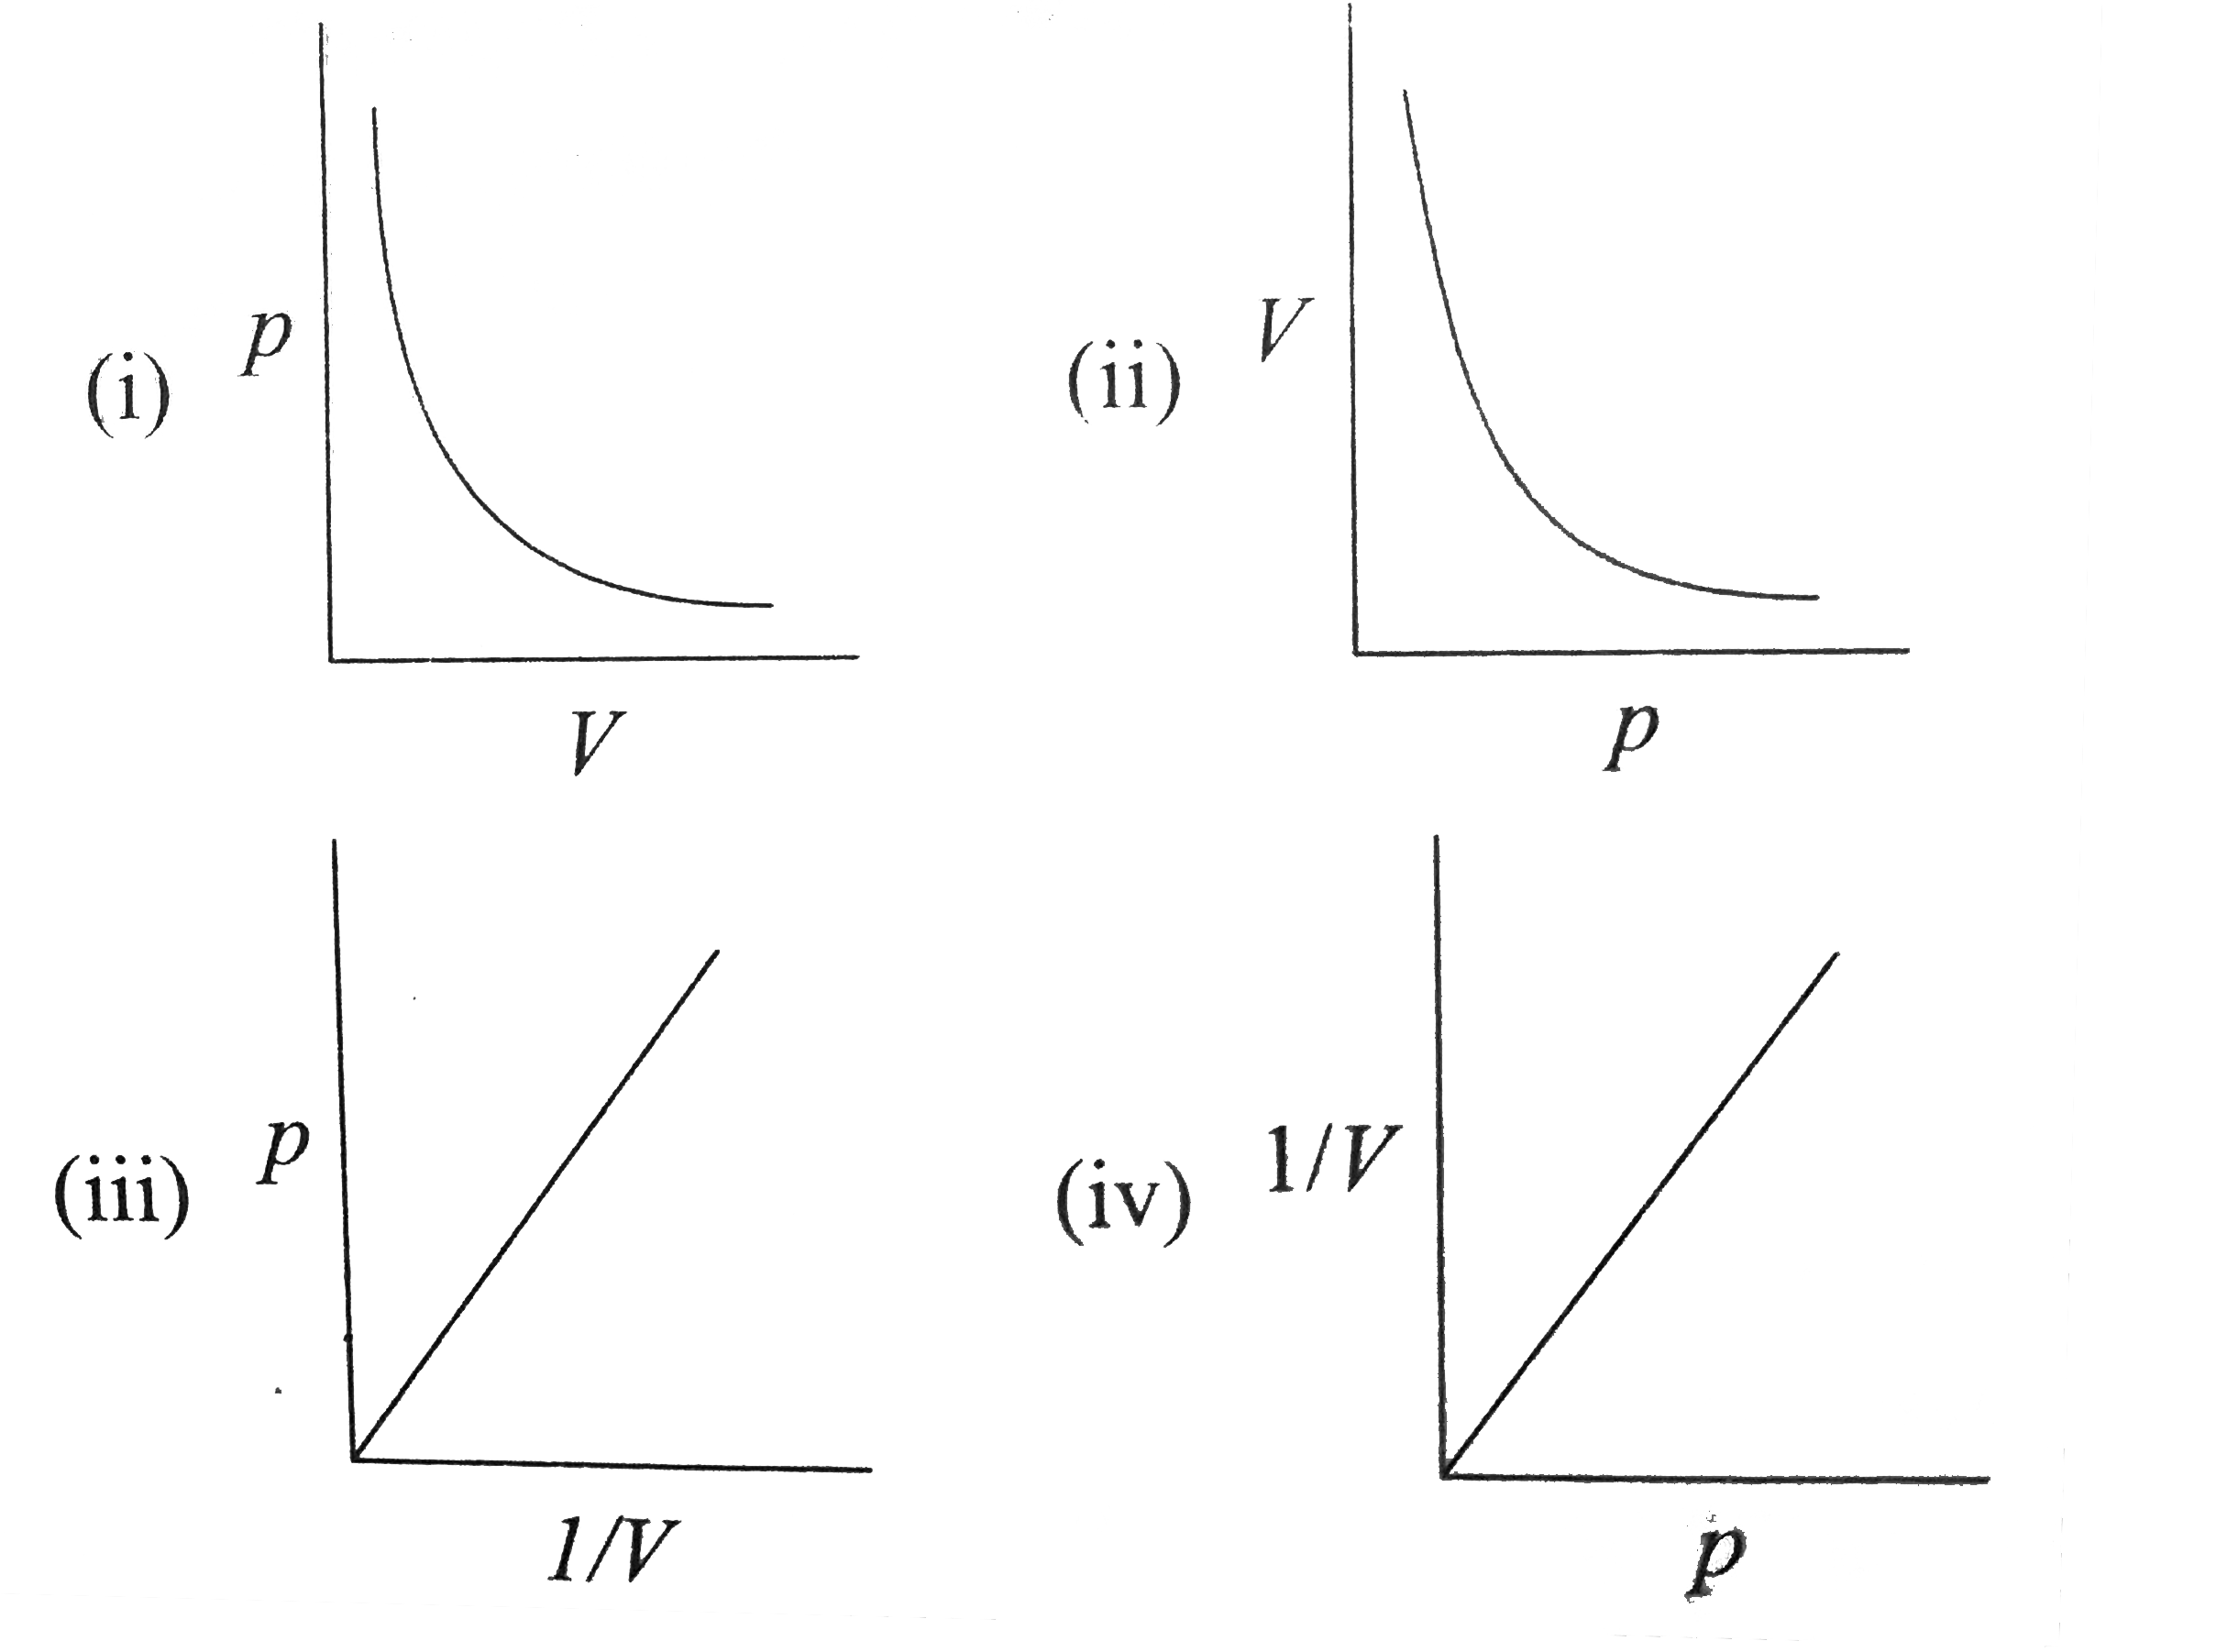
View SolutionWhich of the following graphs represents freundlich adsorption isotherm?
View SolutionThe velocity -displacement graph of a particle is as shown in the figure. Which of the following graphs correctly represents the variation of acceleration with displacement?

View SolutionThe velocity -displacement graph of a particle is as shown in the figure. Which of the following graphs correctly represents the variation of acceleration with displacement?

View Solution100 g of ice at −15∘C was heated. The rise in temperature of ice was plotted against the heat given to ice. Which of the following graphs (Fig. 6.2) correctly depicts this behaviour?
View Solution

