The two I-H graphs A and B in the adjacent figure are for .
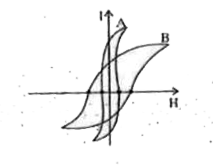
a paramagnetic and a ferromagnetic substance, respectively
a diamagnetic and a paramagnetic substance, respectively
steel and soft iron, respectively
soft iron and steel, respectively
The correct Answer is:D
Topper's Solved these Questions
- MAGNETISM AND MATTERBOOK - FIITJEECHAPTER - MAGNETISM AND MATTEREXERCISE - ASSIGNMENT PROBLEMS OBJECTIVE : (LEVEL -II) (MULTI CHOICE SINGLE CORRECT)
20 Videos
- MAGNETISM AND MATTERBOOK - FIITJEECHAPTER - MAGNETISM AND MATTEREXERCISE - ASSIGNMENT PROBLEMS (SUBJECTIVE ) (LEVEL -1)
18 Videos
- MAGNETISMBOOK - FIITJEECHAPTER - MAGNETISMEXERCISE - Example
12 Videos
- MODERN PHYSICSBOOK - FIITJEECHAPTER - MODERN PHYSICSEXERCISE - Numerical based questions
5 Videos
Similar Questions
Knowledge Check
In the circuit shown in the adjacent figure
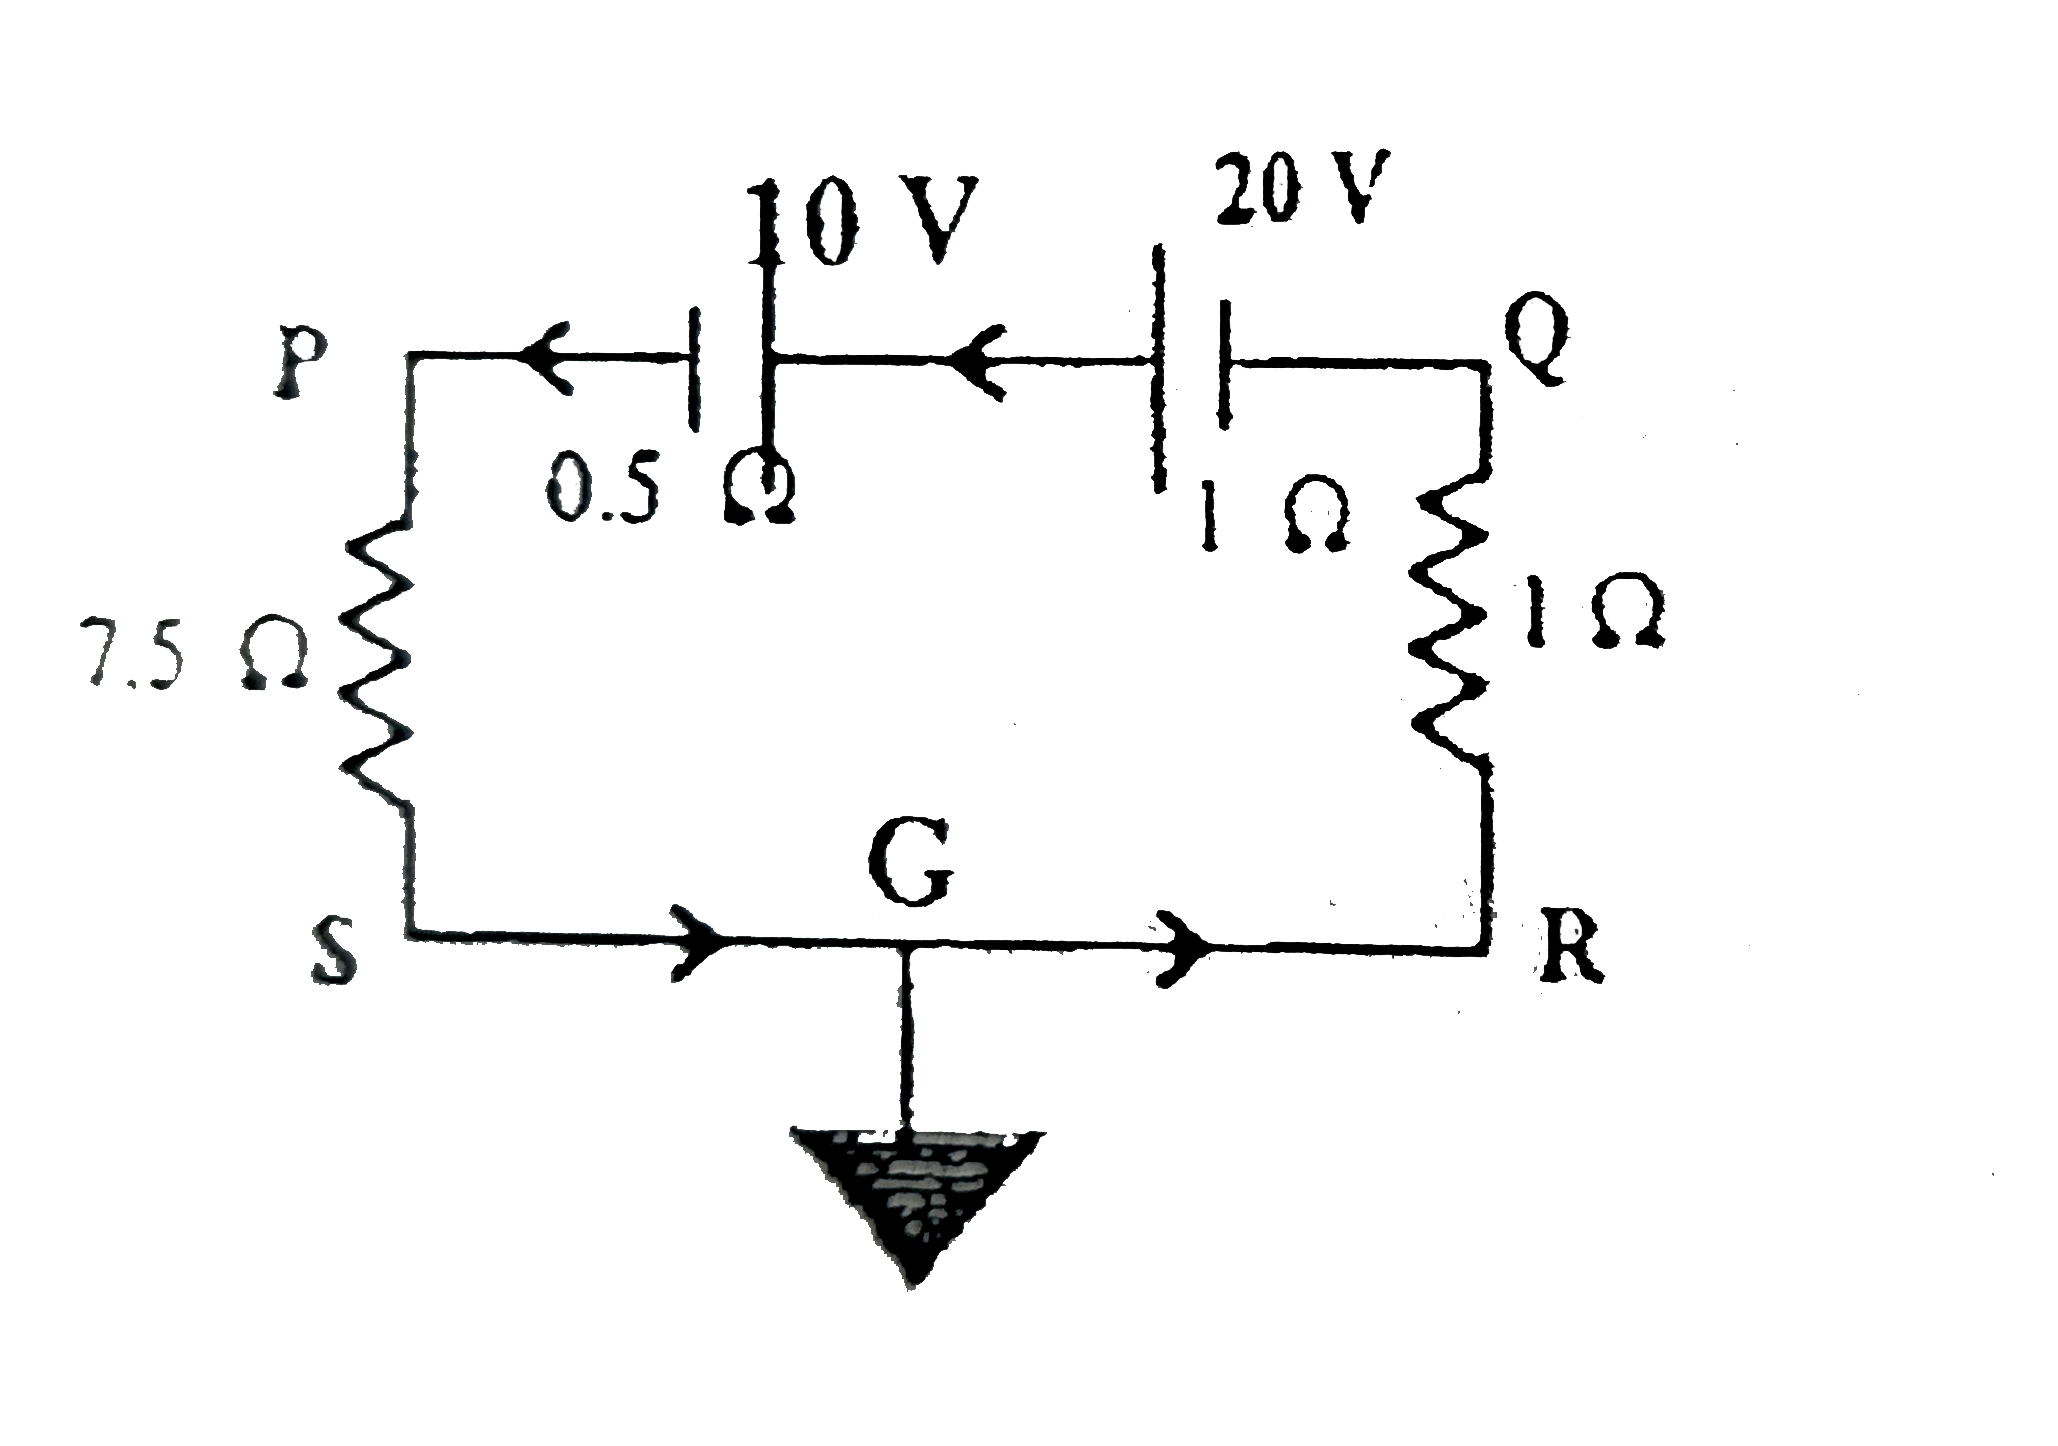 Athe potential at P is −7.5VBthe potential at Q is −1VCthe potential at R is zeroDthe potential at S is zero
Which graph approximately shows the plot of magnetic field (B) with x between two current carrying conductors (as shown in the adjacent figure) if one of the conductors is at origin and they are separated by a distance d.
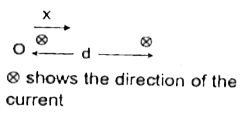 A
A B
B C
C D
D
State with reasons why the graph in the adjacent figure cannot represent one-dimensional motion of a particle.
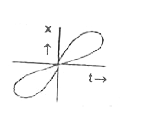
View SolutionState with reasons why the graph in the adjacent figure cannot represent one-dimensional motion of a particle.

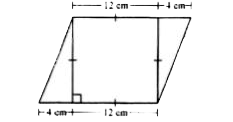
View SolutionThe area of adjacent figure is:
View SolutionThe graph of the function y=f(x) is shown in the adjacent figure then correct statement is
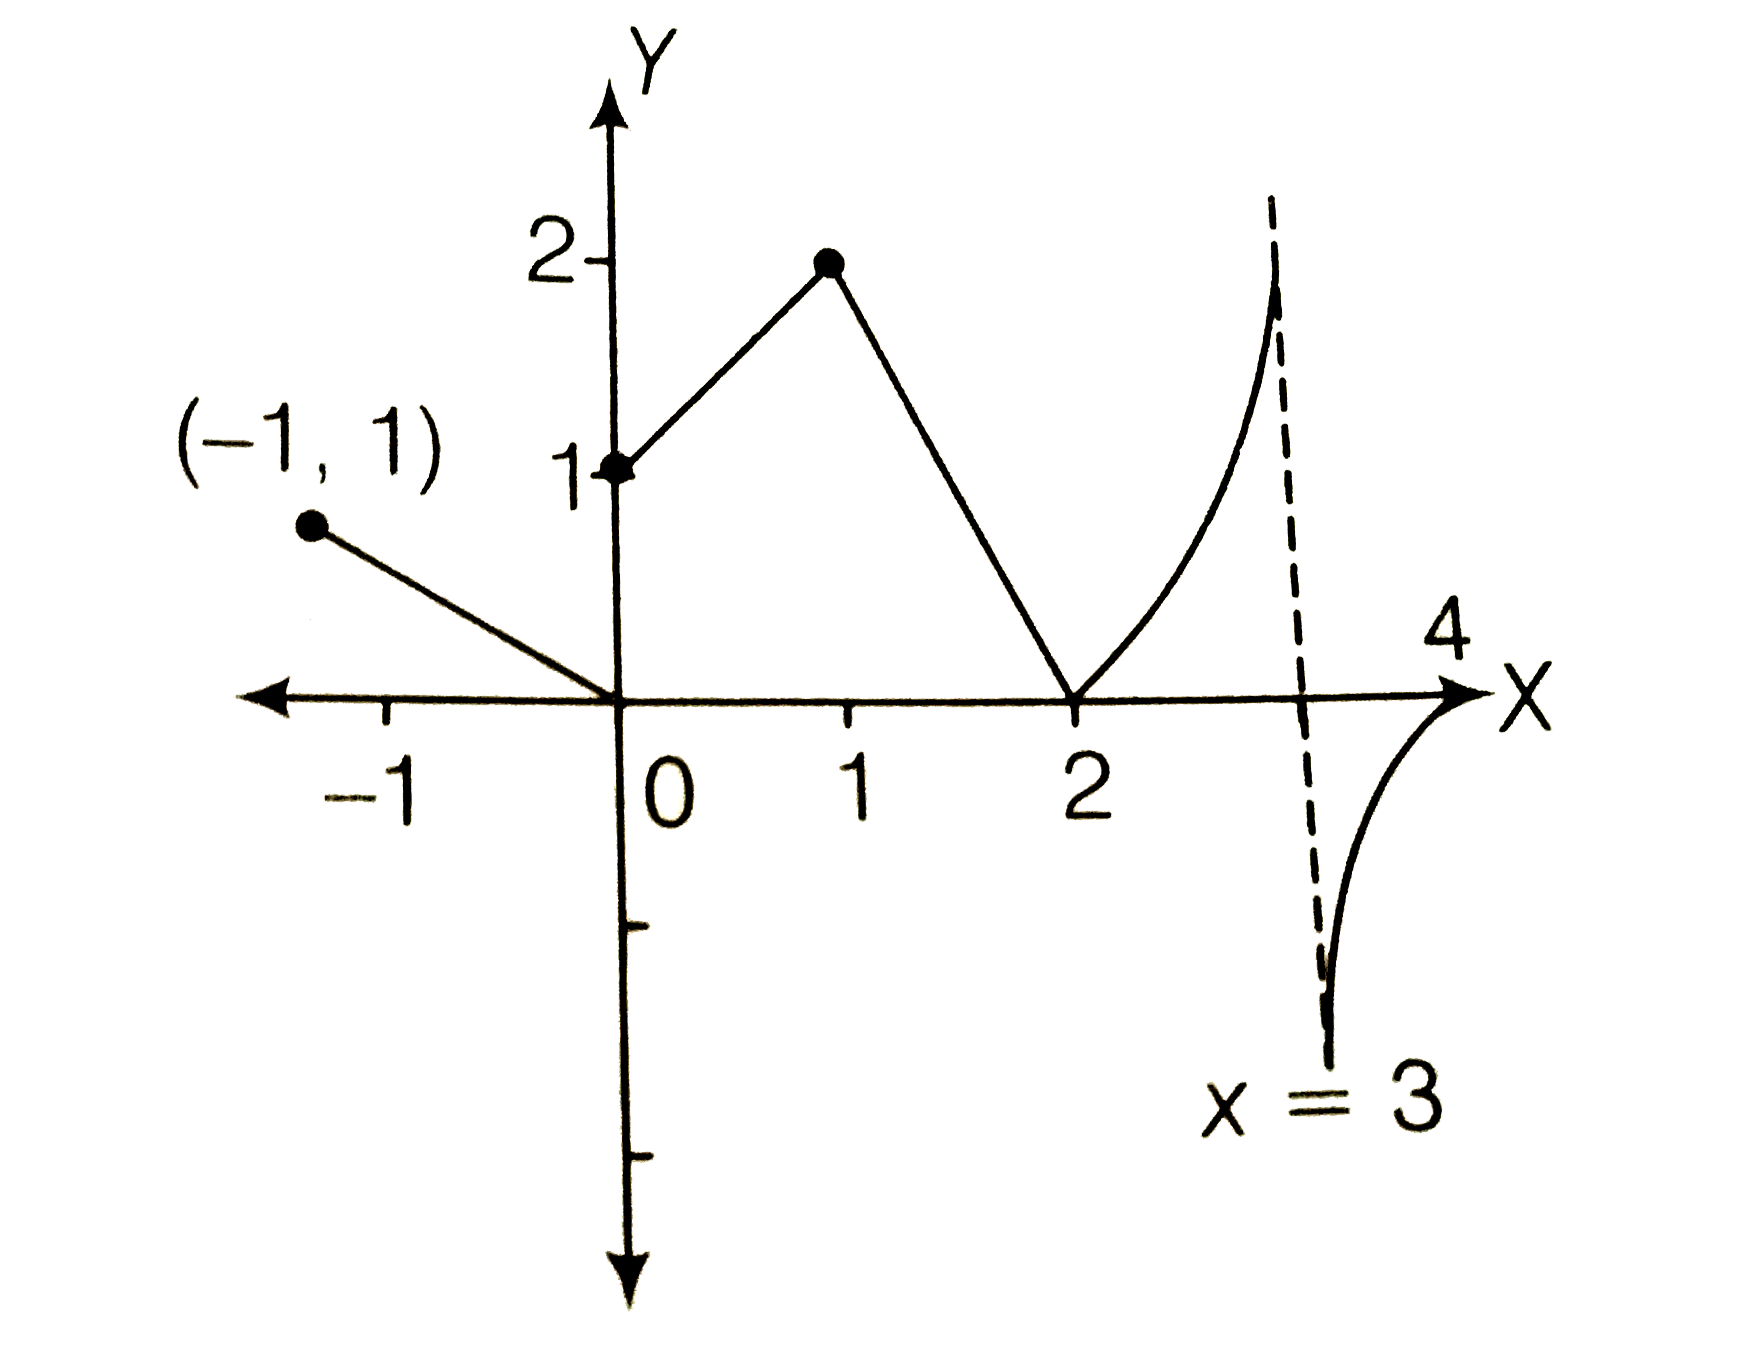
View SolutionThe graph of the function y=f(x) is shown in the adjacent figure then correct statement is

View SolutionWhich graph approximately shows the plot of magnetic field (B) with x between two current carrying conductors (as shown in the adjacent figure) if one of the conductors is at origin and they are separated by a distance d.

View Solution
