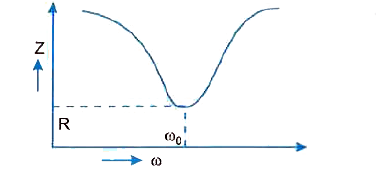
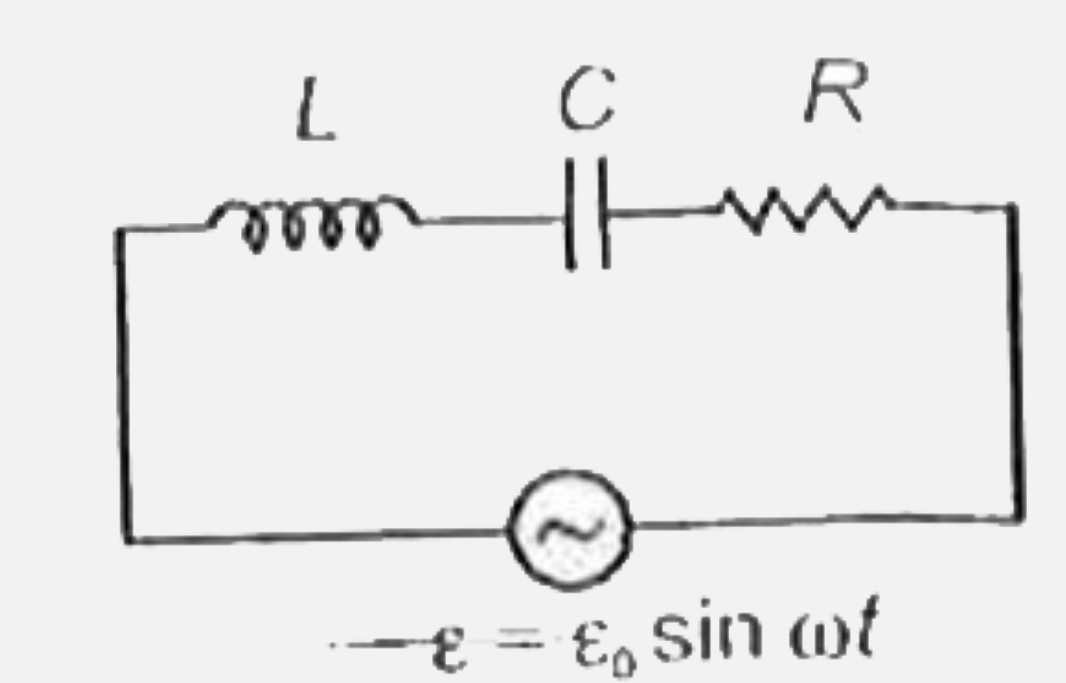
A series combination of an inductor (L), capacitor (C) and a resistor (R) is connected across an ac source of emf of peak value E0 and angular frequency (ω). Plot a graph to show variation of impedance of the circuit with angular frequency (ω).
Variation of impedance (Z) with angular frequency (ω) is plotted here.

Topper's Solved these Questions
- CBSE EXAMINATION PAPER 2020 (SOLVED)BOOK - U-LIKE SERIESCHAPTER - CBSE EXAMINATION PAPER 2020 (SOLVED)EXERCISE - SECTION B
10 Videos
- CBSE EXAMINATION PAPER 2020 (SOLVED)BOOK - U-LIKE SERIESCHAPTER - CBSE EXAMINATION PAPER 2020 (SOLVED)EXERCISE - SECTION C
11 Videos
- CBSE EXAMINATION PAPER 2020 BOOK - U-LIKE SERIESCHAPTER - CBSE EXAMINATION PAPER 2020 EXERCISE - SECTION D
12 Videos
- CBSE EXAMINATION PAPER 2020 (SOLVED) BOOK - U-LIKE SERIESCHAPTER - CBSE EXAMINATION PAPER 2020 (SOLVED) EXERCISE - SECTION - D
6 Videos
Similar Questions
A series LCR circuit consists of an inductor L a capacitor C and a resister R connected across a source of emfε=ε0sinωt. When ωL=1ωC the current in the circuit is l0 and if angular frequency of the source is changed to ω, the current in the circuit becoms (l02 then the value of ∣∣∣ω'L−1ω'C∣∣∣ is

View SolutionFor an LCR series circuit with an ac source of angular frequency ω.
View Solution
Knowledge Check
An inductance L and capacitance C and resistance R are connected in series across an AC source of angular frequency ω. If ω2>1LC then
Aemf leads the currentBboth the emf and the current are in phaseCcurrent lead the emfDemf lags behind the currentAn inductor has a resistance R inductance L. It is connected to an A.C source of e.m.f. EV and angular frequency ω then the current Iv in the circuit is
AEVωLBEVRCEV√R2+ω2L2D√(EVR)2+(EVωL)2An a.c. source of variable angular frequency o is connected to an LCR series circuit. Which one of the following graphs correctly represents variation of impedance Zof a.c. circuit with angular frequency ω?
A B
B C
C D
D
An inductor has a resistance R and inductance L .It is connected to an A.C source of e.m.f E_(v) and angular frequency omega , then the current I_(v) in the circuit is
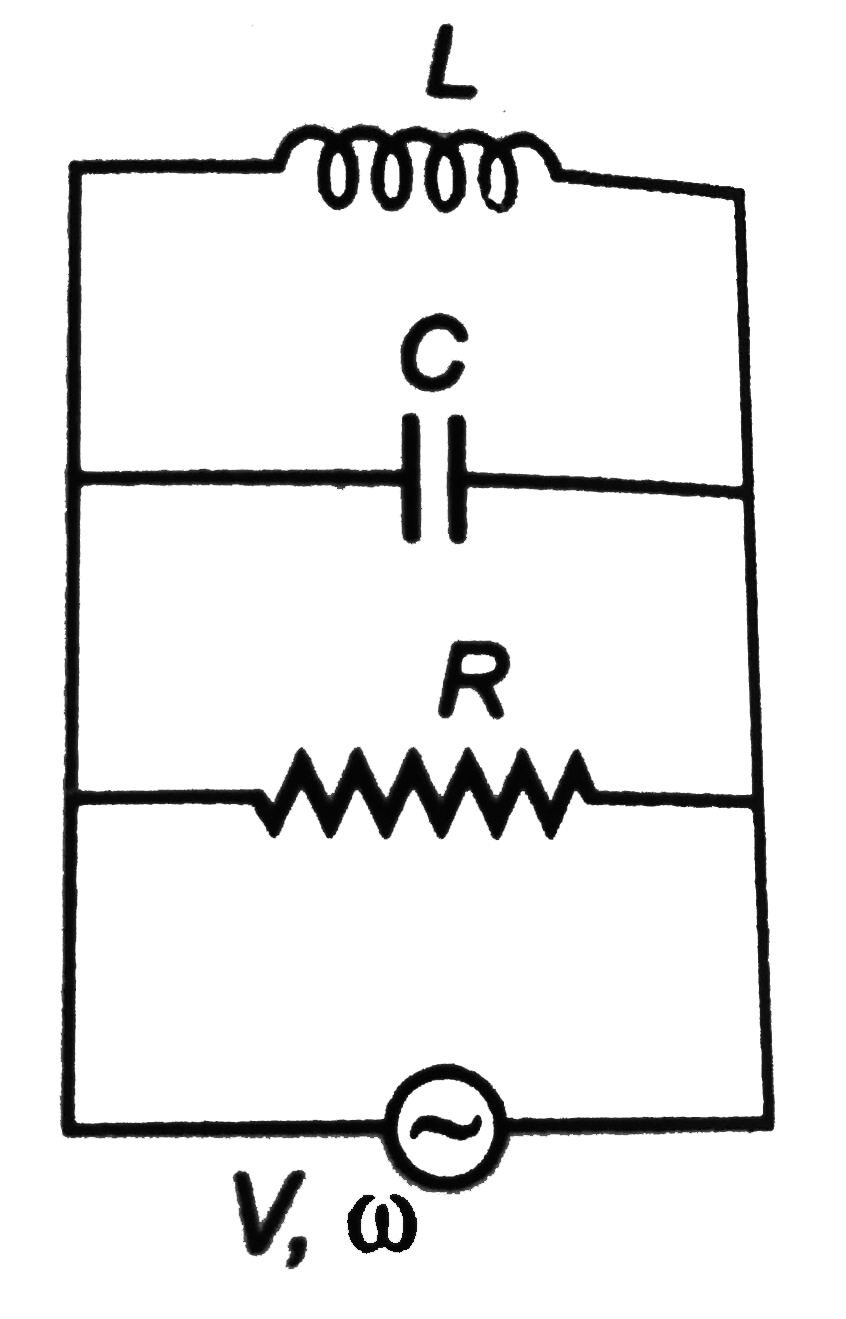
View SolutionConsider in L−C−R circuit as shown in figureure with an AC source of peak value V0 and angular frequency ω. Then the peak value of current through the AC
 .
.
View SolutionMention the factors on which the resonant frequency of a series LCR circuit depends. Plot a graph showing variation of impedance of a series LCR circuit with the frequency of the applied a.c. source.
View SolutionConsider in L−C−R circuit as shown in figureure with an AC source of peak value V0 and angular frequency ω. Then the peak value of current through the AC
 .
.
View SolutionAn inductor 20mH , a capacitor 50μF and a resistor 40Ω connected in series across a source of emf V=10sin340t. The power loss in A.C. circuit is
View Solution
