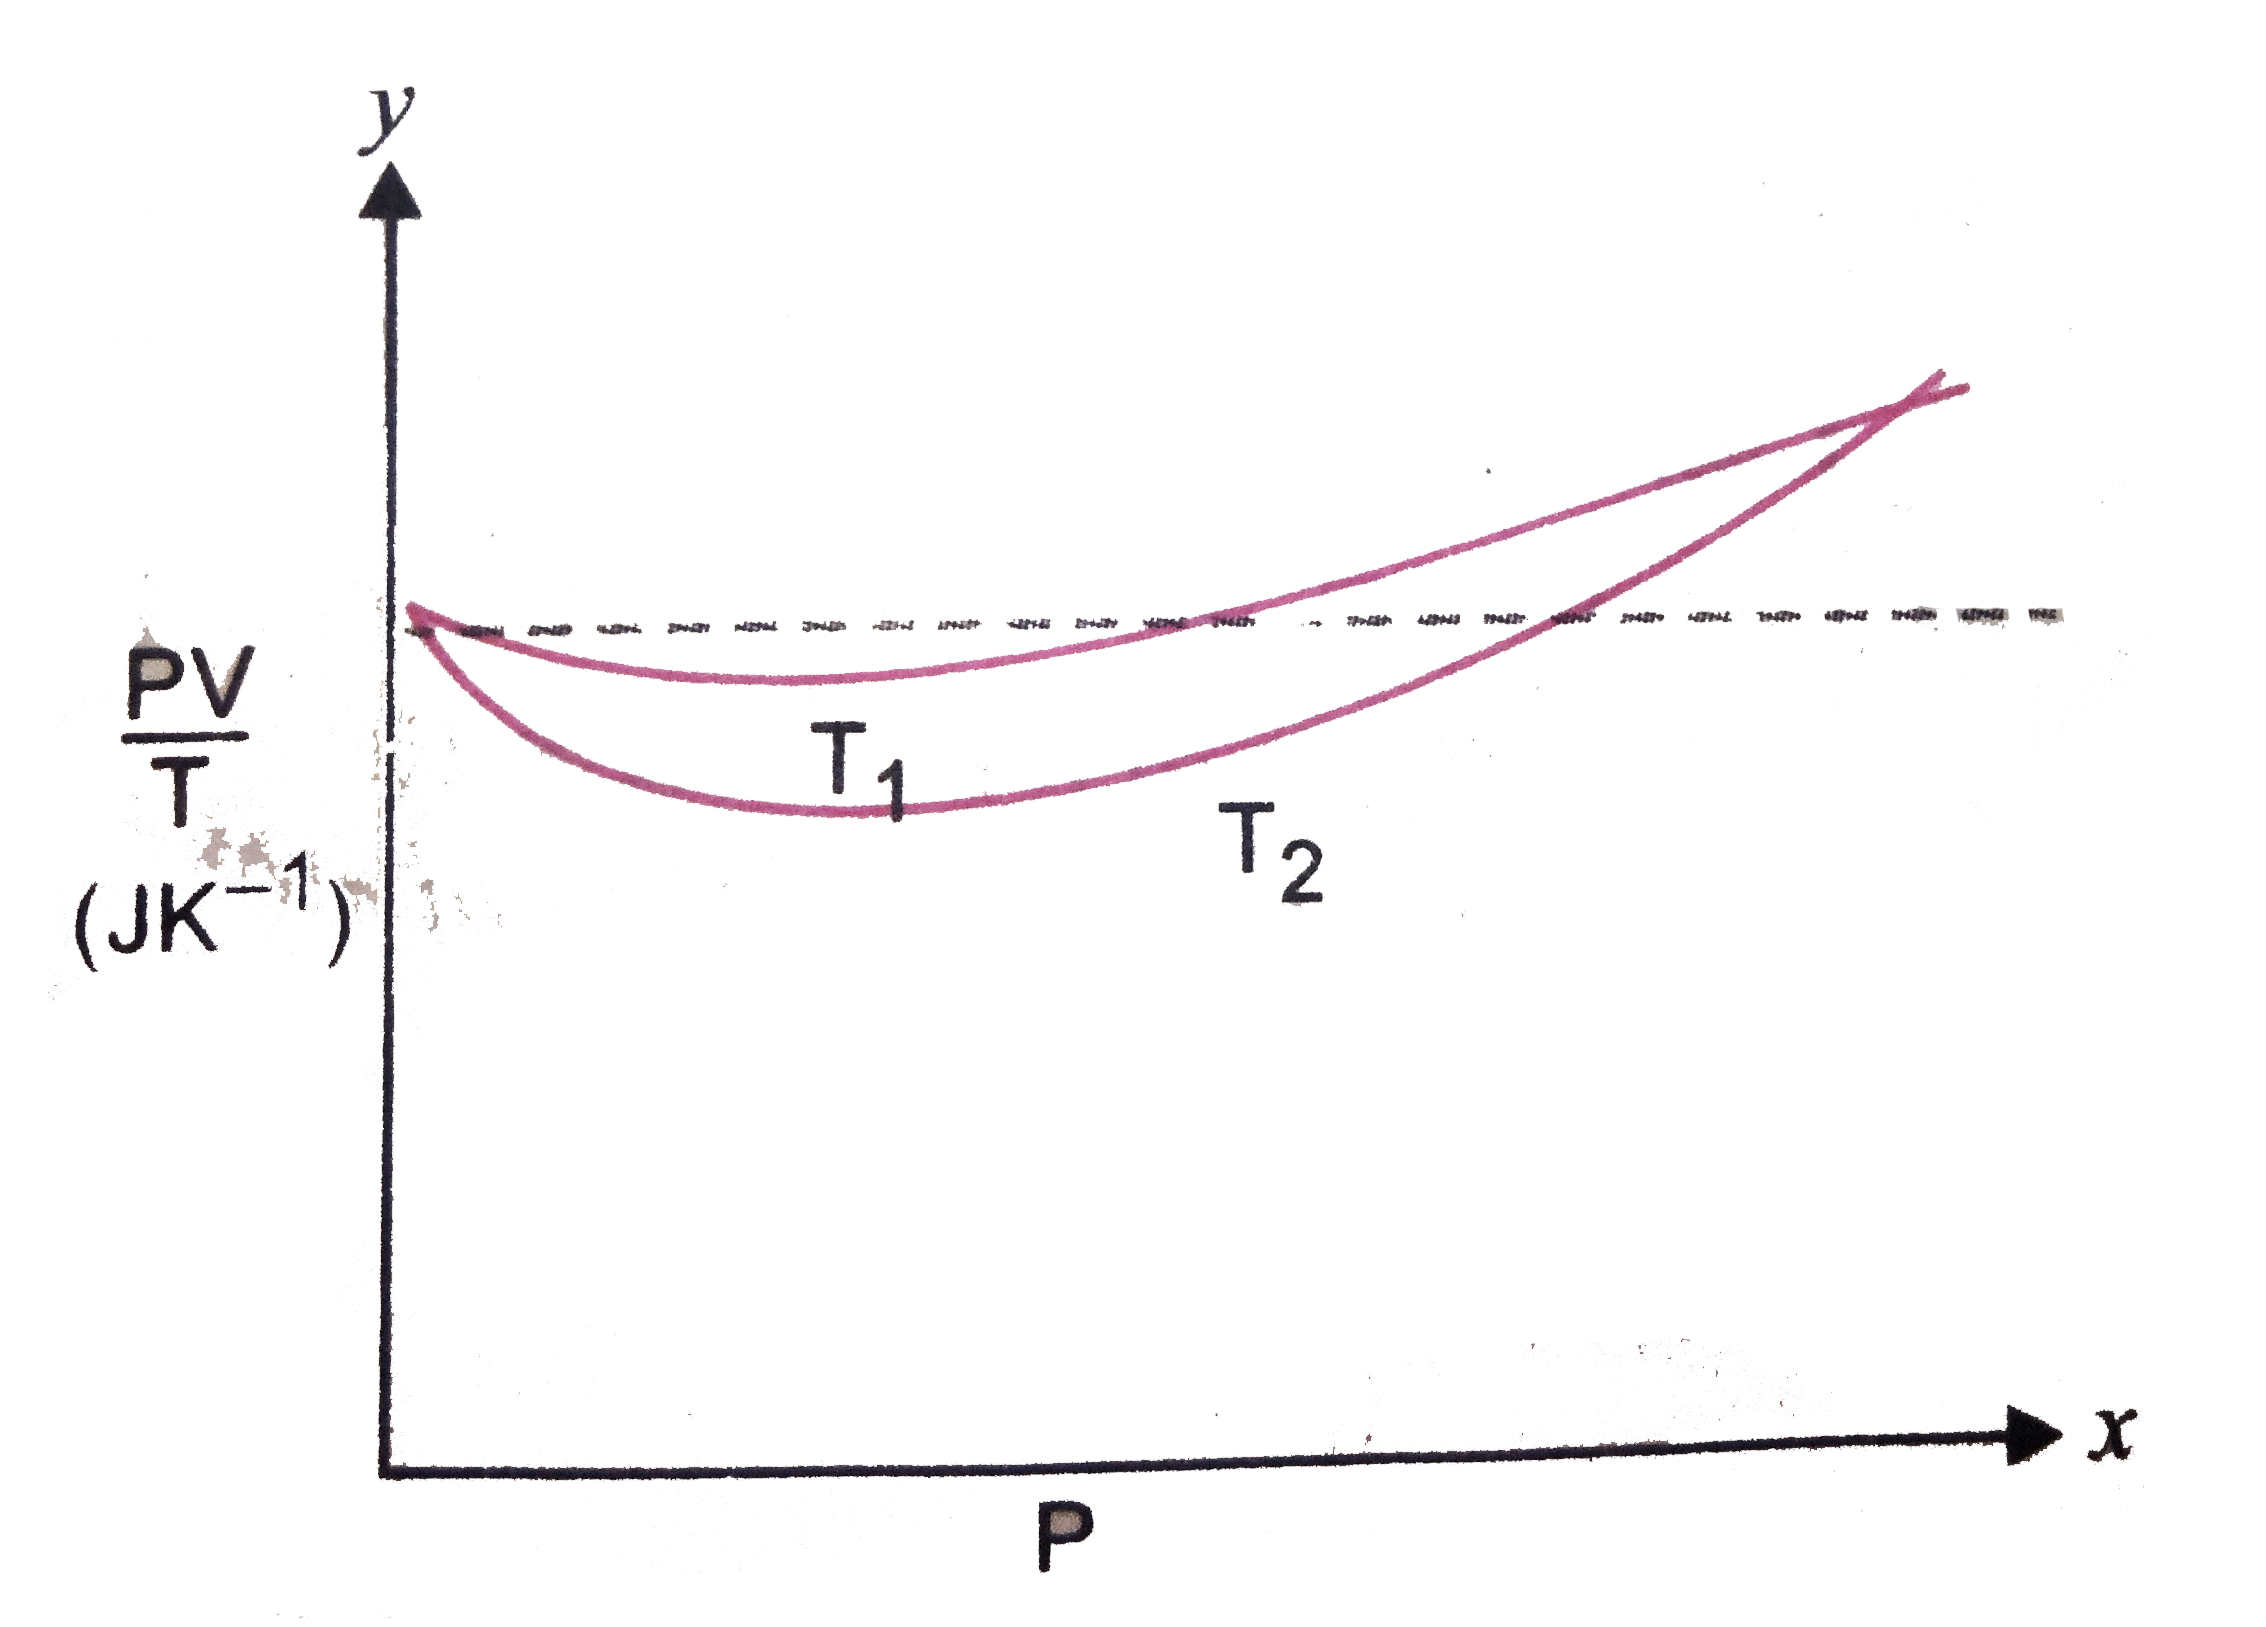
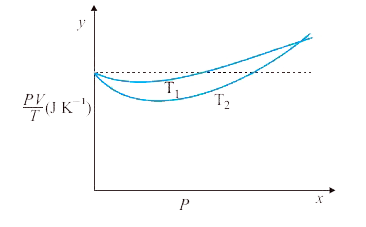
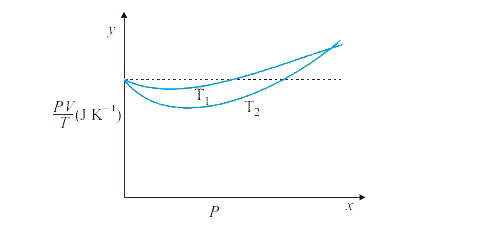
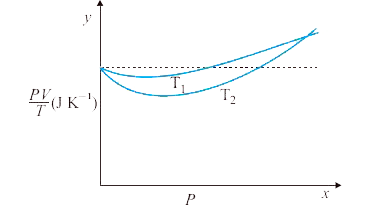
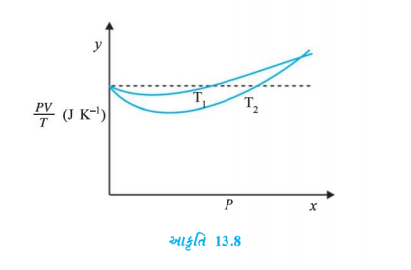
Fig shows of PV/T versus P for 1.00×10⁻³kg of oxygen gas at two different temperatures.
(a) What does the dotted plot signify ?
(b) Which is true : T1<T2orT2<T1?
( c) What is the value of PV/T where the curves meet on the Y-axis ?
(d) If we obtained similar plot for 1.00×10⁻³kg of hydrogen, would we get the same value of PV/T at the point where the curves meet on the y-axis ? If not, what mass of hydrogen yield the same value of PV/T (for low pressure high temperature region of the plot) ? (Molecular mass of H=2.02u, of O=32.0u,R=8.31Jmol−1K−1
 Solution in Tamil
(a) The dotted plot corresponds to .ideal gas behaviour, (b) T1>T2: (c) 0.26JK−1, (d) No, 6.3×10⁻⁵ kg of H2 would yield the same value
Topper's Solved these Questions
- KINETIC THEORYBOOK - NCERT TAMILCHAPTER - KINETIC THEORYEXERCISE - ADDITIONAL EXERCISE
4 Videos
- KINETIC THEORYBOOK - NCERT TAMILCHAPTER - KINETIC THEORYEXERCISE - ADDITIONAL EXERCISE
4 Videos
- KINEMATICSBOOK - NCERT TAMILCHAPTER - KINEMATICSEXERCISE - EXERCISE (IV. Exercises )
20 Videos
- KINETIC THEORY OF GASESBOOK - NCERT TAMILCHAPTER - KINETIC THEORY OF GASESEXERCISE - EVALUATION (Numerical Problems)
8 Videos
Similar Questions
A metre long narrow bore held horizontally (and close at one end) contains a 76 cm long mercury thread, which traps a 15 cm column of air. What happens if the tube is held vertically with the open end at the bottom?
View SolutionA metre long narrow bore held horizontally (and close at one end) contains a 76 cm long mercury thread, which traps a 15 cm column of air. What happens if the tube is held vertically with the open end at the bottom?
View SolutionThe position vectors particle has length 1m and makes 30∘ with the x-axis. What are the lengths of the x and y components of the position vector?
View SolutionA fresh air is composed of nitrogen N2(78%) and oxygen O2(21%). Find the rms speed of N2 and O2 at 20∘C.
View SolutionFig shows of PV/T versus P for 1.00×10⁻³kg of oxygen gas at two different temperatures.
(a) What does the dotted plot signify ?
(b) Which is true : T1<T2orT2<T1?
( c) What is the value of PV/T where the curves meet on the Y-axis ?
(d) If we obtained similar plot for 1.00×10⁻³kg of hydrogen, would we get the same value of PV/T at the point where the curves meet on the y-axis ? If not, what mass of hydrogen yield the same value of PV/T (for low pressure high temperature region of the plot) ? (Molecular mass of H=2.02u, of O=32.0u,R=8.31Jmol−1K−1

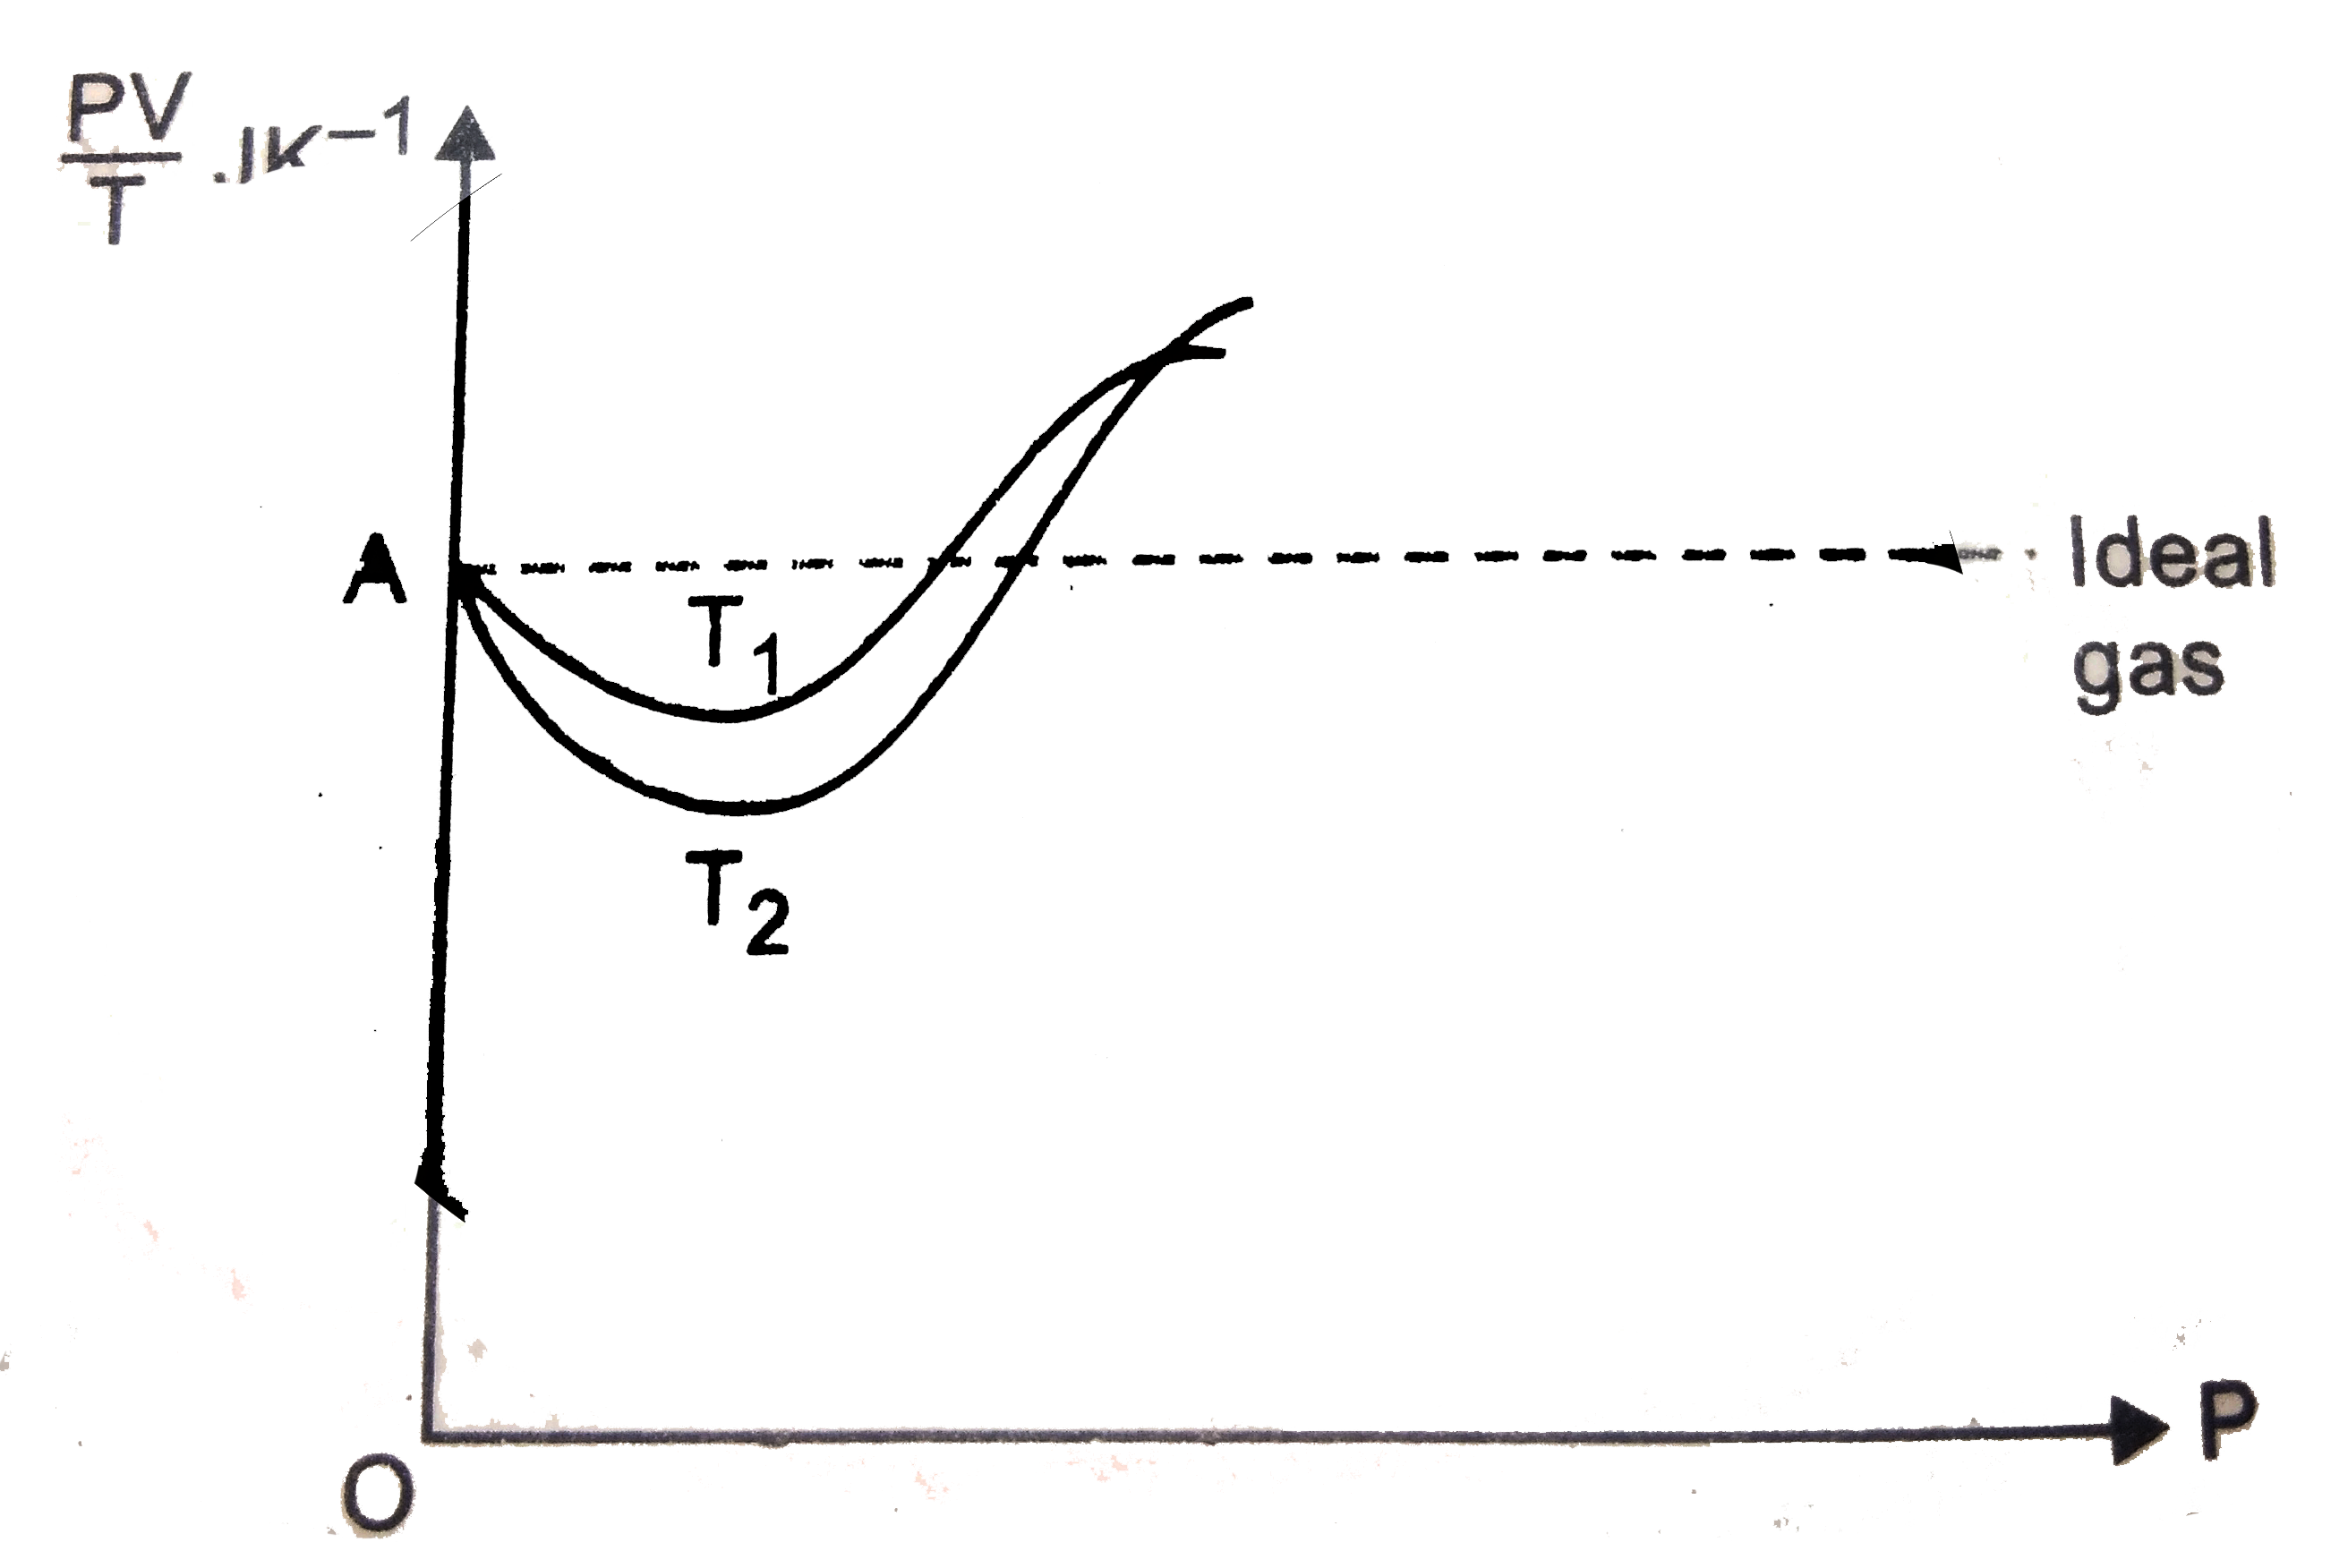
View SolutionGiven is the graph between PVT and P for 1 gm of oxygen gas at two different temperatures T1andT2 Fig. Given, density of oxygen =1.427kgm−3. The value of (PV)/(T) at the point A and the relation between T1andT2 are respectively :
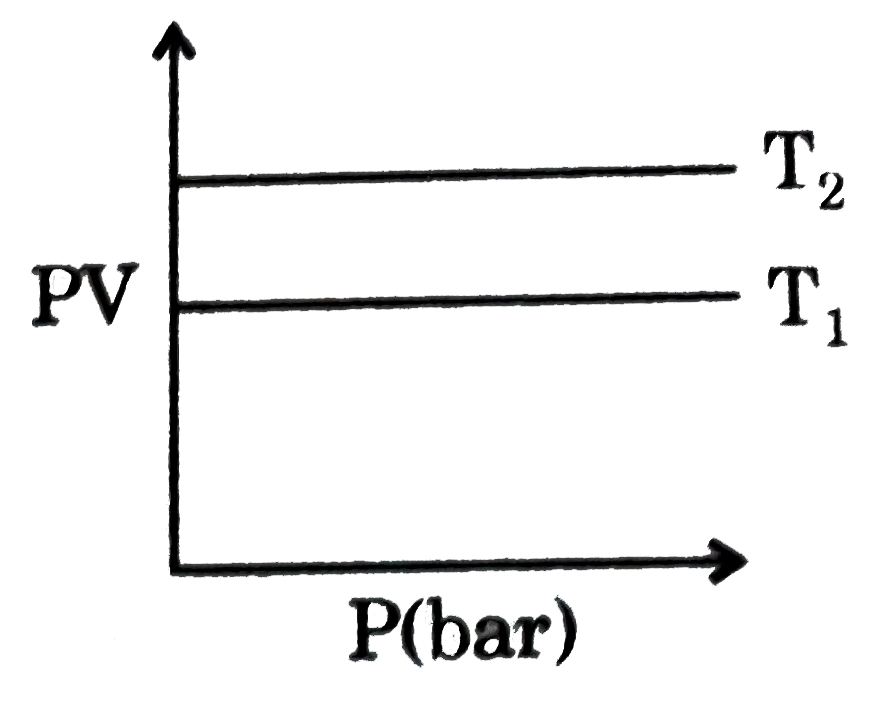
View SolutionThe product of PV is plotted against P at two temperatures T1 and T2 and the result is shown in figure. What is correct about T1 and T2?
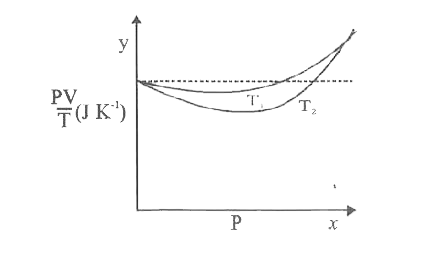
View SolutionFigure shows plot of PV//T versus P"for" 1.00 xx 10^(-3) kg of oxygen gas at two different temperatures. (i) What does the dotted plot signify? (ii) Which is true . T_(1) gt T_(2) "or" T_(1) lt T_(2) ? (iii) What is the value of PV//T where the curves meet on the y-axis?
View Solutionचित्र में ऑक्सीजन के 1.00×10⁻³ kg द्रव्यमान लियेPV/T एवं P में दो अलग – अलग तापों पर ग्राफ दर्शाये गये है।
(a) बिंदुकित रेखा क्या दर्शाती है?
(b) क्या सत्य है? T1>T2अथवाT1<T2?
(c ) अक्ष पर जहाँ वक्र मिलते है वहाँ PV/T का मान क्या है।
(d) यदि हम ऐसे ही ग्राफ 1.00×10³kg हाइड्रोजन के लिए बनाऍं तो भी क्या उस बिंदु पर जहाँ तक्र y-अक्ष से मिलते है। PV/T का मान कम दाब और उच्च ताप के क्षेत्र के लिए वही होगा। H2 का अणु द्रव्यमान =2.02uO2 का द्रव्यमान
=32.u,R=8,31Jmol−1K−1
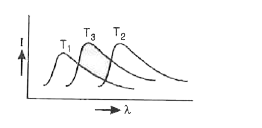
View SolutionThe plots of intensity versus wavelength for three black bodies at temperatures T1,T2 and T3 respecttively are shown in fig. Their temperatures are such that :
View SolutionFigure Show plot of PV/T versus P for 1.00×10⁻³ kg of oxygen gas at two different temperatures.
(a) What does the dotted plot signify?
(b) Which is true: T1>T2 or T1<T2?
(c) What is the value of PV/T where the curves meet on the y-axis?
(d) If we obtained similar plots for 1.00×10⁻³ kg of hydrogen, would we get the same value of PV/T at the point where the curves meet on the y-axis? If not, what mass of hydrogen yields the same value of PV/T (for low pressure high temperature region of the plot) ? (Molecular mass of H2=2.02u,ofO2=32.0u,R=8.31Jmol−1K−1.)
View SolutionFigure Show plot of PV/T versus P for 1.00×10⁻³ kg of oxygen gas at two different temperatures.
(a) What does the dotted plot signify?
(b) Which is true: T1>T2 or T1<T2?
(c) What is the value of PV/T where the curves meet on the y-axis?
(d) If we obtained similar plots for 1.00×10⁻³ kg of hydrogen, would we get the same value of PV/T at the point where the curves meet on the y-axis? If not, what mass of hydrogen yields the same value of PV/T (for low pressure high temperature region of the plot) ? (Molecular mass of H_(2) = 2.02 u, of O_(2) = 32.0 u, R= 8.31Jmol^(-1)K^(-1).)
View SolutionFigure Show plot of PV/T versus P for 1.00×10⁻³ kg of oxygen gas at two different temperatures.
(a) What does the dotted plot signify?
(b) Which is true: T1>T2 or T1<T2?
(c) What is the value of PV/T where the curves meet on the y-axis?
(d) If we obtained similar plots for 1.00×10⁻³ kg of hydrogen, would we get the same value of PV/T at the point where the curves meet on the y-axis? If not, what mass of hydrogen yields the same value of PV/T (for low pressure high temperature region of the plot) ? (Molecular mass of H_(2) = 2.02 u, of O_(2) = 32.0 u, R= 8.31Jmol^(-1)K^(-1).)
View SolutionFigure Show plot of PV/T versus P for 1.00×10⁻³ kg of oxygen gas at two different temperatures.
(a) What does the dotted plot signify?
(b) Which is true: T1>T2 or T1<T2?
(c) What is the value of PV/T where the curves meet on the y-axis?
(d) If we obtained similar plots for 1.00×10⁻³ kg of hydrogen, would we get the same value of PV/T at the point where the curves meet on the y-axis? If not, what mass of hydrogen yields the same value of PV/T (for low pressure high temperature region of the plot) ? (Molecular mass of H_(2) = 2.02 u, of O_(2) = 32.0 u, R= 8.31Jmol^(-1)K^(-1).)
View SolutionFigure show plot of (PV)/(T) and P for 2gm of oxygen gas at two different temeratures. (i)The significance of dotted line (ii)The relation between T_(1) and T_(2) (iii)The value of (PV)/(T) where the curves meet on the Y-axis.
View SolutionGiven is the graph between PV/T and P for 1 gm of oxygen gas at two different temperature T_(1) and T_(2) (Given:Density of oxygen= 1.429 kg//m^(3) ).The value of PV/T at the point A and the relation between T_(1) and T_(2) and respectively
View Solution