A graph is plotted between PVm along y-axis and P along x-axis, where Vm is the molar volume of a real gas. Find the intercept along y-axis.Solution in Telugu
RT2
√RT
RT
(RT)1/2
Step by step video & image solution for A graph is plotted between PV_(m) along y-axis and P along x-axis, where V_(m) is the molar volume of a real gas. Find the intercept along y-axis. by Chemistry experts to help you in doubts & scoring excellent marks in Class 12 exams.
Updated on:21/07/2023Topper's Solved these Questions
- STATES OF MATTER BOOK - AAKASH SERIESCHAPTER - STATES OF MATTER EXERCISE - ADDITIONAL PRACTICE EXERCISE- PRACTICE SHEET (ADVANCED) (MORE THAN ONE CORRECT ANSWER TYPE QUESTIONS)
2 Videos
- STATES OF MATTER BOOK - AAKASH SERIESCHAPTER - STATES OF MATTER EXERCISE - ADDITIONAL PRACTICE EXERCISE-PRACTICE SHEET (ADVANCED) (LINKED COMPREHENSION TYPE QUESTIONS) (PASSAGE- I)
3 Videos
- STATES OF MATTER BOOK - AAKASH SERIESCHAPTER - STATES OF MATTER EXERCISE - ADDITIONAL PRACTICE EXERCISE (LEVEL-II LECTURE SHEET (ADVANCED)) (INTEGER TYPE QUESTIONS)
2 Videos
- SOLUTIONS BOOK - AAKASH SERIESCHAPTER - SOLUTIONS EXERCISE - Objective Exercise -4
50 Videos
- STOICHIOMETRYBOOK - AAKASH SERIESCHAPTER - STOICHIOMETRYEXERCISE - PRACTICE SHEET (ADVANCED) (INTEGER TYPE QUESTION)
2 Videos
Similar Questions
Which of the following graphs give a straight lines for the given properties of an ideal gas
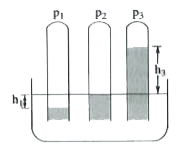
View SolutionConsider gases confined by a liquid, as shown below.
Density of the liquid = d.gmL−1
h1 and h3 in mm and p1,p2 and p3 in mm Hg.

Select correct relation for pressure p3
View SolutionHow many factors can influence the coefficient of viscocity of a liquid ?
View SolutionAssertion : Molarity of a solution decreases with an increase of temperature
Reason : As temperature increases volume of the solution increases.
View SolutionAmmonia is oxised by oxygen to give nitric oxide and water. The weight of water produced per gram of nitric oxide is 0.1×xg. What is value of d.
View SolutionA graph is plotted between PV_(m) along Y-axis and P along X-axis whre V_(m) is the molar voulume of a real gas Find the intercept along Y-axis .
View SolutionIf a graph is plotted taking the temperature in Fahrenheit along the Y -axis and the corresponding temperature in Celsius along the X -axis, it will be a straight line
View SolutionA graph is plotted with PV/T on y-axis and mass of the gas along x-axis for different gases. The graph is
View SolutionIn the graph shown in fig. the time is plotted along x-axis. Which quantity associated with the projectile motion is plotted along the y -axis:-
View SolutionFor a real gas which obeys van der waals equation, a graph is obtained by plotting the values of PV_(m) along the y-axis and the values of P along the x-axis. What is the value of intercept on the y-axis of the graph?
View SolutionFor a real gas obeying van der waal's equation , graph is plotted between PV_m (y- axis) and P (x - axis) where V_m is molar volume . Y - intercept the graph is
View SolutionA graph is plotted by taking pressure along y-axis and centigrade temperature along X-axis for an ideal gas at constant volume. x intercept of the graph is
View SolutionIf a graph is plotted by taking spectral emissive power along y-axis and wavelength along X-axis then the area below the graph above wavelength axis is
View SolutionA graph is plotted taking .^@C along the Y-axis and .^@F along the X-axis. It is a/an
View SolutionPassage -I:
A graph is drawn between centigrade temperature of a body along x-axis and corresponding Fahrenheit temperature along y-axis.
y-intercept is
View SolutionPassage -I:
A graph is drawn between centigrade temperature of a body along x-axis and corresponding Fahrenheit temperature along y-axis.
x-intercept is
View Solution
