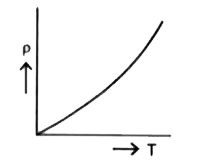
Show variation of resistivity of copper as a function of temperature in a graph. Solution in Kannada
Topper's Solved these Questions
- CURRENT ELECTRICITY BOOK - OSWAAL PUBLICATIONCHAPTER - CURRENT ELECTRICITY EXERCISE - TOPIC-1 ( ELECTRIC CURRENT, RESISTANCE & CALLS) (SHORY ANSWER TYPE QUESTIONS-I)
7 Videos
- CURRENT ELECTRICITY BOOK - OSWAAL PUBLICATIONCHAPTER - CURRENT ELECTRICITY EXERCISE - TOPIC-1 ( ELECTRIC CURRENT, RESISTANCE & CALLS) (SHORY ANSWER TYPE QUESTIONS-II)
4 Videos
- COMMUNICATION SYSTEMBOOK - OSWAAL PUBLICATIONCHAPTER - COMMUNICATION SYSTEMEXERCISE - TOPIC-3 INTERNET, MOBILE AND GPS (SHORT ANSWER TYPE QUESTIONS -I)
2 Videos
- DUAL NATURE OF RADIATION AND MATTERBOOK - OSWAAL PUBLICATIONCHAPTER - DUAL NATURE OF RADIATION AND MATTEREXERCISE - TOPIC-2 DE-BROGLIE RELATION (NUMERICAL PROBLEMS)
7 Videos
Similar Questions
Give any two practical limitations of Ohm's law.
View SolutionState and explain ohm's law
View SolutionArrange the following networks in increasing order of the number of computers that may be present in the network:
Internet, LAN, WAN
View SolutionCalculate de-Broglie wavelength associated with a rifle bullet of mass 2 gram moving with a speed of 400ms−1.
View SolutionDefine the term 'temperature coefficient of resistivity' . Write its S.I. unit. Plot a graph showing the variation of resistivity of copper with temperature.
View SolutionShow on a graph, the variation of resistivity with temperature for a typical semiconductor.
View SolutionShow variation of resistivity of copper as a function of temperature in a graph.
View SolutionShow variation of resistivity of copper as a function of temperature in a graph.
View SolutionShow variation of resistivity of SI with temperature in a graph.
View SolutionDraw a graph of resistivity of copper as a function of absolute temperature.
View SolutionSketch a graph showing variation of resistivity with temperature of (i) Copper (ii) Carbon.
View Solutionwhich of the following graph represents the variation of resistivity (ρ) with temperature (T) for copper?
View SolutionShow variation of resistivity of copper as a function of temperature in a graph.
View SolutionShow on a graph the variation of resistivity with temperature for a typical semiconductor
View SolutionShow on a graph, the variation of resistivity with temperature for a typical semiconductor.
View Solution

