A survey of 120 school students was done to find which activity they prefer to do in their free time Draw a bar graph to illustrate the above data taking scale of 1 unit length = 5 students. Which activity is preferred by most of the students other than playing?
To solve the problem step by step, we will first summarize the data, then create a bar graph, and finally analyze the graph to find the preferred activity other than playing.
Step 1: Summarize the Data
We have the following data from the survey of 120 school students regarding their preferred activities:
- Playing: 45 students
- Reading storybooks: 30 students
- Watching TV: 20 students
- Listening to music: 10 students
- Painting: 15 students
Step 2: Determine the Scale for the Bar Graph
The problem states that 1 unit length on the graph represents 5 students. Therefore, we can convert the number of students into units:
- Playing: 45 students = 45/5 = 9 units
- Reading storybooks: 30 students = 30/5 = 6 units
- Watching TV: 20 students = 20/5 = 4 units
- Listening to music: 10 students = 10/5 = 2 units
- Painting: 15 students = 15/5 = 3 units
Step 3: Draw the Bar Graph
1. Draw the Axes:
- Draw a vertical line (y-axis) for the number of students (0 to 50 in increments of 5).
- Draw a horizontal line (x-axis) for the activities: Playing, Reading Storybooks, Watching TV, Listening to Music, and Painting.
2. Label the Axes:
- Label the y-axis with the number of students.
- Label the x-axis with the activities.
3. Plot the Bars:
- For Playing, draw a bar up to 9 units.
- For Reading Storybooks, draw a bar up to 6 units.
- For Watching TV, draw a bar up to 4 units.
- For Listening to Music, draw a bar up to 2 units.
- For Painting, draw a bar up to 3 units.
Step 4: Analyze the Bar Graph
From the bar graph, we can visually compare the heights of the bars to determine which activity is preferred the most other than playing.
- The tallest bar represents Playing (9 units).
- The second tallest bar represents Reading Storybooks (6 units).
Conclusion
The activity preferred by most of the students other than playing is Reading Storybooks.
We have the following data from the survey of 120 school students regarding their preferred activities:
- Reading storybooks: 30 students
- Watching TV: 20 students
- Listening to music: 10 students
- Painting: 15 students
The problem states that 1 unit length on the graph represents 5 students. Therefore, we can convert the number of students into units:
- Reading storybooks: 30 students = 30/5 = 6 units
- Watching TV: 20 students = 20/5 = 4 units
- Listening to music: 10 students = 10/5 = 2 units
- Painting: 15 students = 15/5 = 3 units
1. Draw the Axes:
- Draw a vertical line (y-axis) for the number of students (0 to 50 in increments of 5).
- Draw a horizontal line (x-axis) for the activities: Playing, Reading Storybooks, Watching TV, Listening to Music, and Painting.
- Label the y-axis with the number of students.
- Label the x-axis with the activities.
- For Playing, draw a bar up to 9 units.
- For Reading Storybooks, draw a bar up to 6 units.
- For Watching TV, draw a bar up to 4 units.
- For Listening to Music, draw a bar up to 2 units.
- For Painting, draw a bar up to 3 units.
From the bar graph, we can visually compare the heights of the bars to determine which activity is preferred the most other than playing.
- The second tallest bar represents Reading Storybooks (6 units).
The activity preferred by most of the students other than playing is Reading Storybooks.
Topper's Solved these Questions
- DATA HANDLINGBOOK - NCERT ENGLISHCHAPTER - DATA HANDLINGEXERCISE - EXERCISE 9.1
7 Videos
- DATA HANDLINGBOOK - NCERT ENGLISHCHAPTER - DATA HANDLINGEXERCISE - EXERCISE 9.3
3 Videos
- BASIC GEOMETRICAL IDEASBOOK - NCERT ENGLISHCHAPTER - BASIC GEOMETRICAL IDEASEXERCISE - EXERCISE 4.6
4 Videos
- DECIMALSBOOK - NCERT ENGLISHCHAPTER - DECIMALSEXERCISE - EXERCISE 8.3
2 Videos
Similar Questions
Given below is the data of school going students (boys and girls):

Draw the bar graph to represent the above data.
View SolutionNumber of persons in various age groups in a town is given in the following tableDraw a bar graph to represent the above information and answer the following questions. (take 1 unit length = 20 thousands)(a) Which two age groups have same population?(b) All persons in the age group of 60 and above are called senior citizens. How many senior citizens are there in the town?
View Solution
Knowledge Check
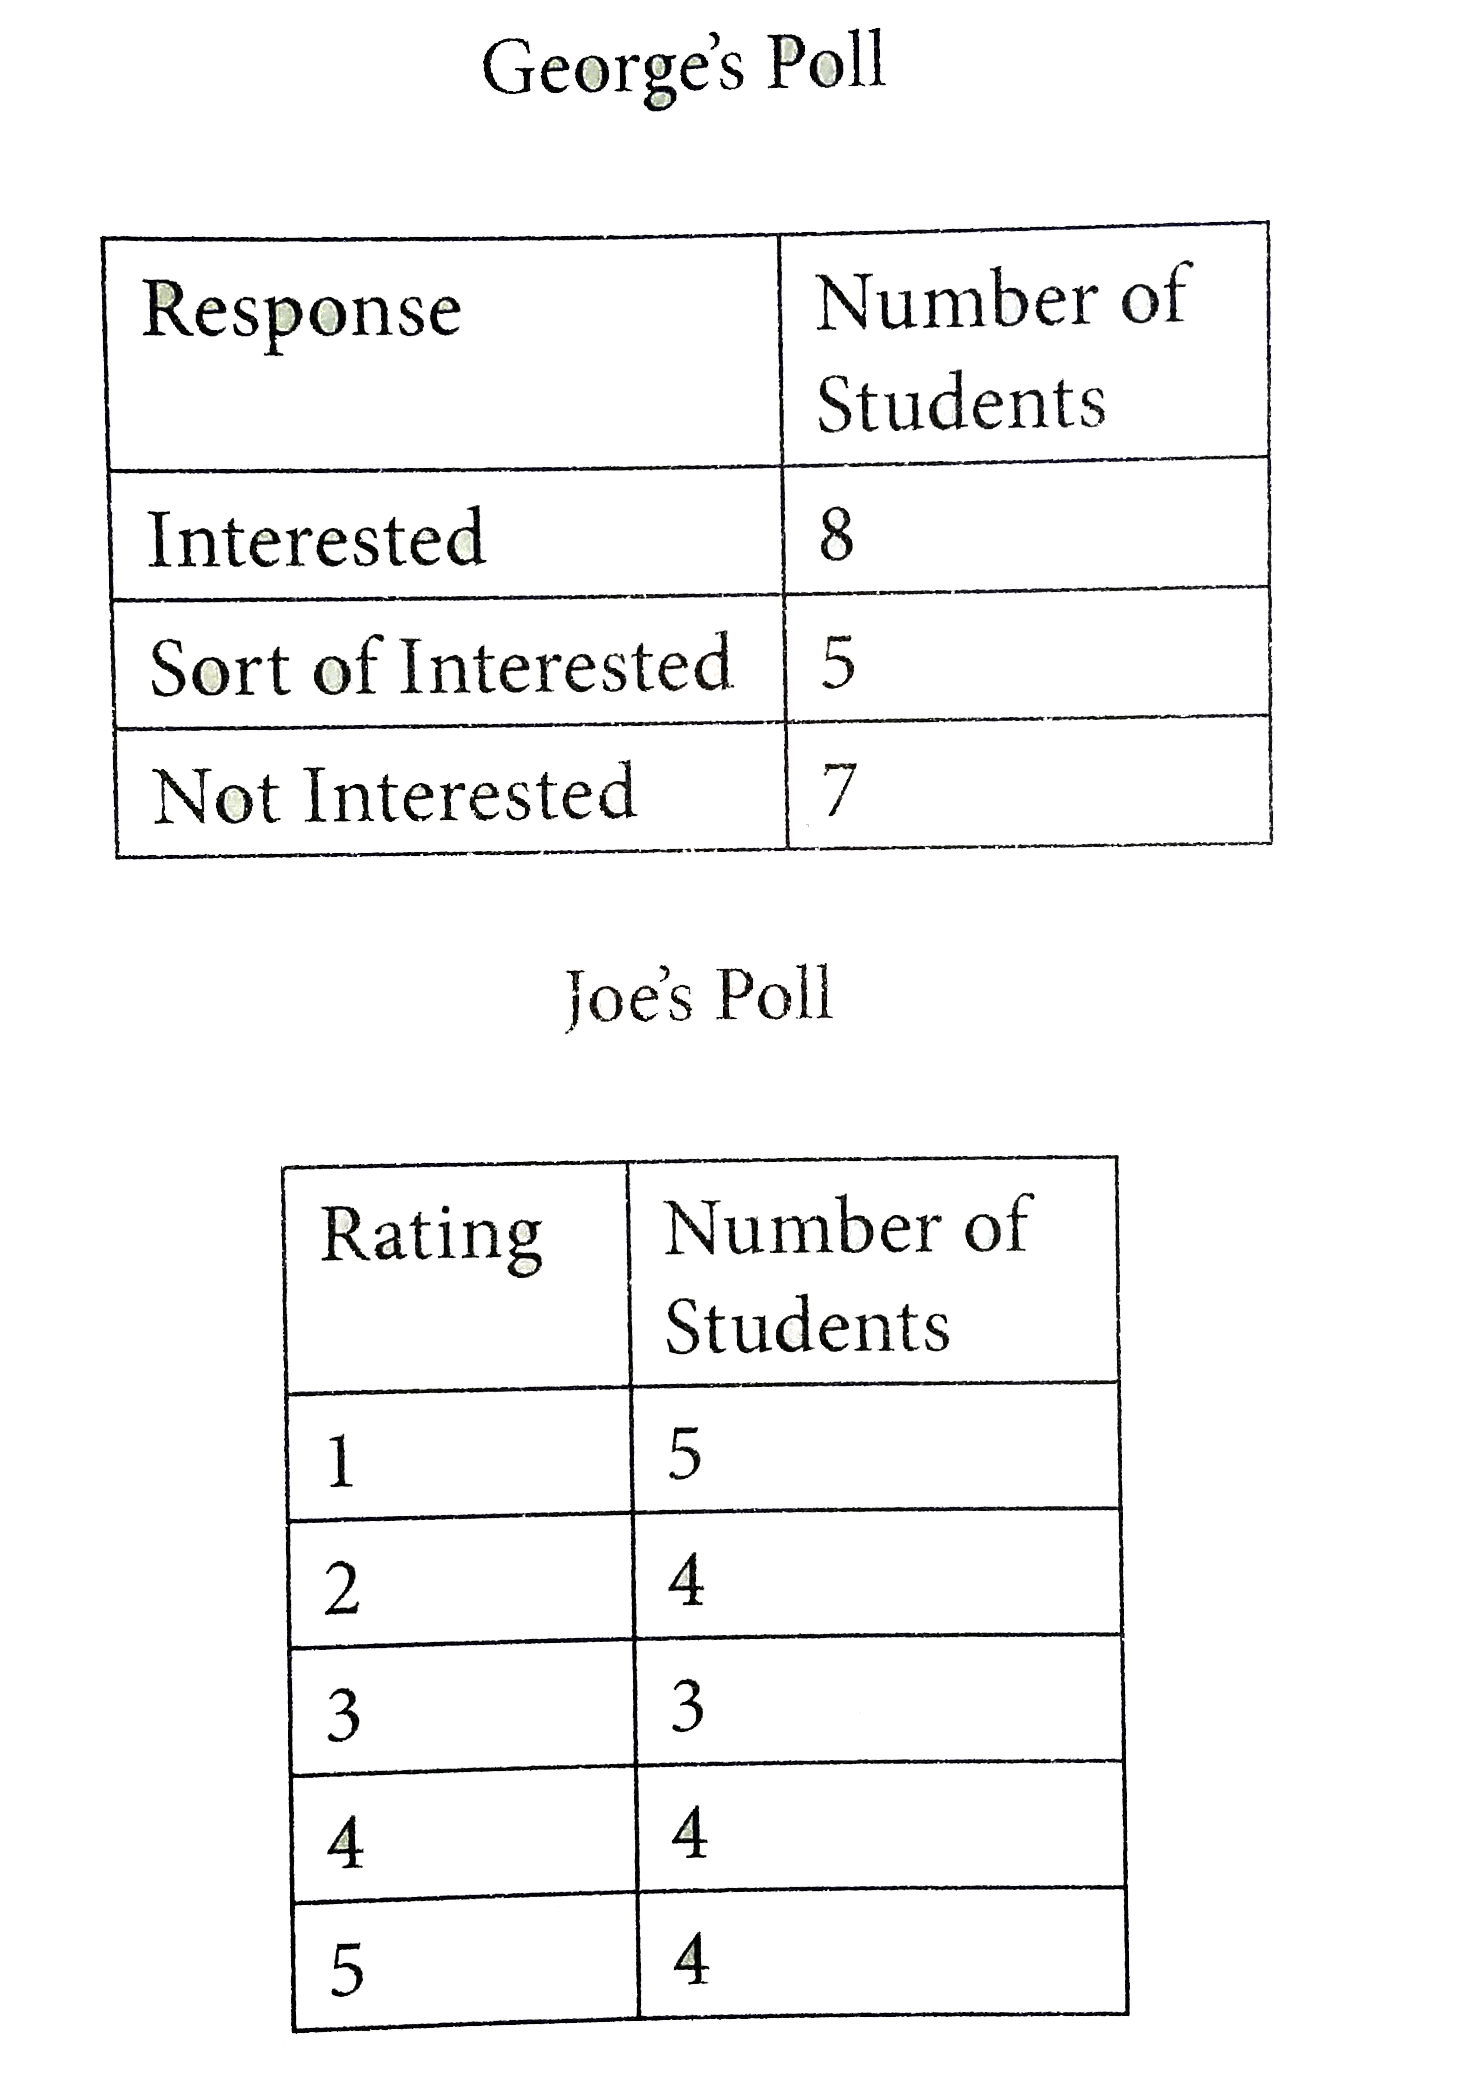
George and Joe inteview the same 20 follow students regarding their interest in their schools new model UN club. George asked the students to respond with interested., Sort of interested , and Noot interested. Joe asked the students to rate their interest on a scale of 1 to 5. The results of the polls are below.

After reviewing the data, the Model UN advisors determine that Joe informed the students of Whether a 1 or a 5 was the best rating, but neglected to report to them whether it was a 1 or a 5 that was the best rating in the report. What additional piece of information would most help the advisor determine whether a 1 or 5 was the best rating?ARequesting the George redo his poll with the same rating system as Joe's pollBRequesting that Joe redo his poll with the same rating system as George's pollCPolling all of the students who said "Interested" in George's Poll and asking them to choose between " Extremely Interested" and "Very Interested"DPolling all of the students who gave a "1" rating in Joe's poll and ask them if they are interested in MODEL UN
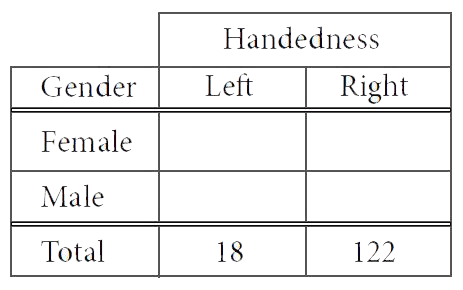
The incomplete table above summarizes the number of left-handed students and right-handed students by gender for the eighth-grade students at Keisel Middle School. There are 5 times as many right-handed female students as there are left-handed female students, and there are 9 times as many right-handed male students as there are left-handed male students. If there is a total of 18 left-handed students and 122 right-handed students in the school, which of the following is closest to the probability that a right-handed student selected at random is female? (Note: Assume that none of the eighth-grade students are both right-handed and left-handed.)A0.410B0.357C0.333D0.250
The marks obtained by 120 students in a Mathematics test are given below:

Using the informations, given above, draw an ogive on a graph sheet. Take a suitable scale for your ogive. Use the ogive drawn to estimate :
(i) the median.
(ii) the number of students who obtained more than 75% marks in the test.
(iii) the number of students who did not pass in the test if the pass percentage was 40.
View SolutionAn inquistive student, determined to test the law of gravity for himself, walks to the top of a building og 145 floors, with every floor of height 4 m, having a stopwatch in his hand (the first floor is at a height of 4 m from the ground level). From there he jumps off with negligible speed and hence starts rolling freely. A rocketeer arrives at the scene 5 s later and dives off from the top of the building to save the student. The rocketeer leaves the roof with an initial downward speed v0. In order to catch the student at a sufficiently great height above ground so that the rocketeer and the student slow down and arrive at the ground with zero velocity. The upward acceleration that accomplishes this is provided by rocketeer's jet pack, which he turns on just as he catches the student, before the rocketeer is in free fall. To prevent any discomfort to the student, the magnitude of the acceleration of the rocketeer and the student as they move downward together should not exceed 5 g.
Just as the student starts his free fall, he presses the button of the stopwatch. When he reaches at the top of 100th floor, he has observed the reading of stopwatch as 00:00:06:00 (hh:mm:ss:100 th part of the second). Find the value of g. (correct upt ot two decimal places).
View SolutionSeeing the growing cases of diabetes and depression among young children, Mr. Chopra, the principal of one reputed school organized a seminar in which he invited parents and principals. They all resolved this issue by strictly banning junk food in schools and introducing healthy snacks and drinks like soup, lassi, milk, etc. in school canteens. They also decided to make compulsory half an hour of daily physical activities for the students in the morning assembly. After six months, Mr. Chopra conducted the health survey in most of the schools and discovered a tremendous improvement in the health of the students.
After reading the above passage, answer the following questions :
(i) What are the values (at least two) displayed by Mr. Chopra ?
(ii) As a student, how can you spread awareness about this issue ?
(iii) Why should antidepressant drugs not be taken without consulting a doctor ?
(iv) Give two examples of artificial sweeteners.
View SolutionA survey was conducted by a group of students as a part of their environment awareness programme , in which they collected the following data regarding the number of plants in 20 houses in a locality. Find the mean number of plants per house. Number of plants: 0-2 2-4 4-6 6-8 8-10 10-12 12-14 Number of houses: 1 2 1 5 6 2 3 Which method did you use for finding the mean, and why?
View SolutionTotal number of students of a school in different years is shown in the following table: Year, No. of Students 1996 1998 2000 2002 2004, 400 550 450 600 650 Represent the above data by a pictograph. Prepare a pictograph of students using one symbol an icon of a student to represent 100 students and answer the following questions: How many symbols represent total number of students in the year 2002? How many symbols represent total number of students in the year 1998? Prepare another pictograph of students using any other symbol each representing 50 students. Which pictograph do you find more informative?
View SolutionPeer pressure plays a negative role in triggering smoking habits in adolescents. As a school captain list any two activities you would like to organize with the help of senior students of your school and any other two activities you would like your school authorities to organize for the students to tackle this problem. Explain how theHe activities will help in doing so.
View Solution
