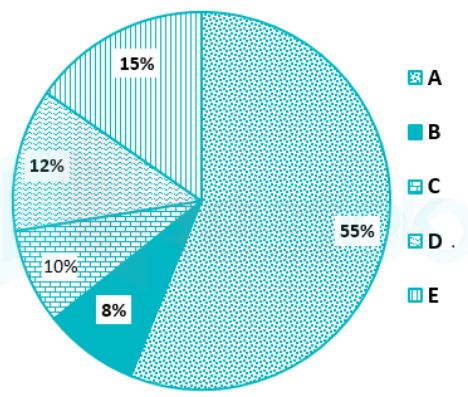
The following pie chart gives he distribution of funds in a five year plan under the major heads of development expenditures:
Agriculture (A), Industry (B), Education (C), Employment (D) and Miscellaneous (E)
The total allocation is 36,000 (in crores of rupees).
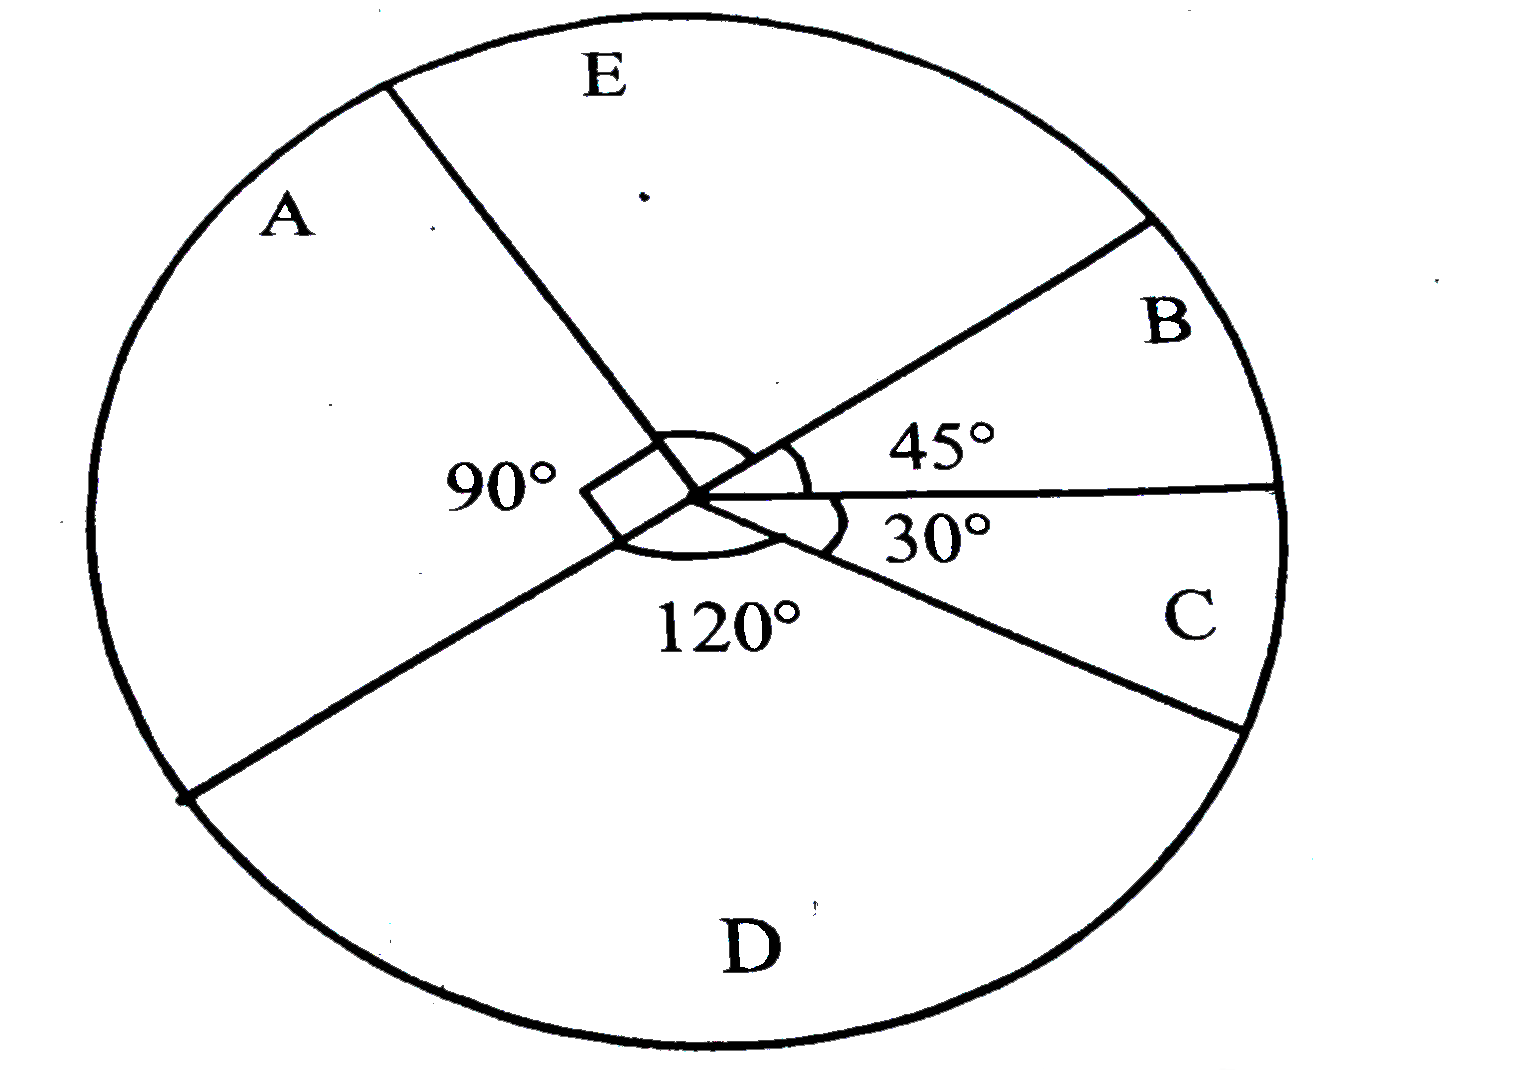
How much money (in crores) is allocated to both Agriculture and Employment?
20000
21000
24000
27000
The correct Answer is:B
Required =9000+12000=21000
Topper's Solved these Questions
- SETS, RELATIONS, FUNCTIONS AND NUMBER SYSTEM BOOK - NDA PREVIOUS YEARSCHAPTER - SETS, RELATIONS, FUNCTIONS AND NUMBER SYSTEM EXERCISE - MCQ
271 Videos
- TRIGONOMETRY - RATIO & IDENTITY , TRIGONOMETRIC EQUATIONSBOOK - NDA PREVIOUS YEARSCHAPTER - TRIGONOMETRY - RATIO & IDENTITY , TRIGONOMETRIC EQUATIONSEXERCISE - MCQ
238 Videos
Similar Questions
The following pie chart gives he distribution of funds in a five year plan under the major heads of development expenditures:
Agriculture (A), Industry (B), Education (C), Employment (D) and Miscellaneous (E)
The total allocation is 36,000 (in crores of rupees).
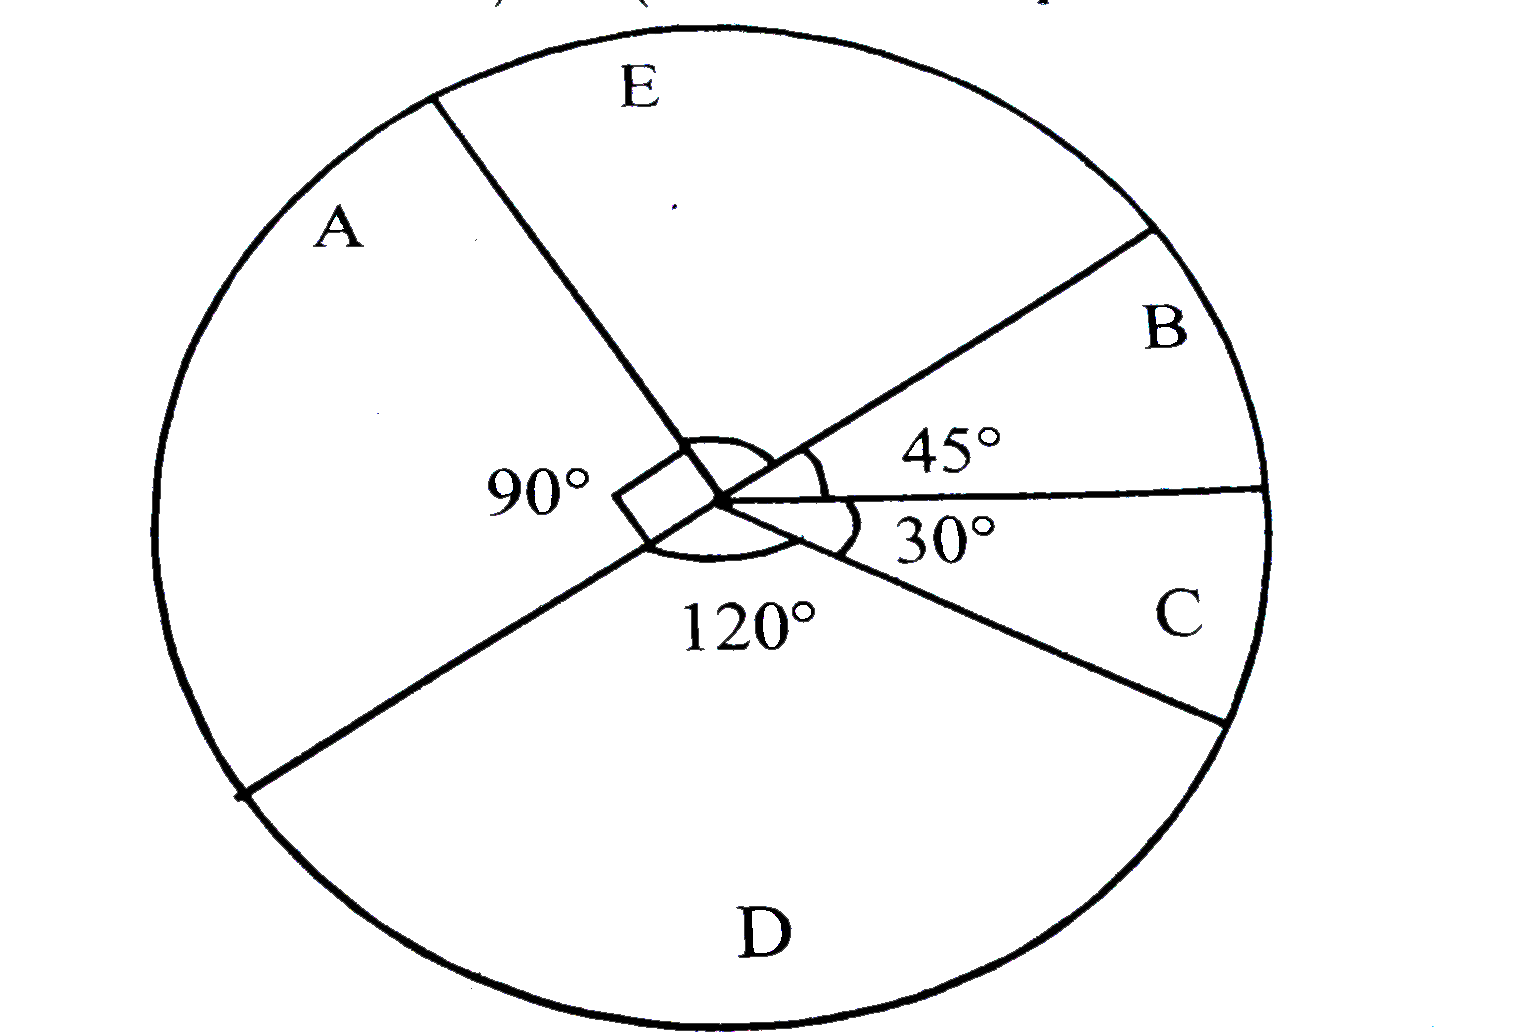
Which head is allocated maximum funds ?
View SolutionThe following pie chart depicts the expenditure of a state government under different heads,

If the total spending is 10 crores, how much 20% do money was spent on roads?
View Solution
Knowledge Check
The following pie chart shows the expenditure of company XYZ in Q3 2015 on various heads.

If company XYZ has spent a total of 100 lakh crores on the various heads then how much did it spent on R & D (in lakh crores)A20B10C30D40The following pie-chart and table show the percentage distribution of farmers in 5 states A, B, C, D & E of a country who claimed insurance due to drought in the year 2017 and ratio of males to females of the number of farmers in states, respectively. Study the pie-chart and the table carefully and answer the following questions.
Note: Some data are missing in the pie-chart and table, if required in any question, find the missing data first and then answer the question.
Total number of farmers who claimed insurance in the year 2017 = 2,64,000
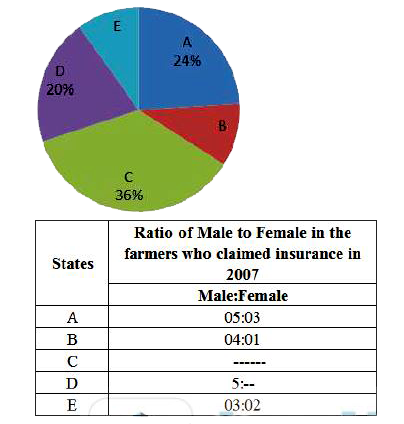
The number of farmers who claimed insurance in state C exceeds the total number of farmers (who claimed insurance)in state E and state A together by 5280. What is the percentage of farmers who claimed insurance in state E?A0.15B0.25C0.1D0.4
The following pie chart depicts the expenditure of a state government under different heads,(if the total spending is 10 crores)

How many times is the amount of money Others spent on education compared to the amount spent on roads?
View SolutionThe following pie chart shows the expenditure (in percentage) of the five companies P,Q,R,S and T in the year 2016 .
Total Expenditure = Rs. 48 crores
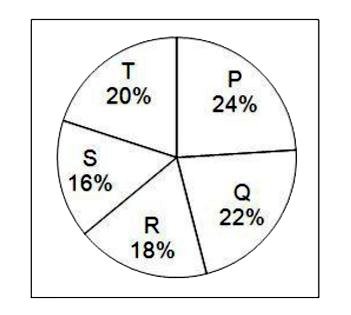
By how much percent expenditure of company Q and R together greater than that of company P?
View SolutionDraw a pie-diagram to represent the following data on the proposed outlay during the fourth five-year plan. Items, Agriculture, Ind. and Minerals, Irrigation & Power, Communication, Miscellaneous Rupees (in crores), 6000, 4000, 2500, 4500, 3000
View SolutionDraw a pie-diagram to represent the following data on the proposed outlay during the fourth five-year plan. Items, Agriculture, Ind. and Minerals, Irrigation & Power, Communication, Miscellaneous Rupees (in crores), 6000,4000,2500,4500,3000
View SolutionRead the following information and five statements given below it carefully and answer the question which follow : Since 2008, migration to urban areas in search of employment has increased several times, surpassing marriage as the biggest person for migration in India.
(A) The wages and employment opportunities in rural parts of India have been at par with those in urban areas for last five years.
(B) Government and foreign MNCs have concentrated on development of job opportunities only in urban parts of the country.
(C ) Marriage was once the biggest reason for migration in India.
(D) More skilled professionals than manual labourers migrate to urban areas in search of employment.
(E) The urban areas attracting migrant are already facing and will further face a severe challenge accommodating increased population while the resources needed to do so remain the same.
Which of the statement numbered (A),(B),(C ),(D) and (E) directly follows from the given statement ?
1) Only A
2) Only E
3) Only C
4) Only D
5) Both A and B
View SolutionStudy the following pie-chart and answer the given question.
The pie-chait shows Budget Expenditure of a company in the year 2015 (percentage distribution) on different heads A. B.C.D&E.
If Rs 165 crore were spent in year 2018 on A, what would have been the total expenditure for that year (in 3 crores)?
View Solution
