The following pie chart gives he distribution of funds in a five year plan under the major heads of development expenditures:
Agriculture (A), Industry (B), Education (C), Employment (D) and Miscellaneous (E)
The total allocation is 36,000 (in crores of rupees).
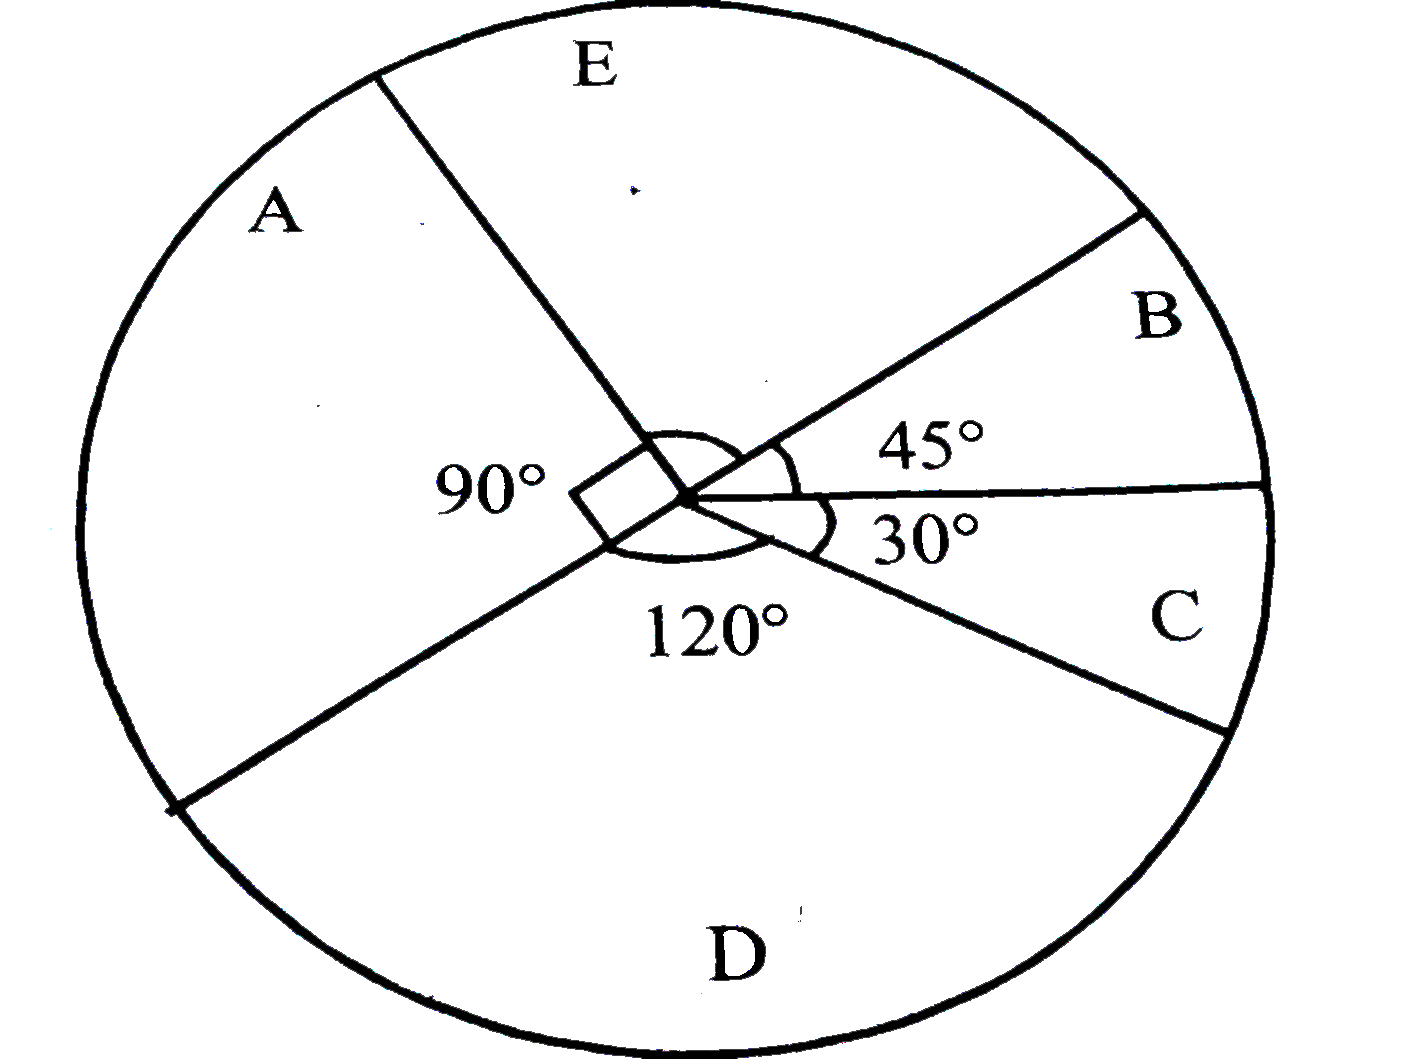
How much money (in crores) is allocated to Education?
3000
6000
9000
10800
The correct Answer is:A
Education : 3000
Topper's Solved these Questions
- SETS, RELATIONS, FUNCTIONS AND NUMBER SYSTEM BOOK - NDA PREVIOUS YEARSCHAPTER - SETS, RELATIONS, FUNCTIONS AND NUMBER SYSTEM EXERCISE - MCQ
271 Videos
- TRIGONOMETRY - RATIO & IDENTITY , TRIGONOMETRIC EQUATIONSBOOK - NDA PREVIOUS YEARSCHAPTER - TRIGONOMETRY - RATIO & IDENTITY , TRIGONOMETRIC EQUATIONSEXERCISE - MCQ
238 Videos
Similar Questions
The following pie chart gives he distribution of funds in a five year plan under the major heads of development expenditures:
Agriculture (A), Industry (B), Education (C), Employment (D) and Miscellaneous (E)
The total allocation is 36,000 (in crores of rupees).
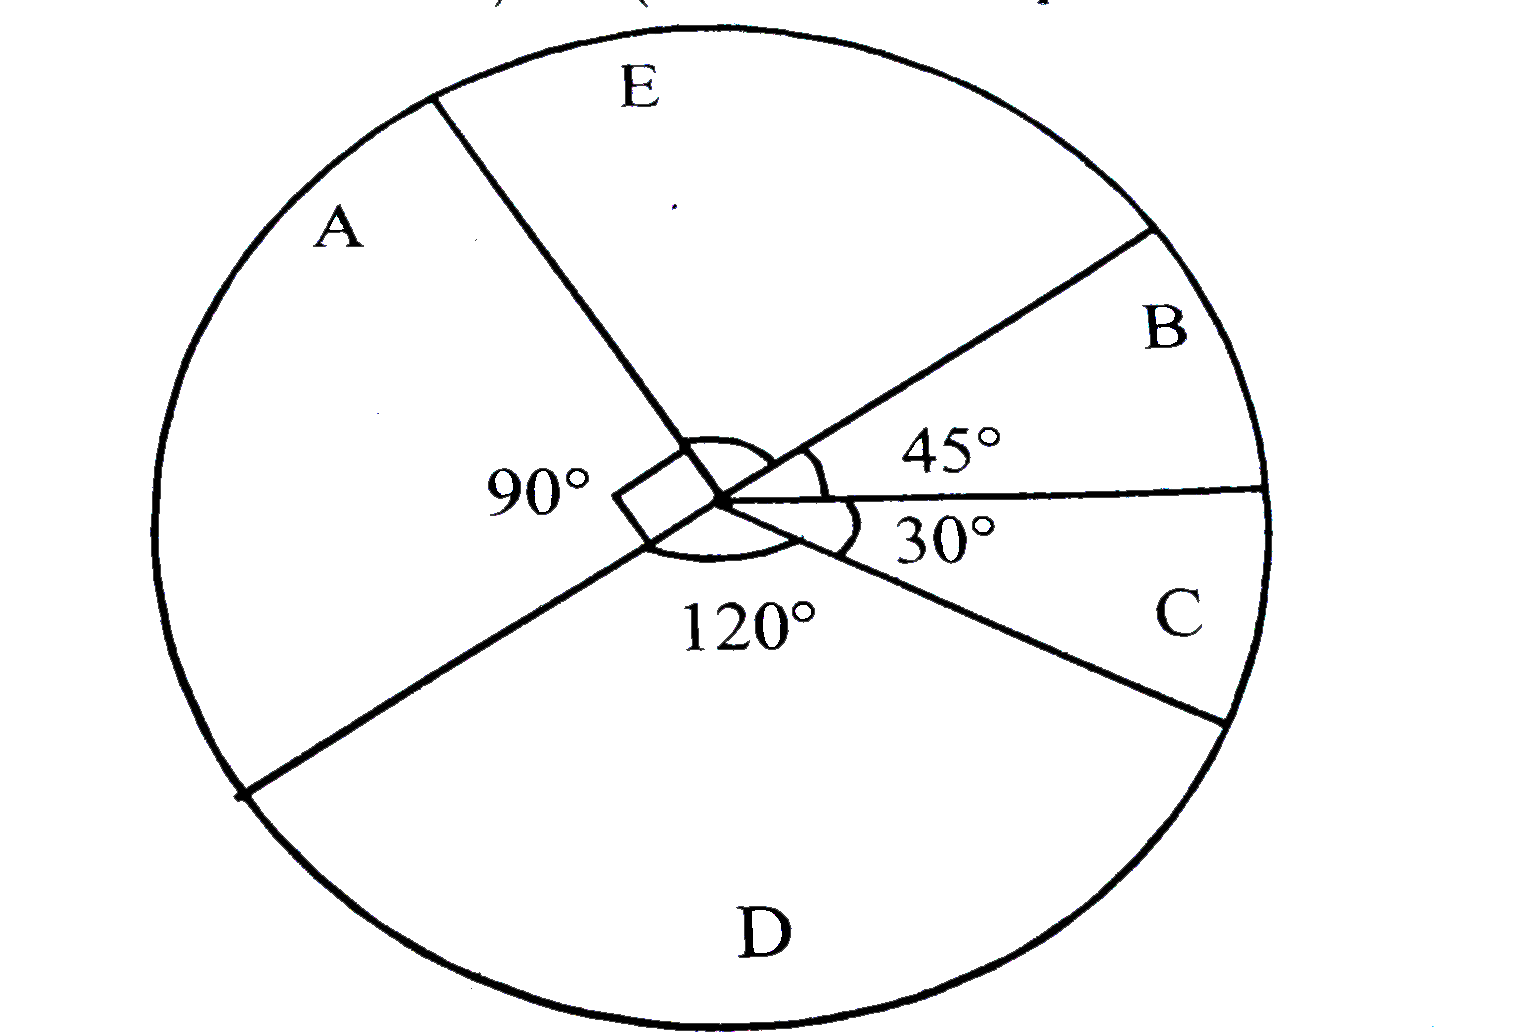
Which head is allocated maximum funds ?
View SolutionThe following pie chart depicts the expenditure of a state government under different heads,
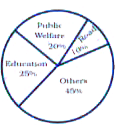
If the total spending is 10 crores, how much 20% do money was spent on roads?
View Solution
Knowledge Check
The following pie chart shows the expenditure of company XYZ in Q3 2015 on various heads.

If company XYZ has spent a total of 100 lakh crores on the various heads then how much did it spent on R & D (in lakh crores)A20B10C30D40
The following pie chart depicts the expenditure of a state government under different heads,(if the total spending is 10 crores)

How many times is the amount of money Others spent on education compared to the amount spent on roads?
View SolutionThe following pie chart shows the expenditure (in percentage) of the five companies P,Q,R,S and T in the year 2016 .
Total Expenditure = Rs. 48 crores
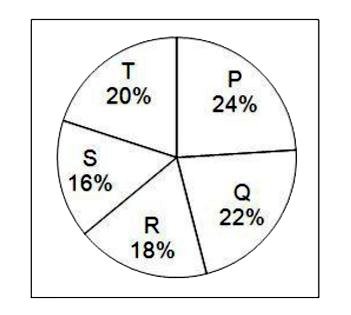
By how much percent expenditure of company Q and R together greater than that of company P?
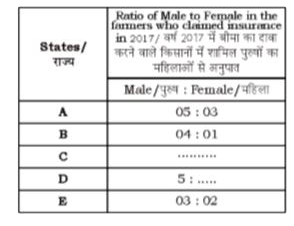
View SolutionThe following pie chart and table show the percentage distribution of farmers in 5 states A B C D E of a country who claimed insurance due to drought in the year 2017 and ratio of males to females to farmers in states, respectively
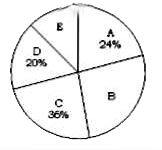
The number of farmers who claimed insurance C exceeds the total number of farmers in state E and state A together by 5280 What is the percentage of farmers who claimed insurance in state.
View SolutionDraw a pie-diagram to represent the following data on the proposed outlay during the fourth five-year plan. Items, Agriculture, Ind. and Minerals, Irrigation & Power, Communication, Miscellaneous Rupees (in crores), 6000,4000,2500,4500,3000
View SolutionDraw a pie-diagram to represent the following data on the proposed outlay during the fourth five-year plan. Items, Agriculture, Ind. and Minerals, Irrigation & Power, Communication, Miscellaneous Rupees (in crores), 6000, 4000, 2500, 4500, 3000
View SolutionThe following pie-chart shows the monthly expenditure of a man on various items. If he spends Rs. 16,000 per month, answer the following questions.
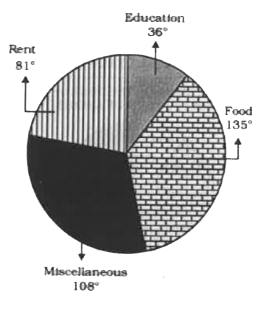
How much more does he spend on rent as compared to education ?
View Solution(Questions 15-19): The pie-chart shown below gives the distribution of land in a village under various food crops. Study the pie-chart carefully and answer the questions that follow: Distribution of areas (in acres) under various food crops (FIGURE) Which combination of three crops contribute to 50% of the total area under the food crops? (a) Wheat, Barley and Jowar (b) Rice, Wheat and Jowar (c) Rice, What and Barley (d) Bajra, Maize and Rice
View Solution
