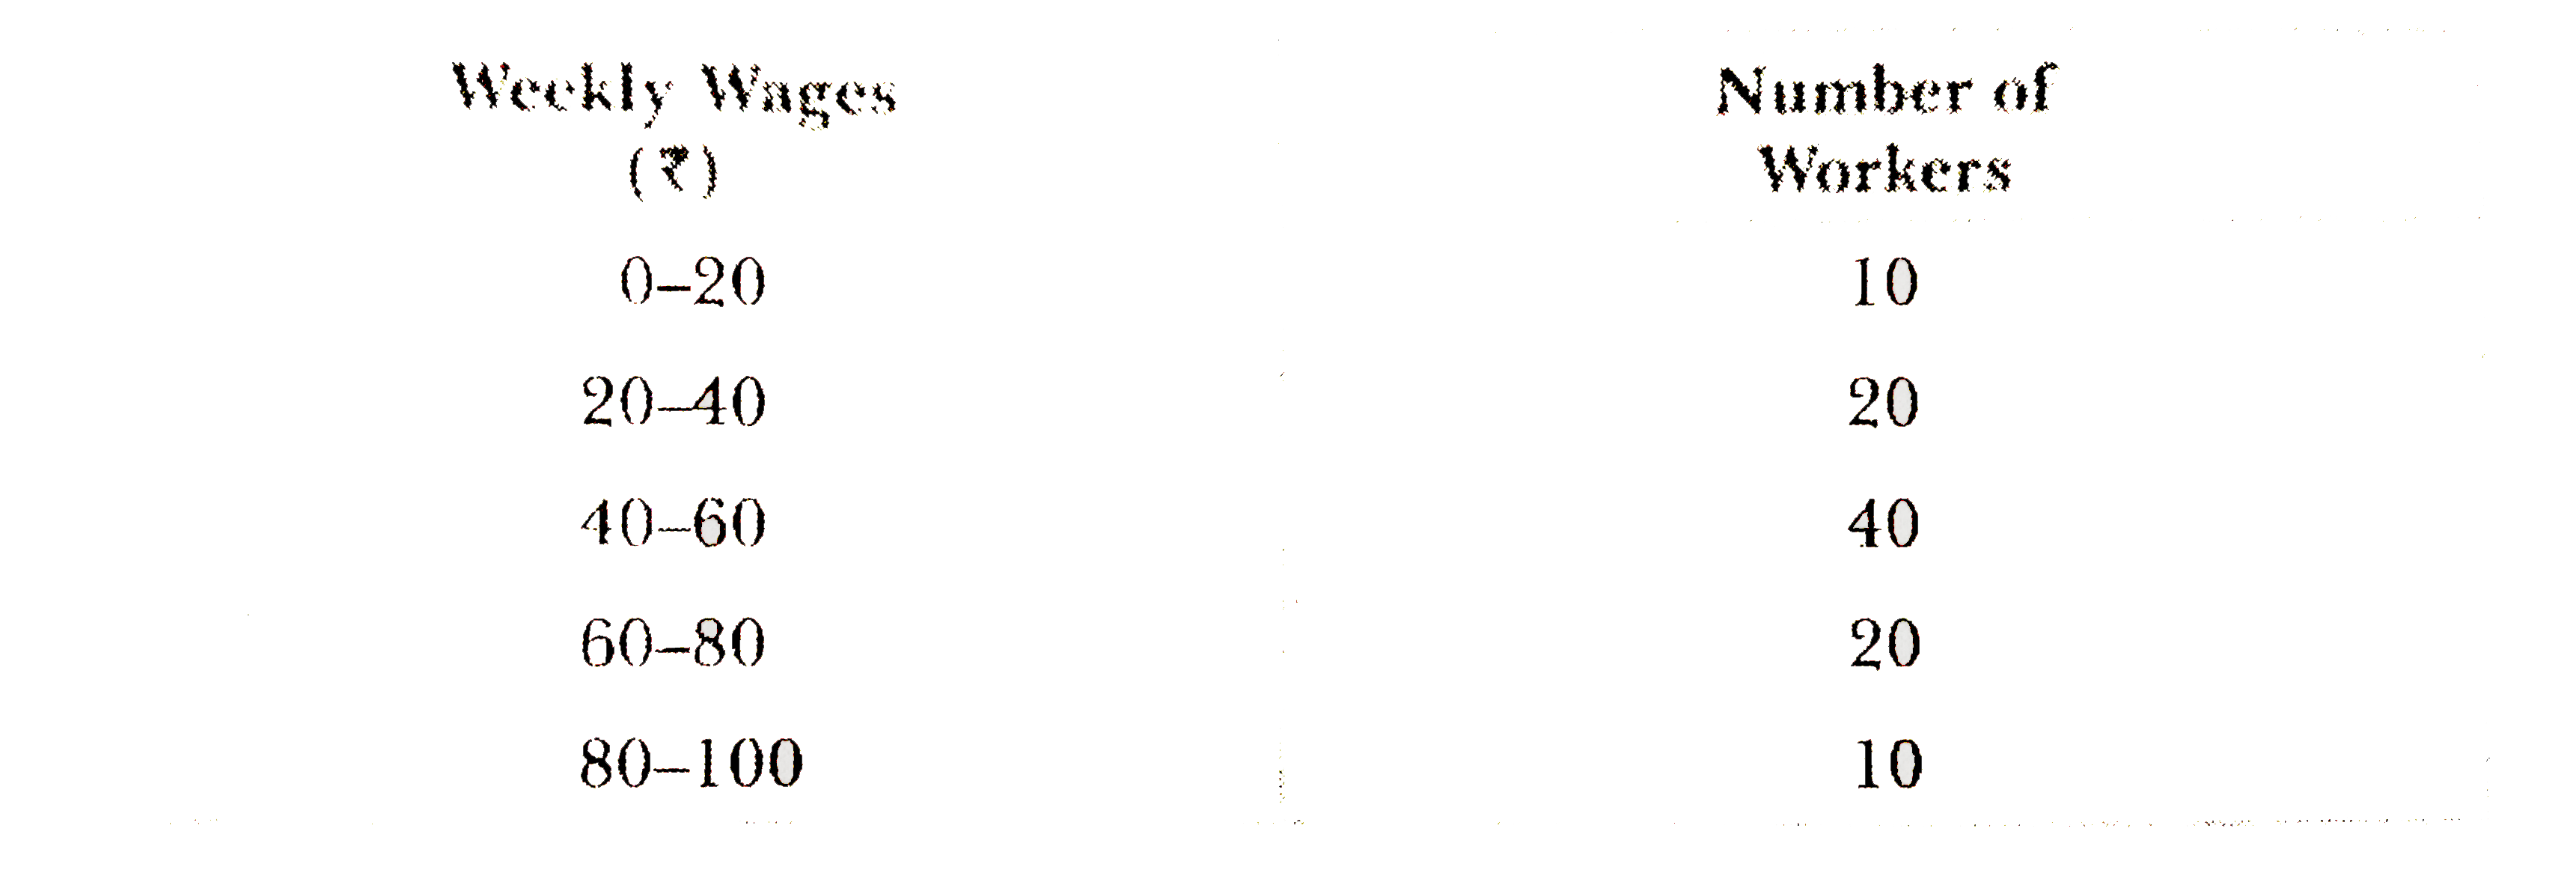
for given statistical data, the graphs for less than ogive and more than ogive are drawn. If the point at which the two curves intersect as P, then abscissa of point P gives the value of which one of the folloiwng measures of central tendency?
Median
Mean
Mode
Geometric Mean
The correct Answer is:A
Step by step video, text & image solution for for given statistical data, the graphs for less than ogive and more than ogive are drawn. If the point at which the two curves intersect as P, then abscissa of point P gives the value of which one of the folloiwng measures of central tendency? by Maths experts to help you in doubts & scoring excellent marks in Class 12 exams.
Updated on:21/07/2023Topper's Solved these Questions
- SETS, RELATIONS, FUNCTIONS AND NUMBER SYSTEM BOOK - NDA PREVIOUS YEARSCHAPTER - SETS, RELATIONS, FUNCTIONS AND NUMBER SYSTEM EXERCISE - MCQ
271 Videos
- TRIGONOMETRY - RATIO & IDENTITY , TRIGONOMETRIC EQUATIONSBOOK - NDA PREVIOUS YEARSCHAPTER - TRIGONOMETRY - RATIO & IDENTITY , TRIGONOMETRIC EQUATIONSEXERCISE - MCQ
238 Videos
Similar Questions
Knowledge Check
Simplify :- 45% of 1770 ÷ 3 = 657 - ?
Aa. 391.5Bb. 401.5Cc. 372.5Dd. 297.5Draw 'less than' and 'more than' ogive curves from the following data :
 AMediumBModeCArithmetic meanDnone of these
The 'less than' ogive curve and the 'more than' ogive curve intersect at
AmedianBmodeCarithmetic meanDNone of the above
Draw the 'less than' and 'more than' ogive on the same graph paper from the data given below :

View SolutionDraw the 'less than' and 'more than' ogive on the same graph paper from the data given below :

View SolutionNormals are drawn at points A,B,andC on the parabola y2=4x which intersect at P. The locus of the point P if the slope of the line joining the feet of two of them is 2, is
View SolutionIn which one of the following reactions, Kp is less than Kc?
View SolutionIf the 'less than type' ogive and 'more than type' ogive intersect each other at (20.5, 15.5) then the median of the given data is
View Solution
