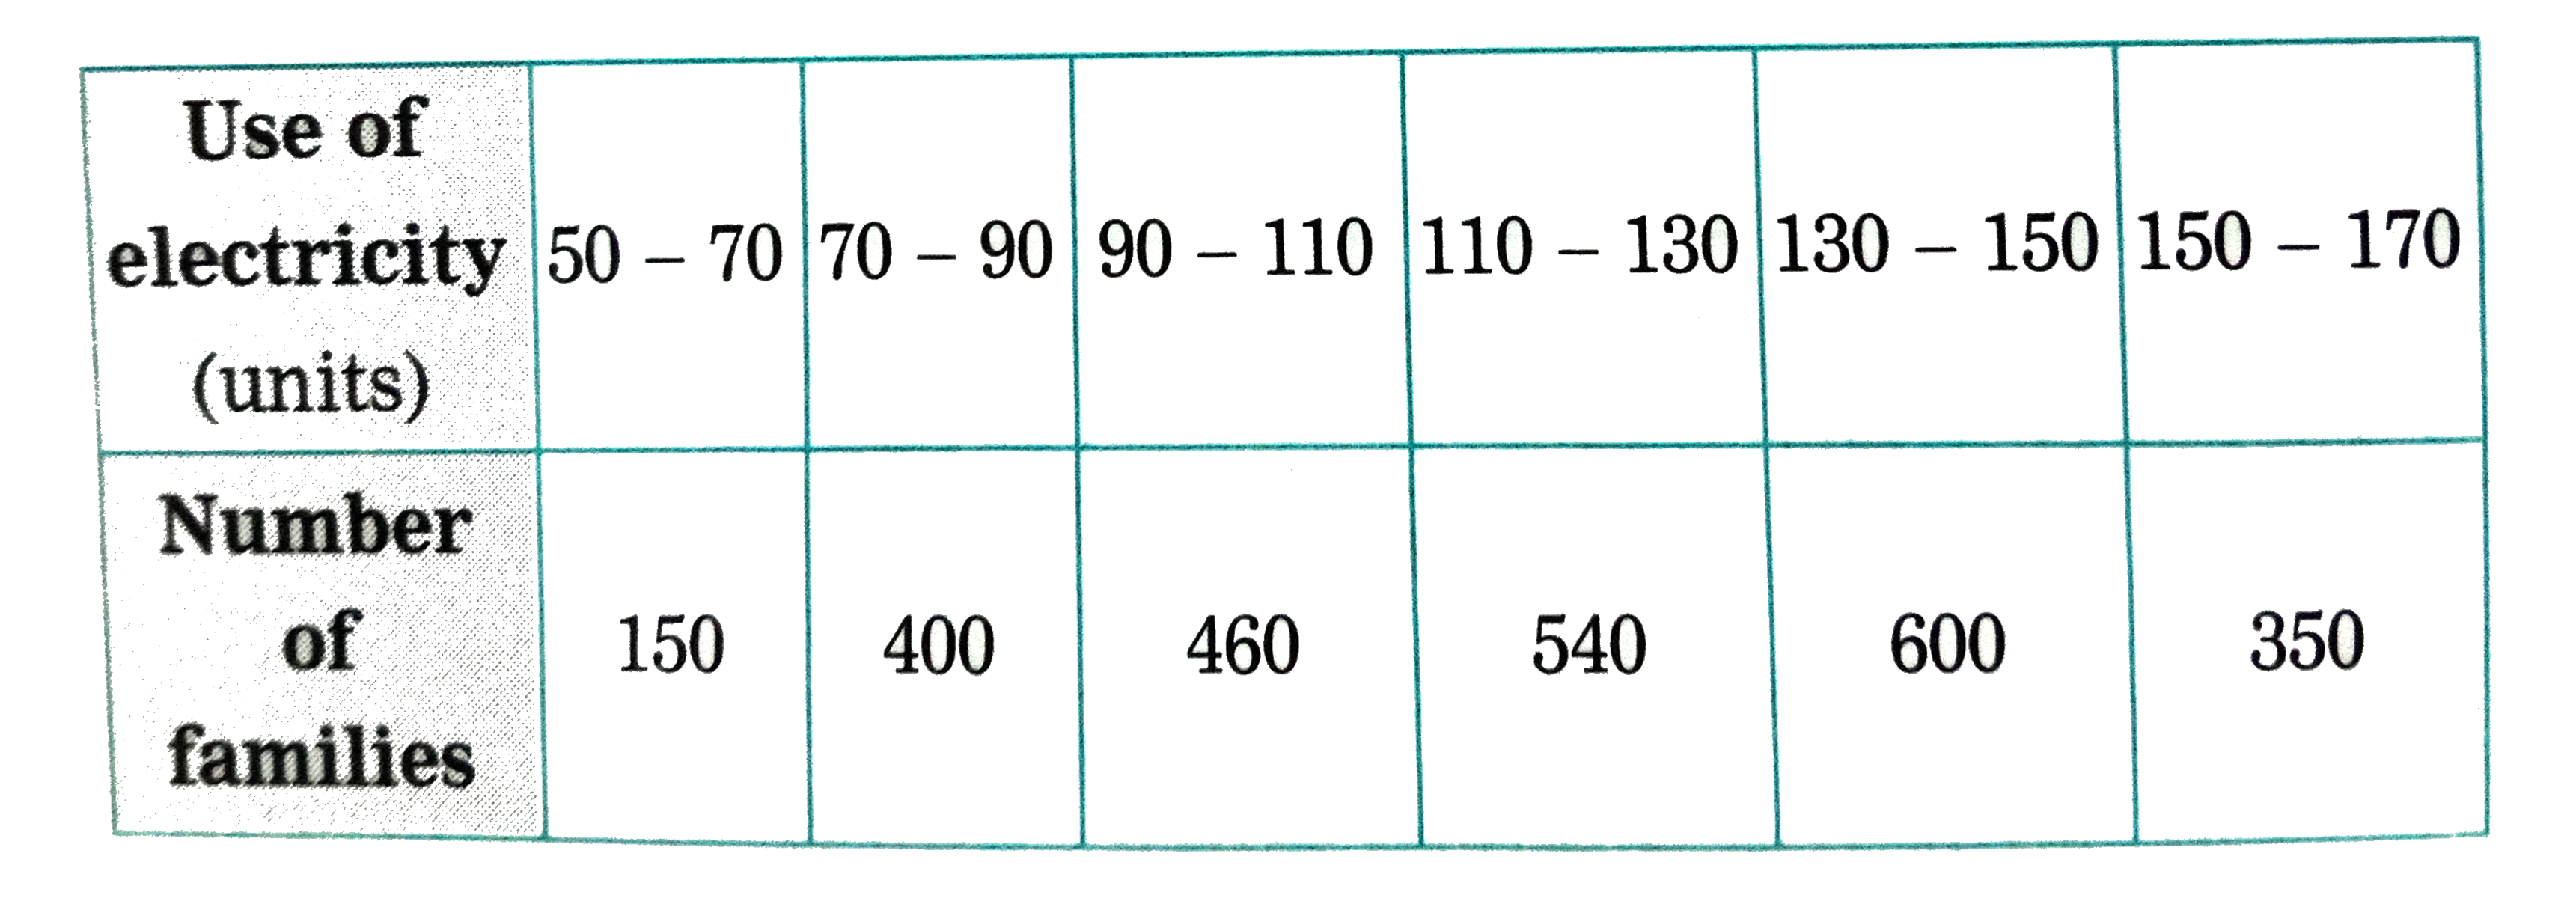
The daily wages of 50 workers in a factory are given below:

Construct a histogram to represent the above frequency distribution.
Step by step video & image solution for The daily wages of 50 workers in a factory are given below: Construct a histogram to represent the above frequency distribution. by Maths experts to help you in doubts & scoring excellent marks in Class 9 exams.
Updated on:21/07/2023Topper's Solved these Questions
- BAR GRAPH, HISTOGRAM AND FREQUENCY POLYGONBOOK - RS AGGARWALCHAPTER - BAR GRAPH, HISTOGRAM AND FREQUENCY POLYGONEXERCISE - EXERCISE 17A
12 Videos
- AREAS OF TRIANGLES AND QUADRILATERALSBOOK - RS AGGARWALCHAPTER - AREAS OF TRIANGLES AND QUADRILATERALSEXERCISE - Multiple Choice Questions (Mcq)
16 Videos
- CIRCLES BOOK - RS AGGARWALCHAPTER - CIRCLES EXERCISE - MULTIPLE CHOICE QUESTION(MCQ)
37 Videos
Similar Questions
Knowledge Check
The monthly salaries of 50 workers in a factory are given below :

Find the mean salary of workersArs 9,440BRs 9,990CRs 9,098DRs 9,198
Draw a histogram for the following frequency distribution.

View SolutionDraw the Histogram for the following frequency distribution.

View SolutionDraw a histogram representing the following distribution.

View SolutionDraw a histogram representing the following distribution.

View SolutionFind the mean of the daily wages of 60 workers in a factory as per given below
View SolutionDraw the histogram for the following frequency distribution :

View SolutionThe daily wages (in rupees) of 60 workers in a factory are given below
Find the mean daily wages

View Solution


