In a study of diabetic patients in a village, the following observations were noted.

Represent the above data by a frequency polygon.
Step by step video & image solution for In a study of diabetic patients in a village, the following observations were noted. Represent the above data by a frequency polygon. by Maths experts to help you in doubts & scoring excellent marks in Class 9 exams.
Updated on:21/07/2023Topper's Solved these Questions
- BAR GRAPH, HISTOGRAM AND FREQUENCY POLYGONBOOK - RS AGGARWALCHAPTER - BAR GRAPH, HISTOGRAM AND FREQUENCY POLYGONEXERCISE - EXERCISE 17A
12 Videos
- AREAS OF TRIANGLES AND QUADRILATERALSBOOK - RS AGGARWALCHAPTER - AREAS OF TRIANGLES AND QUADRILATERALSEXERCISE - Multiple Choice Questions (Mcq)
16 Videos
- CIRCLES BOOK - RS AGGARWALCHAPTER - CIRCLES EXERCISE - MULTIPLE CHOICE QUESTION(MCQ)
37 Videos
Similar Questions
Knowledge Check
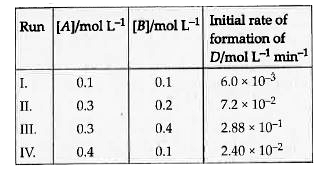
During the kinetic study of the reaction, 2A + B → C + D, following results were obtained :

Based on the above data which one of the following is correct?ARate = k[A]2[B]BRate = k[A][B]CRate = k[A]2[B]2DRate = k[A][B]2
Show the following data by a frequency polygon.

View SolutionRepresent the following data by frequency curve :

View SolutionPresent the following data in the form of a frequency polygon :

View SolutionIn a study of the cases of diabetes the following data was obtained.

Draw a less than ogive for above data .
View SolutionAs the number of observations and classes increases, the shape of a frequency polygon
View SolutionRepresent the following data by histogram:

View Solution. The following data shows the year wise strength of a school.Represent the the above data by bar graph:
View Solution

