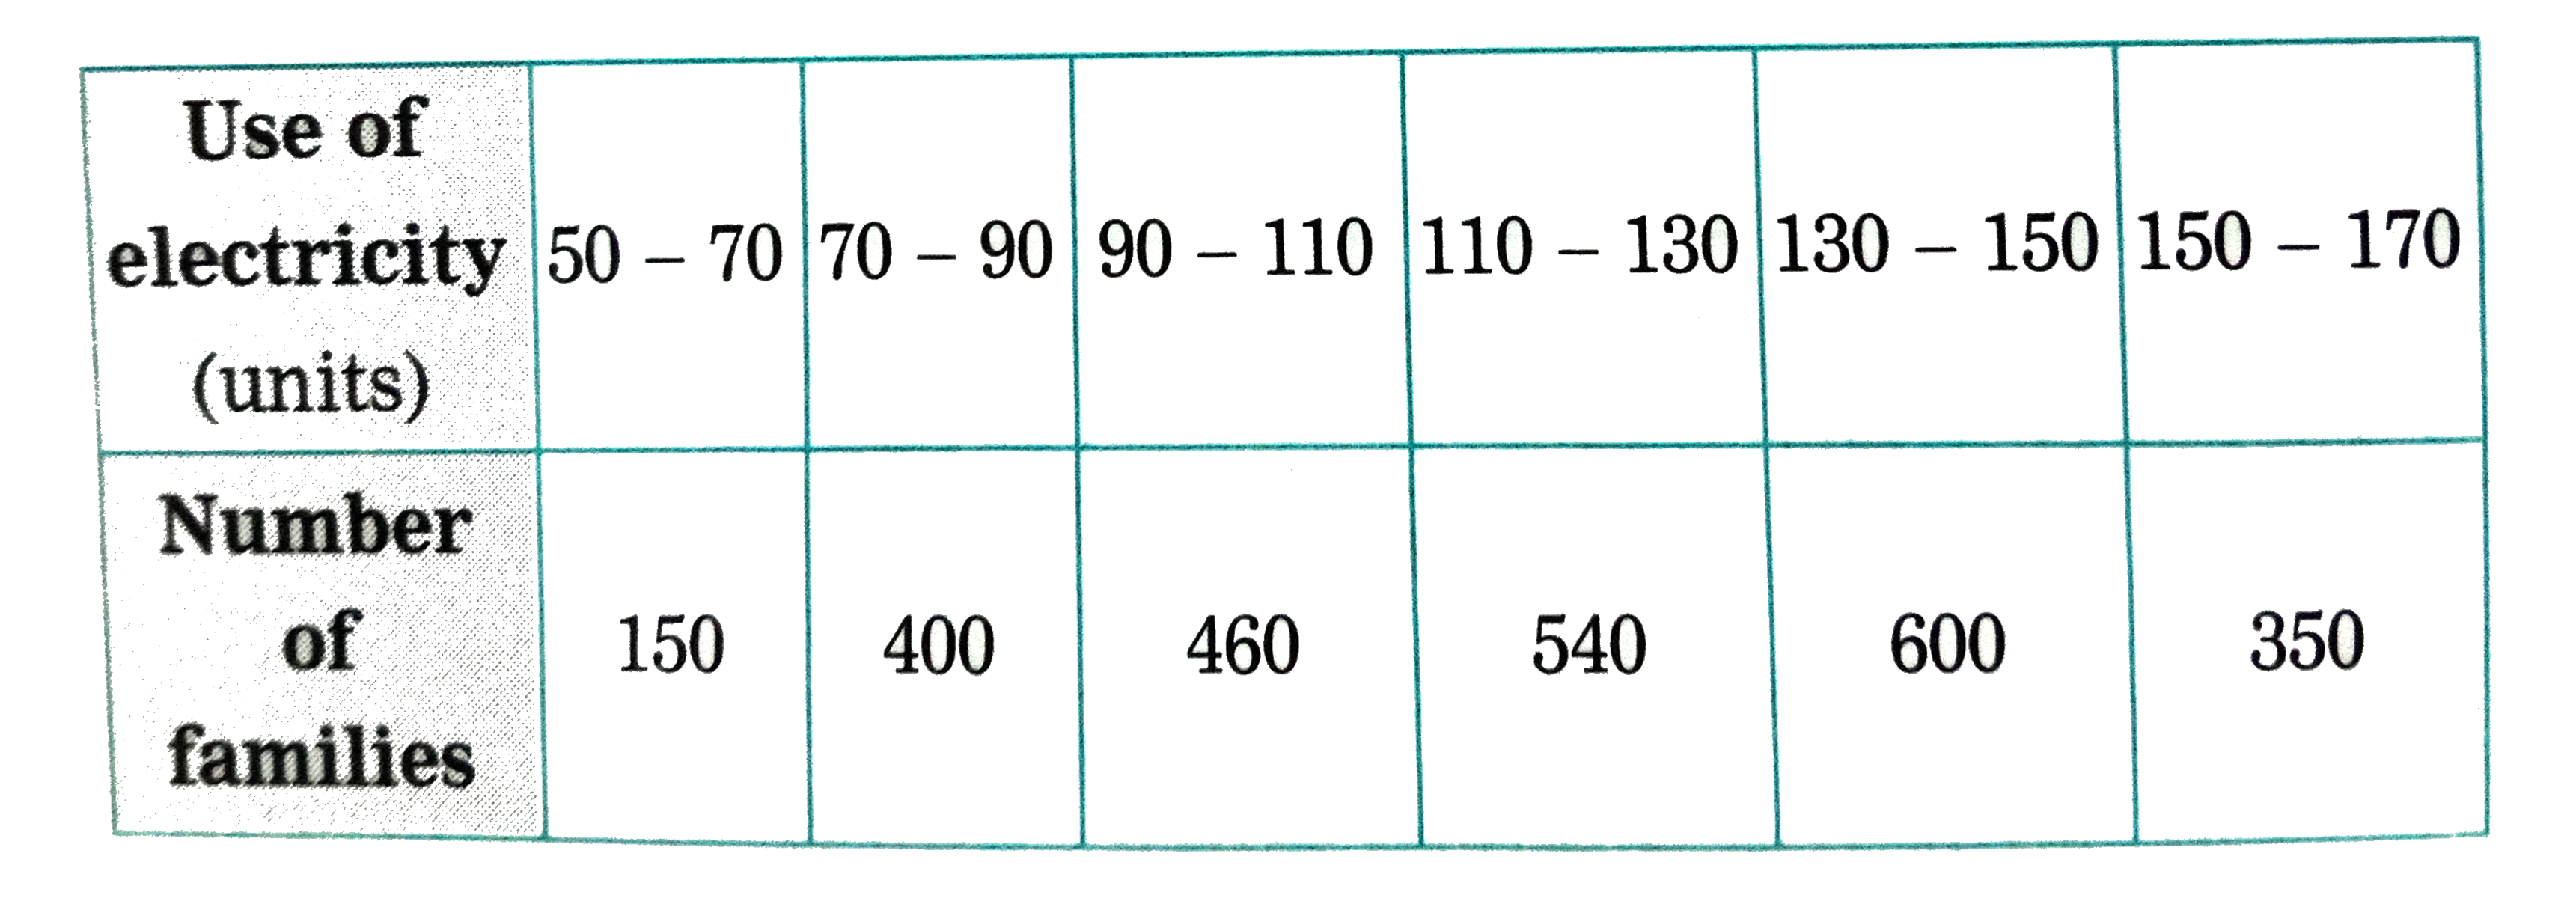
Construct a histogram for the following frequency distribution:

Video Solution
Text Solution
Convert the given inclusive form into an exclusive form by taking intervals (4.5-12.5).
(12.5-20.5), (20.5-28.5),(28.5-36.5), (36.5-44.5) and (44.5-52.5)
|
Updated on:21/07/2023
Topper's Solved these Questions
- BOOK - RS AGGARWALCHAPTER - BAR GRAPH, HISTOGRAM AND FREQUENCY POLYGONEXERCISE - EXERCISE 17A12videos
BAR GRAPH, HISTOGRAM AND FREQUENCY POLYGON
- BOOK - RS AGGARWALCHAPTER - AREAS OF TRIANGLES AND QUADRILATERALSEXERCISE - Multiple Choice Questions (Mcq)16videos
AREAS OF TRIANGLES AND QUADRILATERALS
- BOOK - RS AGGARWALCHAPTER - CIRCLES EXERCISE - MULTIPLE CHOICE QUESTION(MCQ)37videos
CIRCLES
Similar Questions
Knowledge Check
- Question 1 - Select One
To draw a histogram to represent the following frequency distribution.
Class Interval 5−1010−1515−2525−4545−75
Frequency 6 12 10 8 15
The adjusted frequency for the class 25−45 isA6B5C3D2
Draw the Histogram for the following frequency distribution.
 View Solution
Draw a histogram of the following frequency distribution and use it to calculate the mode
View SolutionConstruct a histogram from the following data :
 View Solution
Construct a histogram for the frequency distribution below:
Class Interval10−2020−3030−4040−5050−60Frequency63847View SolutionConstruct a histogram for the following distribution:
 View Solution
Find the median for the following frequency distribution:
 View Solution
Find the median for the following frequency distribution:
 View Solution


