The following table shows the number of illiterate persons in the age group (10-58 years) in a town:

Draw a histogram to represent the above data.
Step by step video & image solution for The following table shows the number of illiterate persons in the age group (10-58 years) in a town: Draw a histogram to represent the above data. by Maths experts to help you in doubts & scoring excellent marks in Class 9 exams.
Updated on:21/07/2023Topper's Solved these Questions
- BAR GRAPH, HISTOGRAM AND FREQUENCY POLYGONBOOK - RS AGGARWALCHAPTER - BAR GRAPH, HISTOGRAM AND FREQUENCY POLYGONEXERCISE - EXERCISE 17A
12 Videos
- AREAS OF TRIANGLES AND QUADRILATERALSBOOK - RS AGGARWALCHAPTER - AREAS OF TRIANGLES AND QUADRILATERALSEXERCISE - Multiple Choice Questions (Mcq)
16 Videos
- CIRCLES BOOK - RS AGGARWALCHAPTER - CIRCLES EXERCISE - MULTIPLE CHOICE QUESTION(MCQ)
37 Videos
Similar Questions
Draw a histogram to represent the following data.

View SolutionThe given table presents the number of illiterate males in the age group (10-34) in a town.

Draw a histogram to represent the above data.
View SolutionDraw the histogram to represent the following data.

View SolutionThe following table shows the number of illitrate persons in the age group (10-58 Years) in a town. Represents the given data by means of a histogram.

View SolutionThe following table shows the number of students in different classes of a high school. Draw a histogram to represent the given data.
ClassesVIVIIVIIIIXXNumber of students3742355048
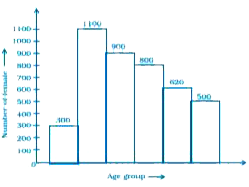
View SolutionThe below histogram shows the number of literate females in the age group of 10 to 40 years in a town.

In which age group are literate females the least?
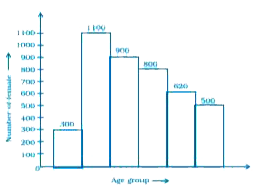
View SolutionThe below histogram shows the number of literate females in the age group of 10 to 40 years in a town.

What is the classes width?
View SolutionThe following table shows the marks secored by a student in annual examination in various subjects. Draw a histogram to represent the given data.
SubjectTeluguHindiEnglishMathsScienceSocial StudiesMarks807482949088
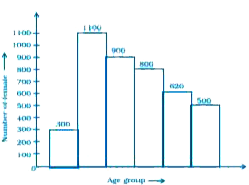
View SolutionThe below histogram shows the number of literate females in the age group of 10 to 40 years in a town.

In which age group is the number of literate females the highest?
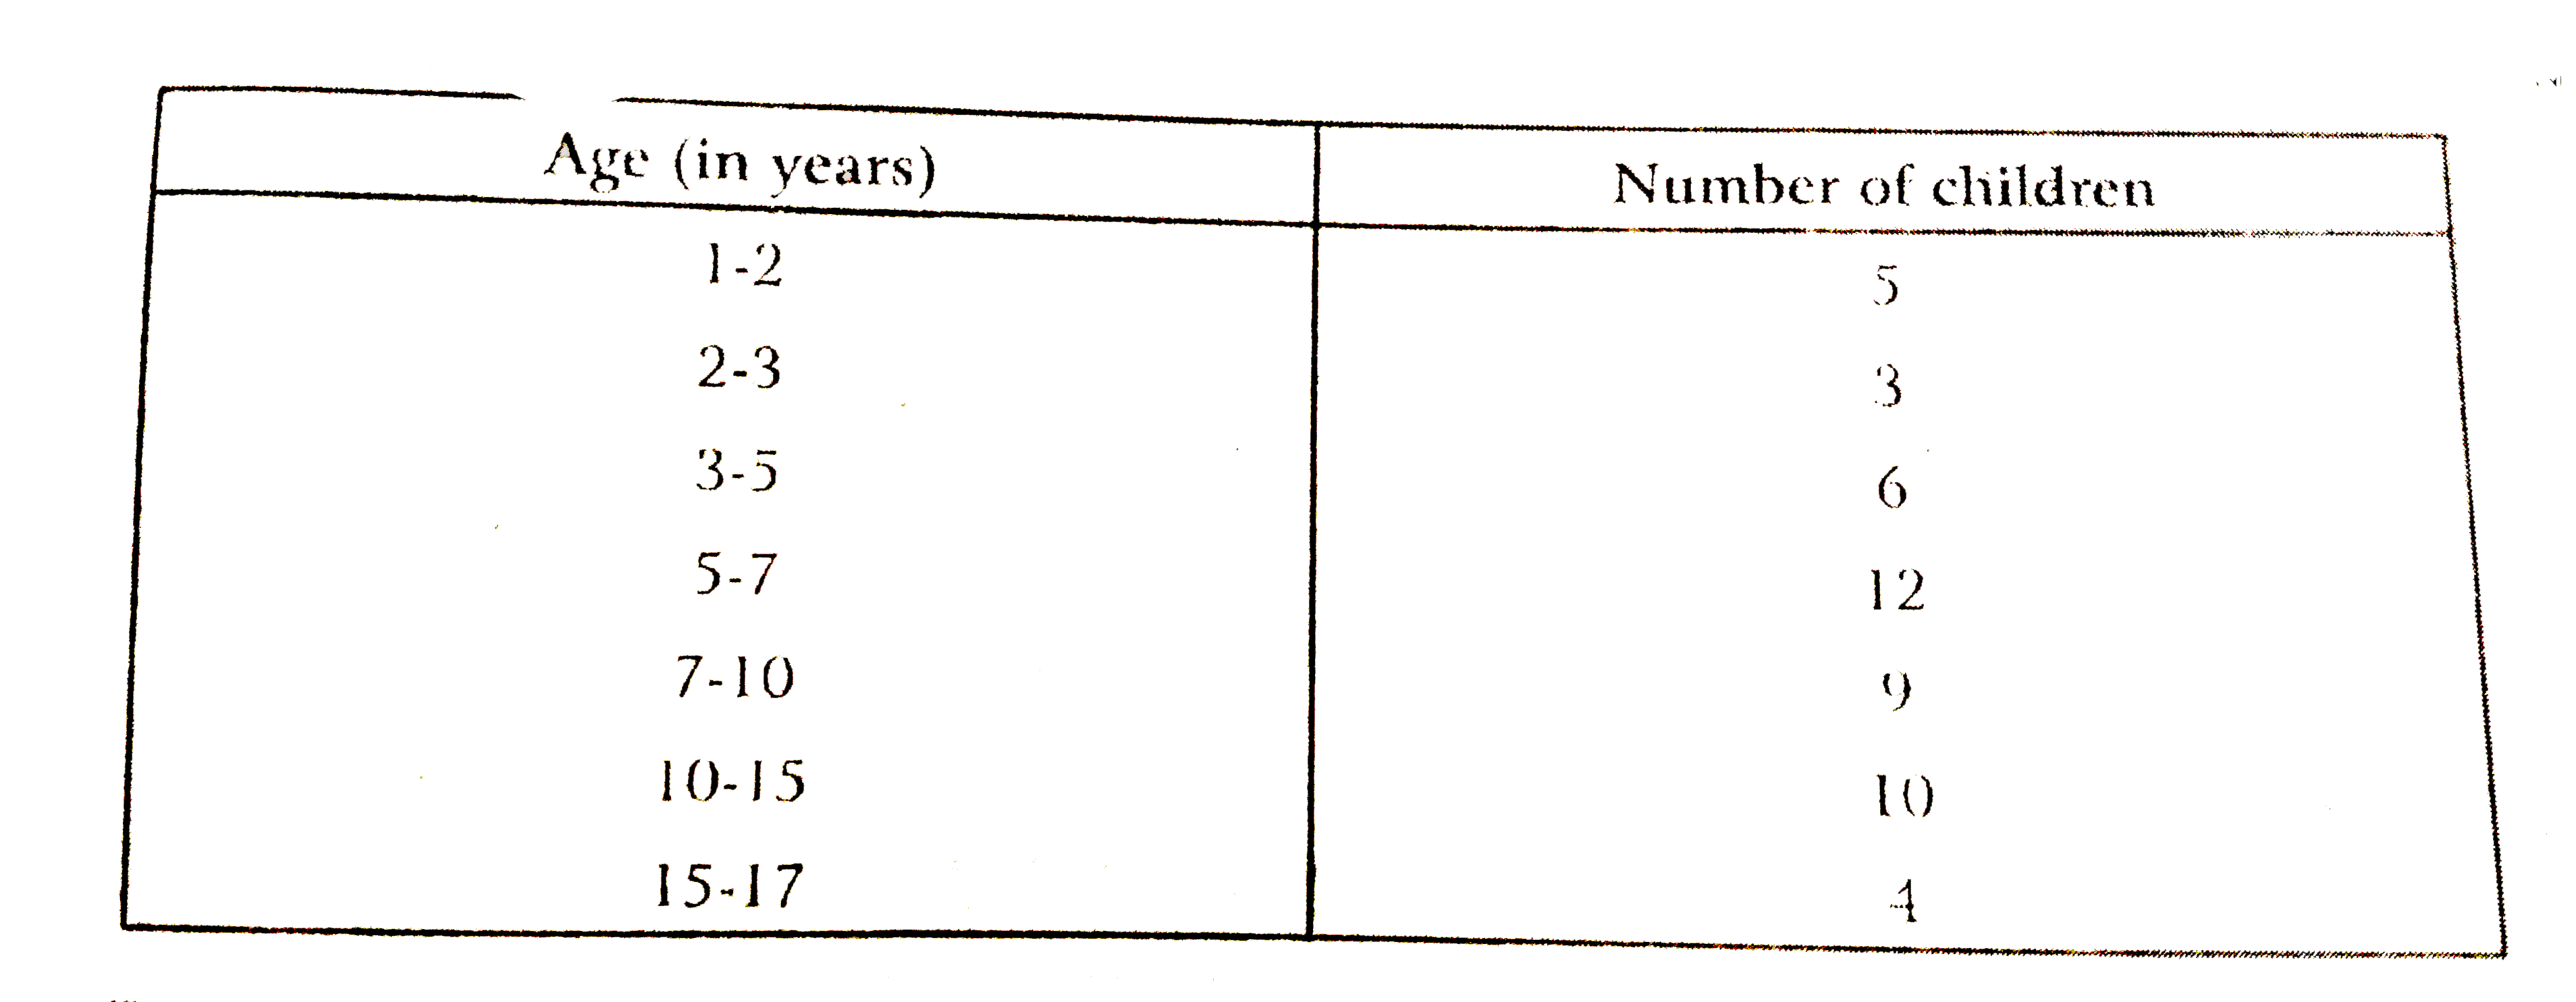
View SolutionA random survey of the number of children of various are groups playing in park was found as follows :

Draw a histogram to represent the data above.
View Solution
