Given below is the frequency distribution of the heights pof the players in a school

Find the average height of the maximum number of students?
The given data is an inclusive series.So, we convert it into an eaculsive form,as given below .

Clearly, the class 165.5-168.5 has maximum frequency , so its the modal class.∴xk=165.5,fk−1=127andh=3
Mode,M0=xk+{h×(fk−fk−1)(2fk−fk−1−fk+1)}
=165.+{3×(142−118)(2×142−118−127)}
=165.5+{3×2439}=165.5+2413
=165.5+1.85=167.35
Thus , modal height =167.35 cm
This mens that the height of maximum number of players in the school is cm (approx)
Topper's Solved these Questions
- BOOK - RS AGGARWALCHAPTER - MEAN,MEDAN,MODE OF GROUPED,DATA CUMULATIVE FREQUENCY GRAPH AND OGIVE EXERCISE - MISCELLANEOUS QUESTIONS ON MEAN,MODE AND MEDIAN1videos
MEAN,MEDAN,MODE OF GROUPED,DATA CUMULATIVE FREQUENCY GRAPH AND OGIVE
- BOOK - RS AGGARWALCHAPTER - MEAN,MEDAN,MODE OF GROUPED,DATA CUMULATIVE FREQUENCY GRAPH AND OGIVE EXERCISE - Exercise 18A2videos
MEAN,MEDAN,MODE OF GROUPED,DATA CUMULATIVE FREQUENCY GRAPH AND OGIVE
- BOOK - RS AGGARWALCHAPTER - MEAN,MEDAN,MODE OF GROUPED,DATA CUMULATIVE FREQUENCY GRAPH AND OGIVE EXERCISE - Test Yourself18videos
MEAN,MEDAN,MODE OF GROUPED,DATA CUMULATIVE FREQUENCY GRAPH AND OGIVE
- BOOK - RS AGGARWALCHAPTER - LINEAR EQUATIONS IN TWO VARIABLES EXERCISE - QUESTION2videos
LINEAR EQUATIONS IN TWO VARIABLES
- BOOK - RS AGGARWALCHAPTER - PERIMETER AND AREA OF PLANE FIGURES EXERCISE - TEST YOURSELF (SHORT -ANSWER QUESTIONS)1videos
PERIMETER AND AREA OF PLANE FIGURES
Similar Questions
Knowledge Check
- Question 1 - Select One
In the following frequency distribution, find the median class.

What is the value of median height ?A145.67B157.67C155.83D159.67 - Question 2 - Select One
In the following frequency distribution, find the median class.

What is the value of mean height ?A155.625B156.250C158.500D159.275
The following distributions represent the height of 160 studens of a class :

Find the modal heightView SolutionThe ages (in years) of 50 players of a school are given below
Find the mean height
 View Solution
The following table shows frequency distribution of the number of saplings planted by the students of a school :

Find the modal number of saplings planted.View SolutionBelow is the given frequency distribution of words in an essay:

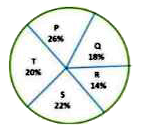
Find the mean number of words written.View SolutionThe following pie-chart shows the percentage-wise distribution of the number of students in five different schools P, Q, R, S and T. The total number of students in all five schools together is 8400.

Find the average number of students in schools R and S together.View SolutionThe average height of 20 boys is 120 cm and the average height of 10 girls is 117 cm. Find the average height of these 30 students.
View Solution


