The table given below shows the frequency distribution of the scores obtained by 200 candidates in a BCA entrance examination.

Draw cumulative frequency curves by using ( i) 'less than' series and (ii) 'more than' series.
Hence, find the median
Less Than Series:
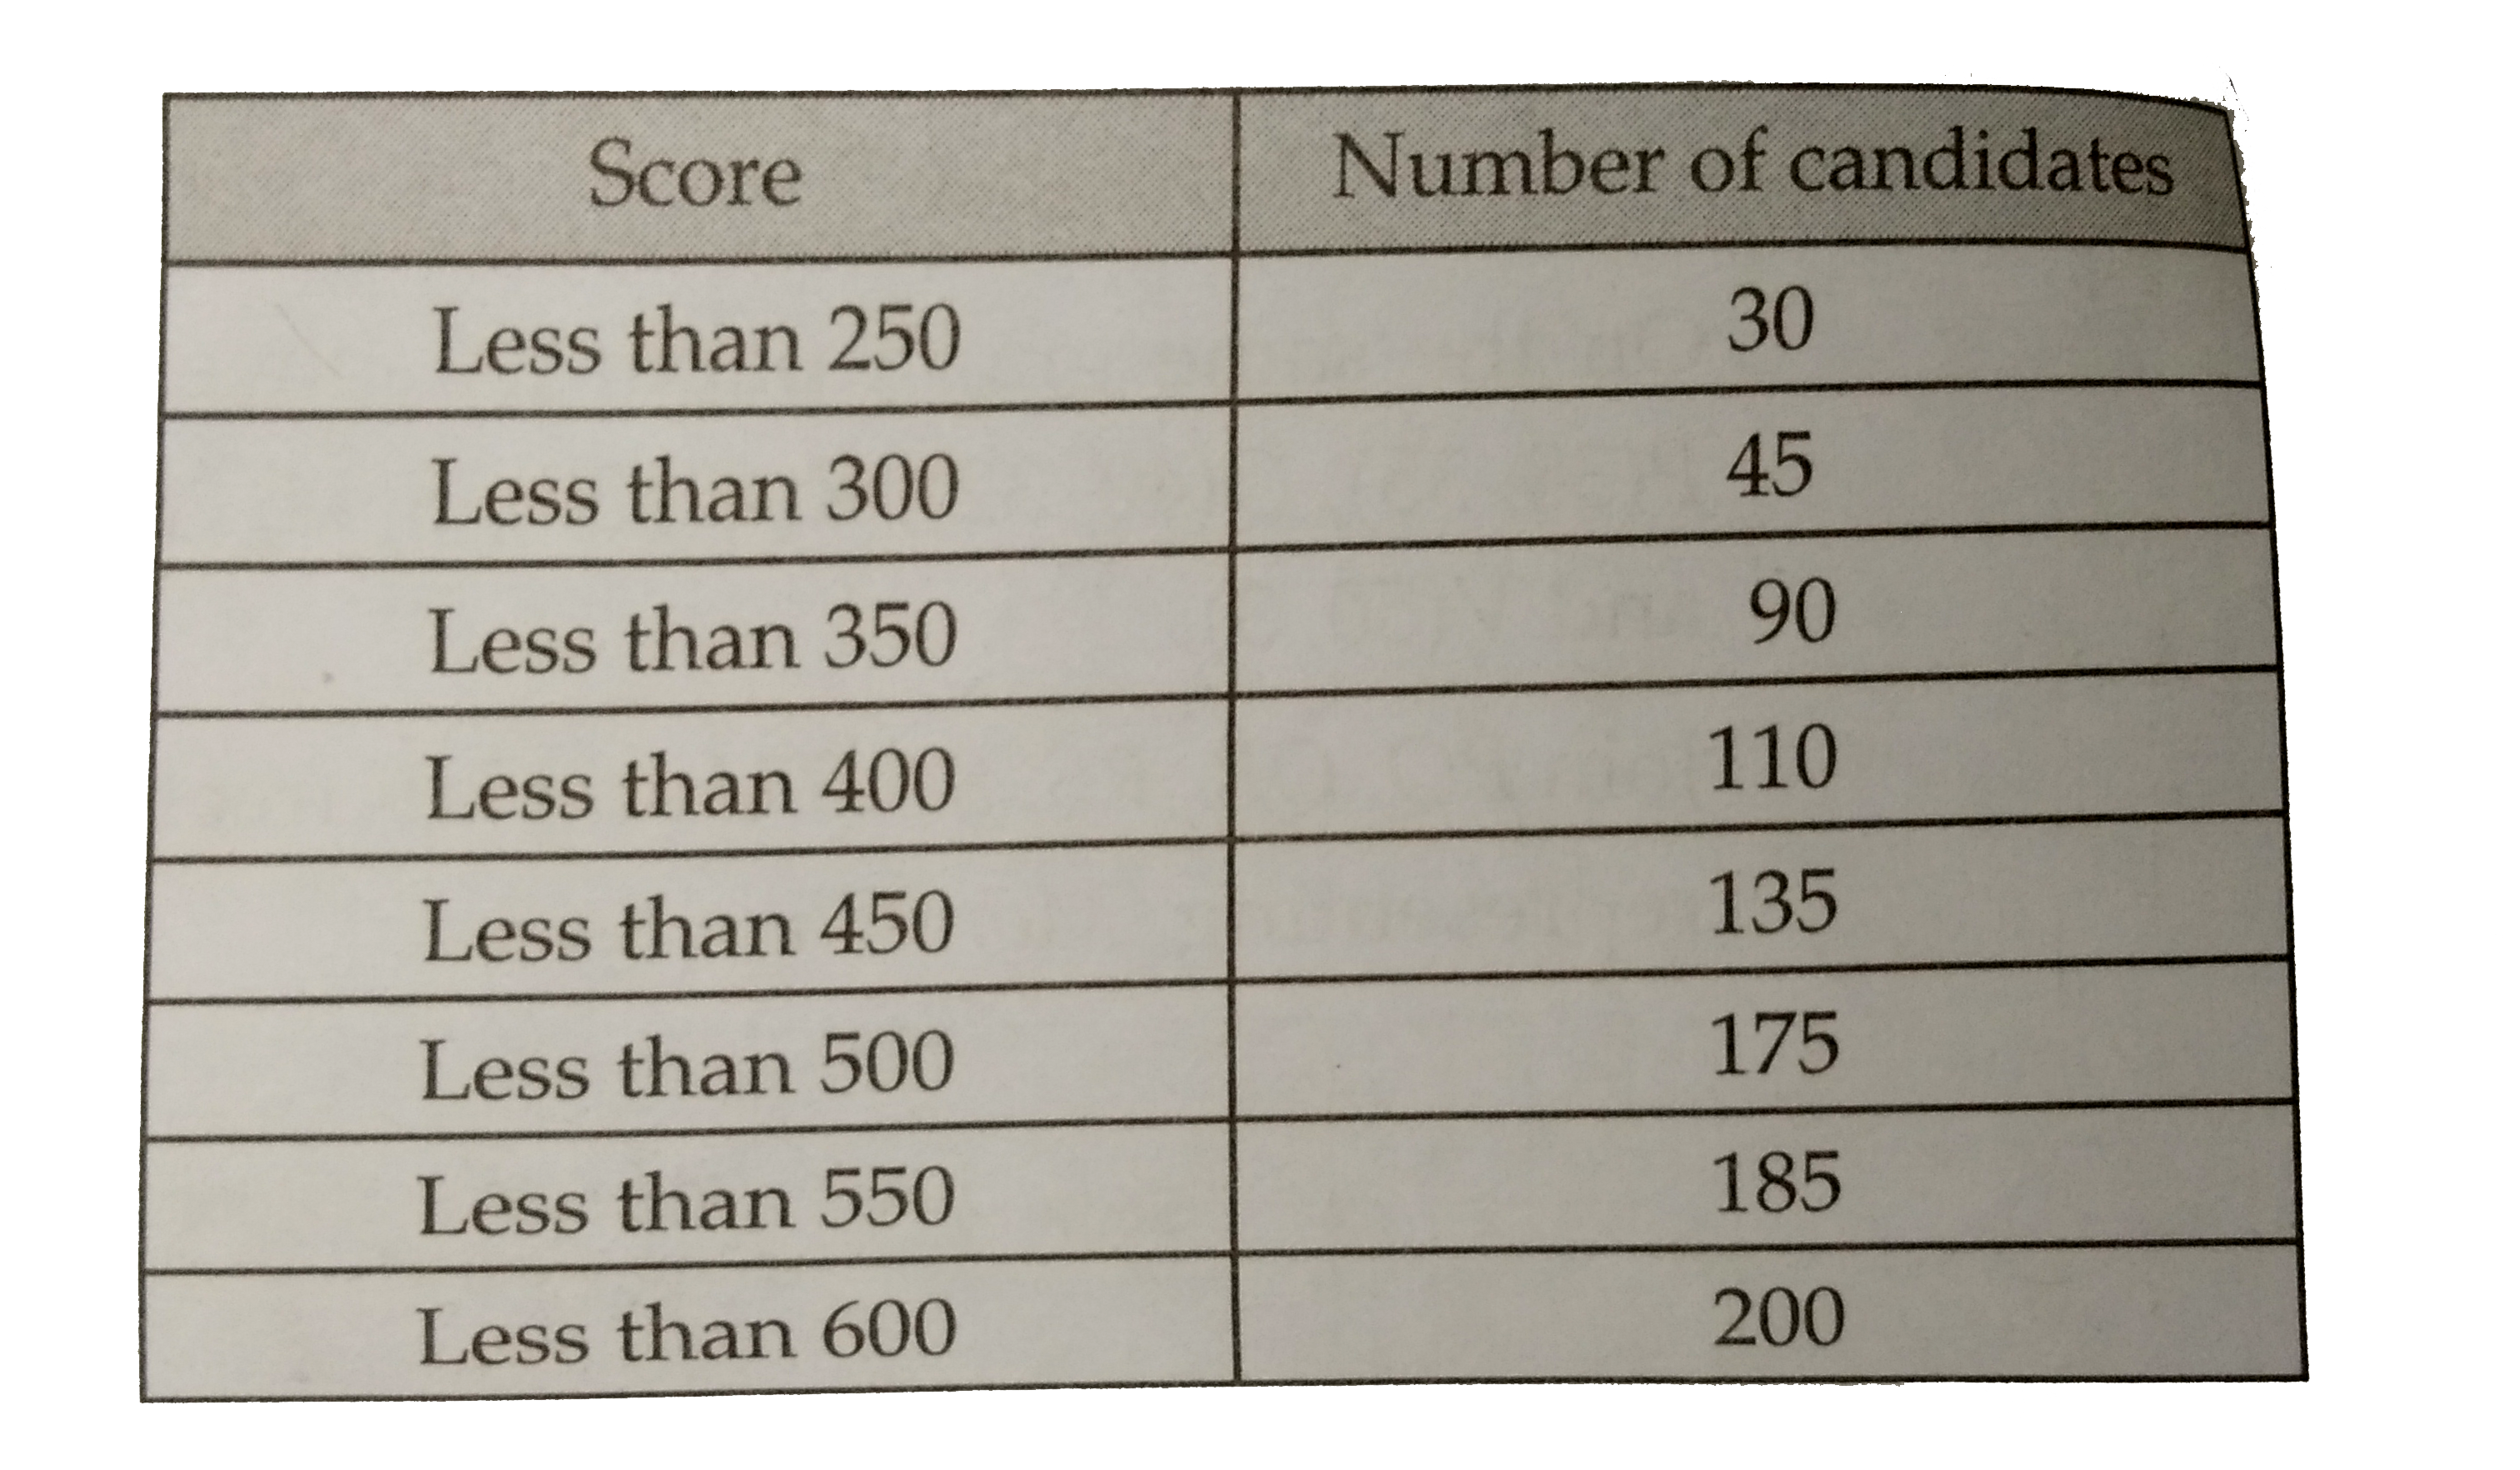
We may prepare the less than series as under.
Scale:
We plot the points A(250, 30), B(300, 45), C(350, 90), D(400, 110), E(450, 135), F(500, 175), G(550, 185) and H(600, 200) on a graph paper.
Join AB, BC, CD, DE, EF, FG and GH freehand to get the curve representing 'Less Than Series'.
(ii) More Than Series:
We may prepare the more than series as under
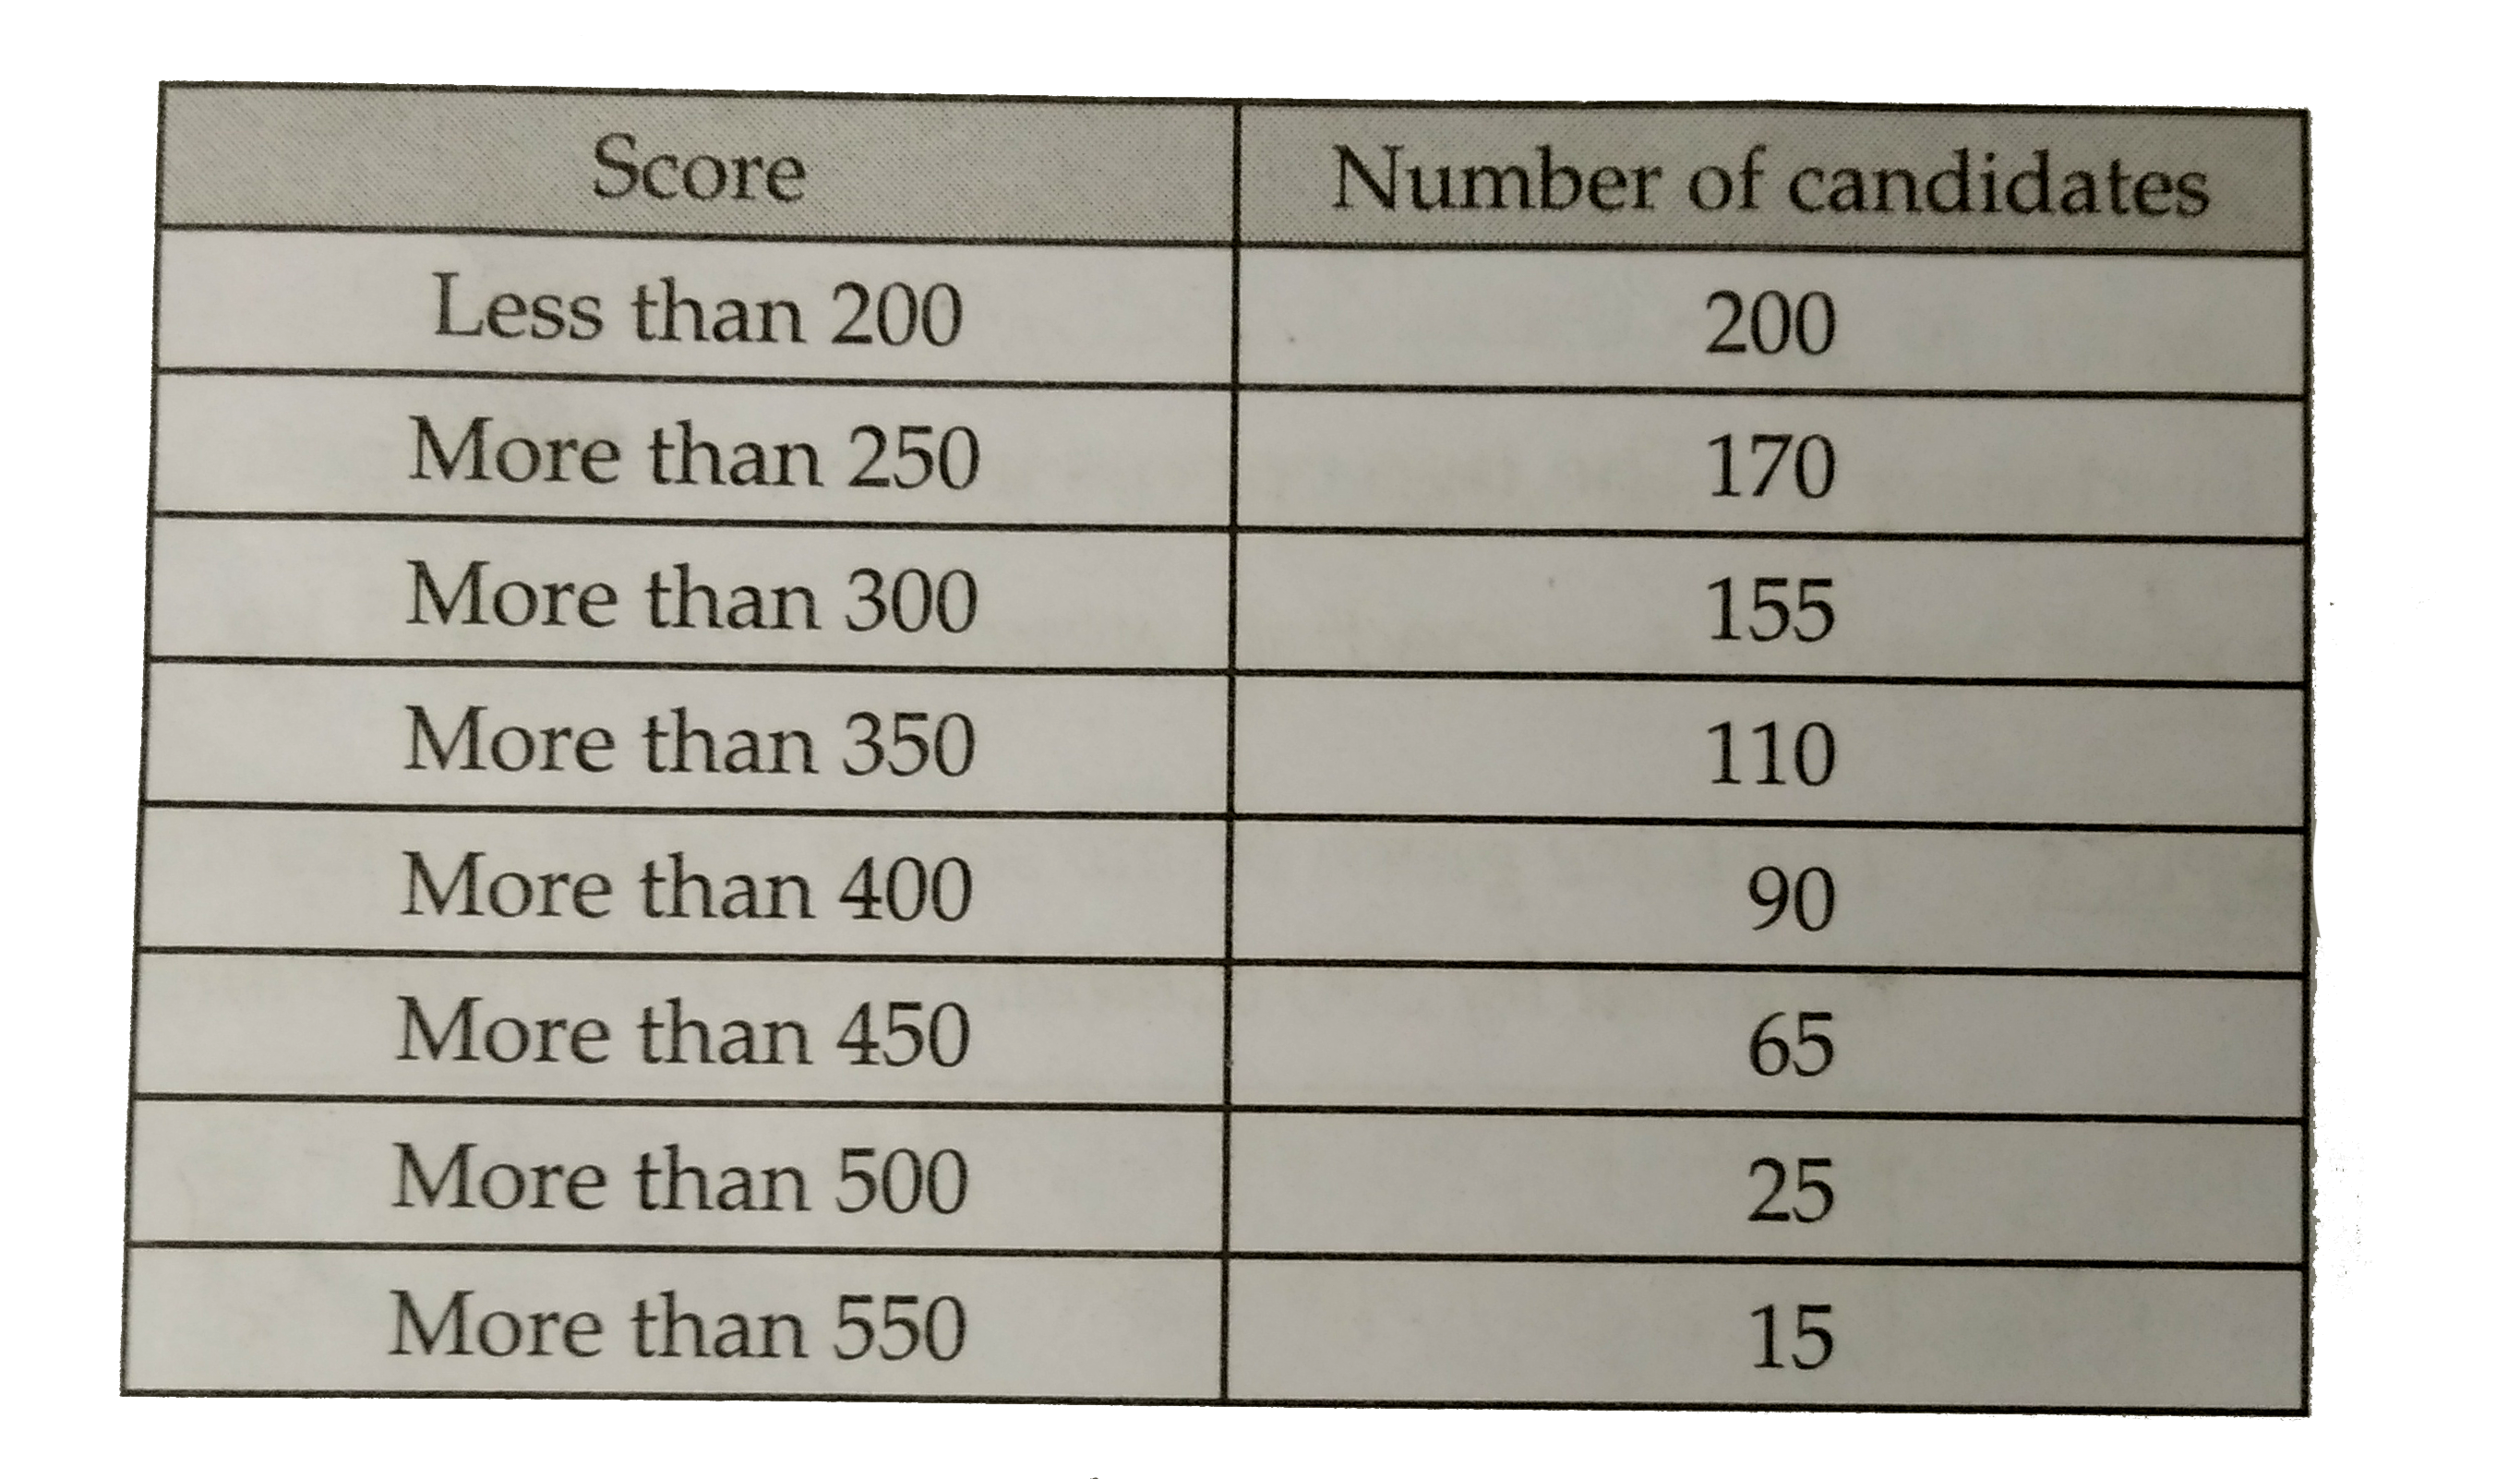
Now, on the same graph paper as above, we plot the points P(200, 200), Q(250, 170), R(300, 155), 5(350, 110), T(400, 90), U(450, 65), V(500, 25), W(550, 15).
Join PQ, QR, RS, ST, TU, UV and VW freehand to get the curve representing 'More Than Series'.
The two curves intersect at the points L. Draw LM OX cutting the x-axis at M
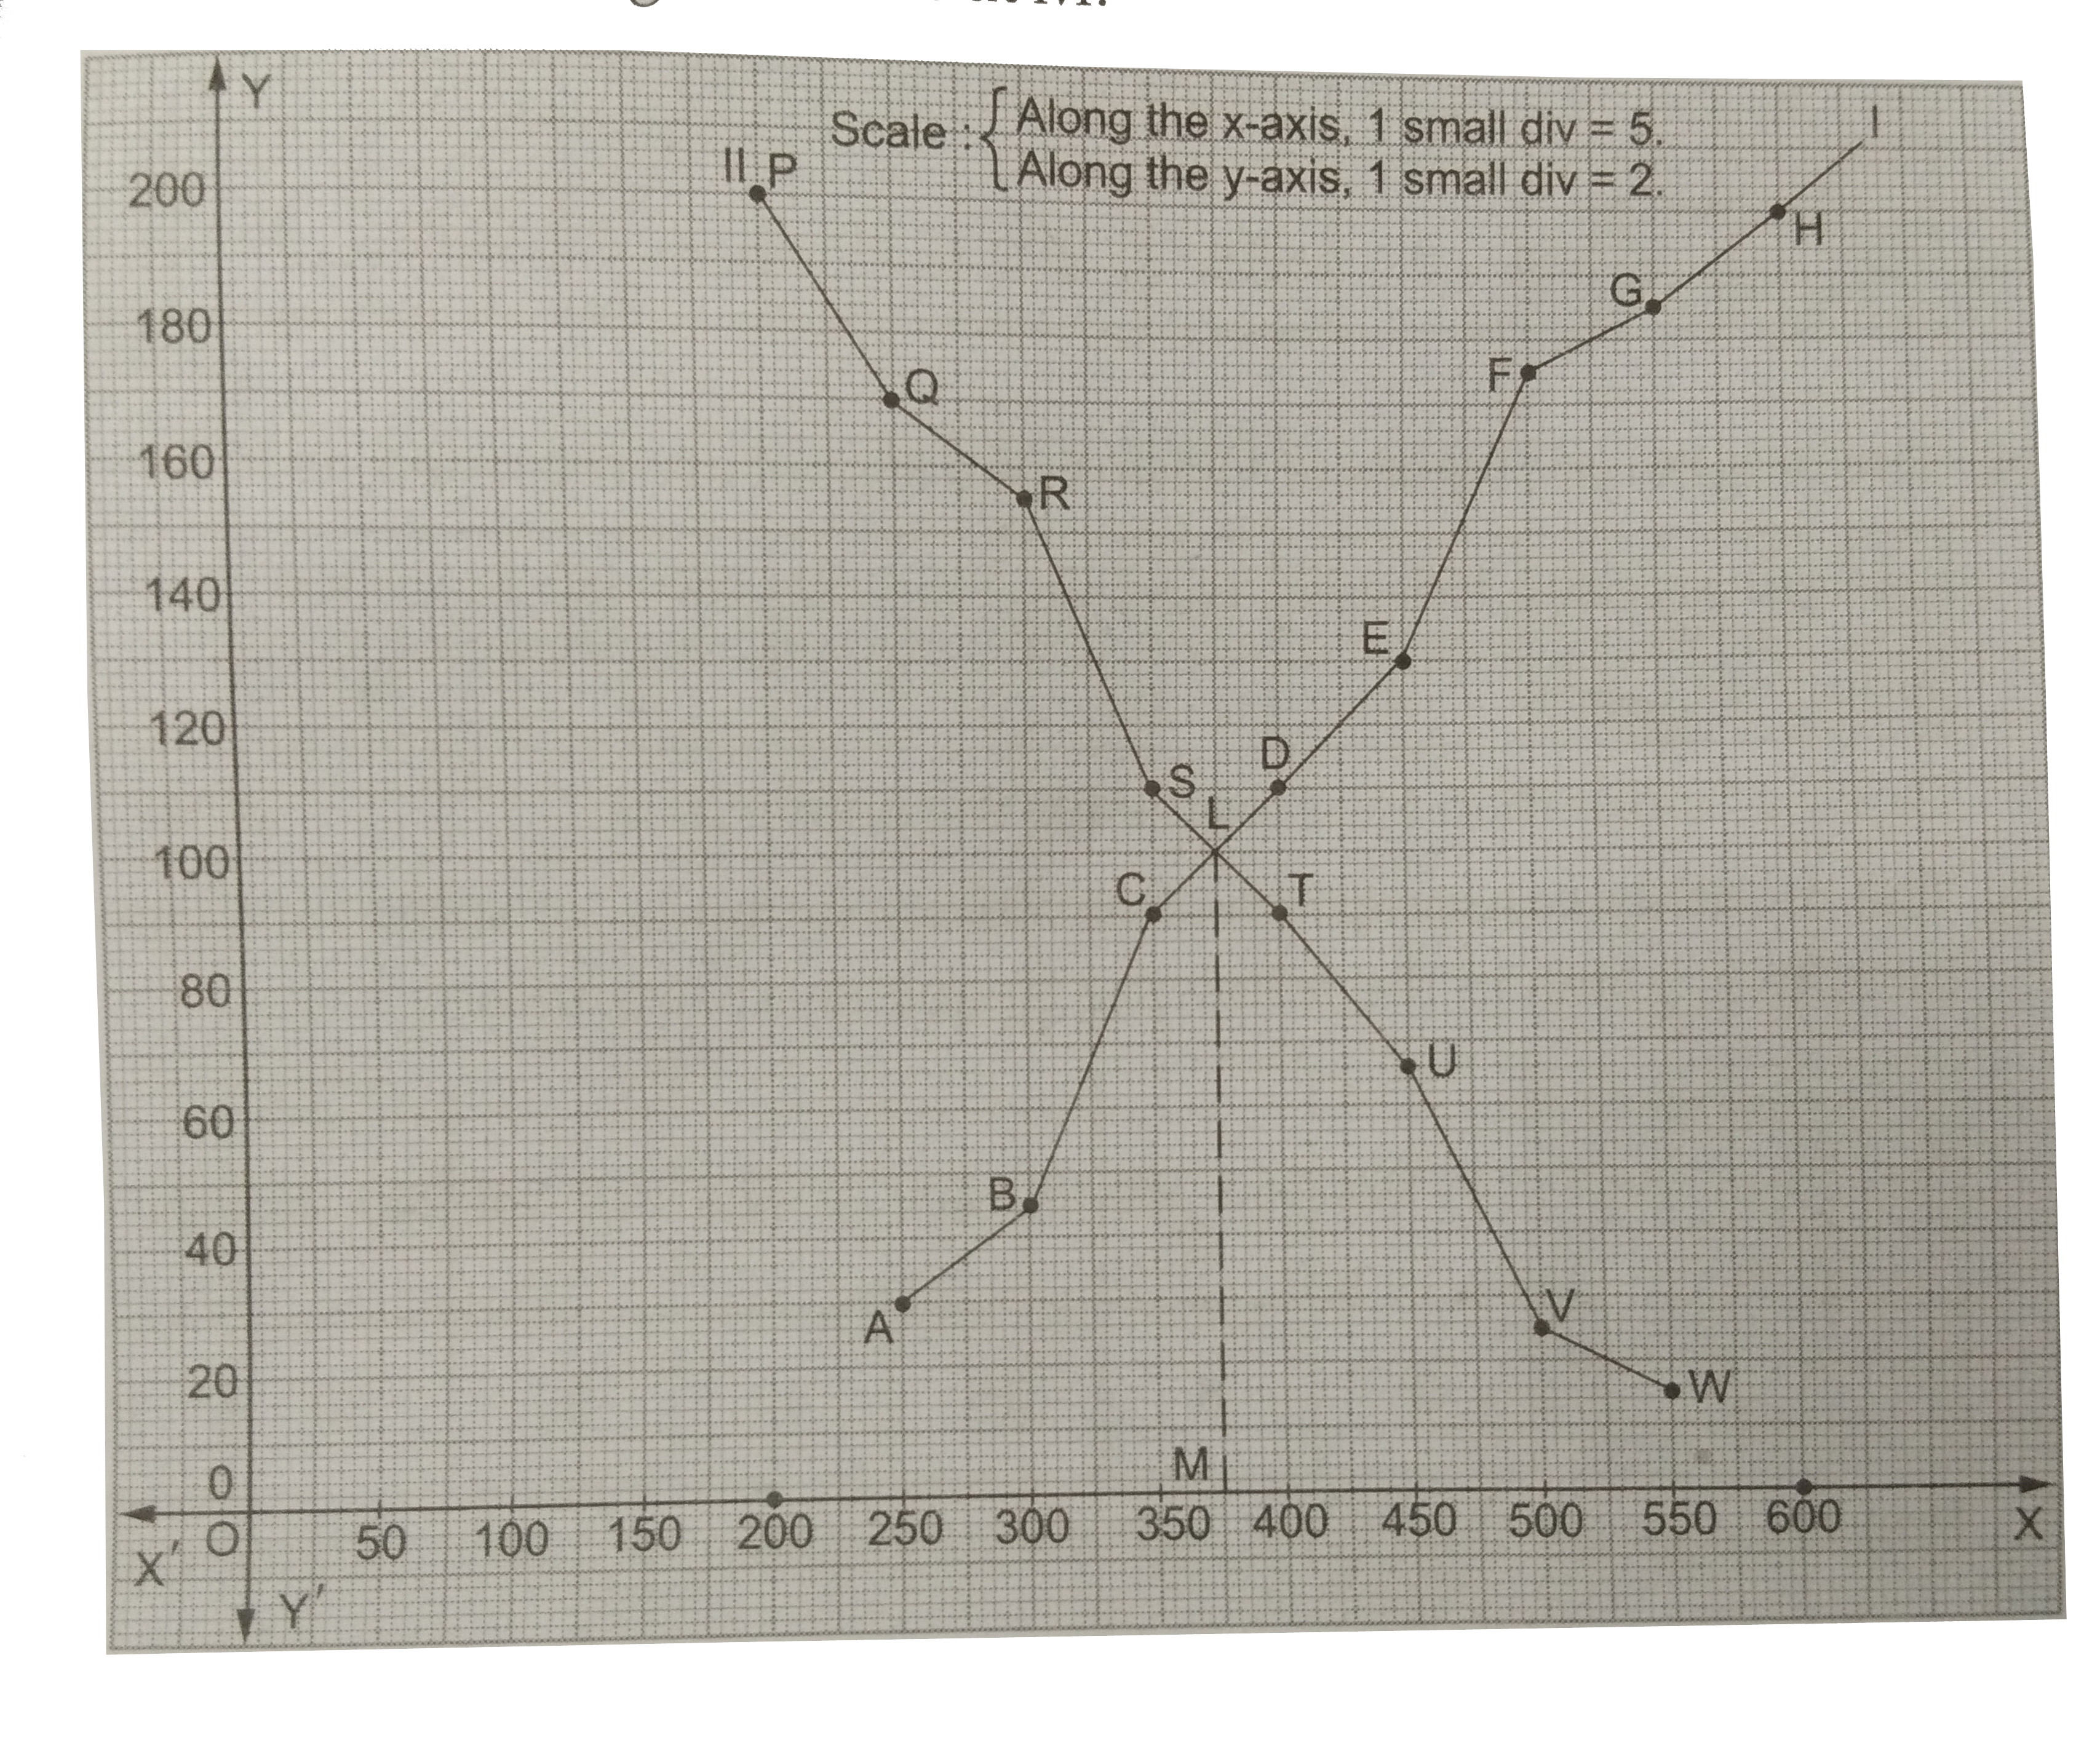
Clearly , M represents 375
Hence , median =375
Topper's Solved these Questions
- BOOK - RS AGGARWALCHAPTER - MEAN,MEDAN,MODE OF GROUPED,DATA CUMULATIVE FREQUENCY GRAPH AND OGIVE EXERCISE - MISCELLANEOUS QUESTIONS ON MEAN,MODE AND MEDIAN1videos
MEAN,MEDAN,MODE OF GROUPED,DATA CUMULATIVE FREQUENCY GRAPH AND OGIVE
- BOOK - RS AGGARWALCHAPTER - MEAN,MEDAN,MODE OF GROUPED,DATA CUMULATIVE FREQUENCY GRAPH AND OGIVE EXERCISE - Exercise 18A2videos
MEAN,MEDAN,MODE OF GROUPED,DATA CUMULATIVE FREQUENCY GRAPH AND OGIVE
- BOOK - RS AGGARWALCHAPTER - MEAN,MEDAN,MODE OF GROUPED,DATA CUMULATIVE FREQUENCY GRAPH AND OGIVE EXERCISE - Test Yourself18videos
MEAN,MEDAN,MODE OF GROUPED,DATA CUMULATIVE FREQUENCY GRAPH AND OGIVE
- BOOK - RS AGGARWALCHAPTER - LINEAR EQUATIONS IN TWO VARIABLES EXERCISE - QUESTION2videos
LINEAR EQUATIONS IN TWO VARIABLES
- BOOK - RS AGGARWALCHAPTER - PERIMETER AND AREA OF PLANE FIGURES EXERCISE - TEST YOURSELF (SHORT -ANSWER QUESTIONS)1videos
PERIMETER AND AREA OF PLANE FIGURES
Similar Questions
Knowledge Check
- Question 1 - Select One
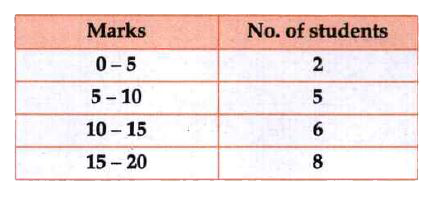
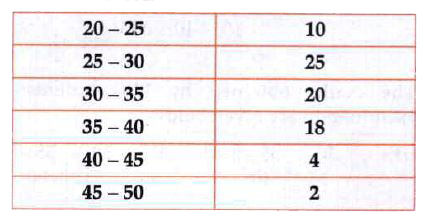
In the given table, frequency distribution of marks obtained by the stubents in a question paper of mathematics are given below

Then, median of marks isA27.7B25C17.3D9
Cumulative frequency indicates ' less than' or more than' value of the series.
View SolutionThe marks obtained by 200 students in an examination are given below. : Draw a less than ogive for the above distribution and use less than ogive to find median.
View SolutionFor the following frequency distribution, draw a cumulative frequency curve of more than type and hence obtain the median value:
 View Solution
Given below is a cumulative frequency distribution showing the mars secured by 50 students of a class

From the frequency distribution table for the data.View SolutionDraw a less than cumuative frequency curve (ogive) for the following distribution :
 View Solution
The following frequency distribution table shows marks obtained by 180 students in Mathematics examination :
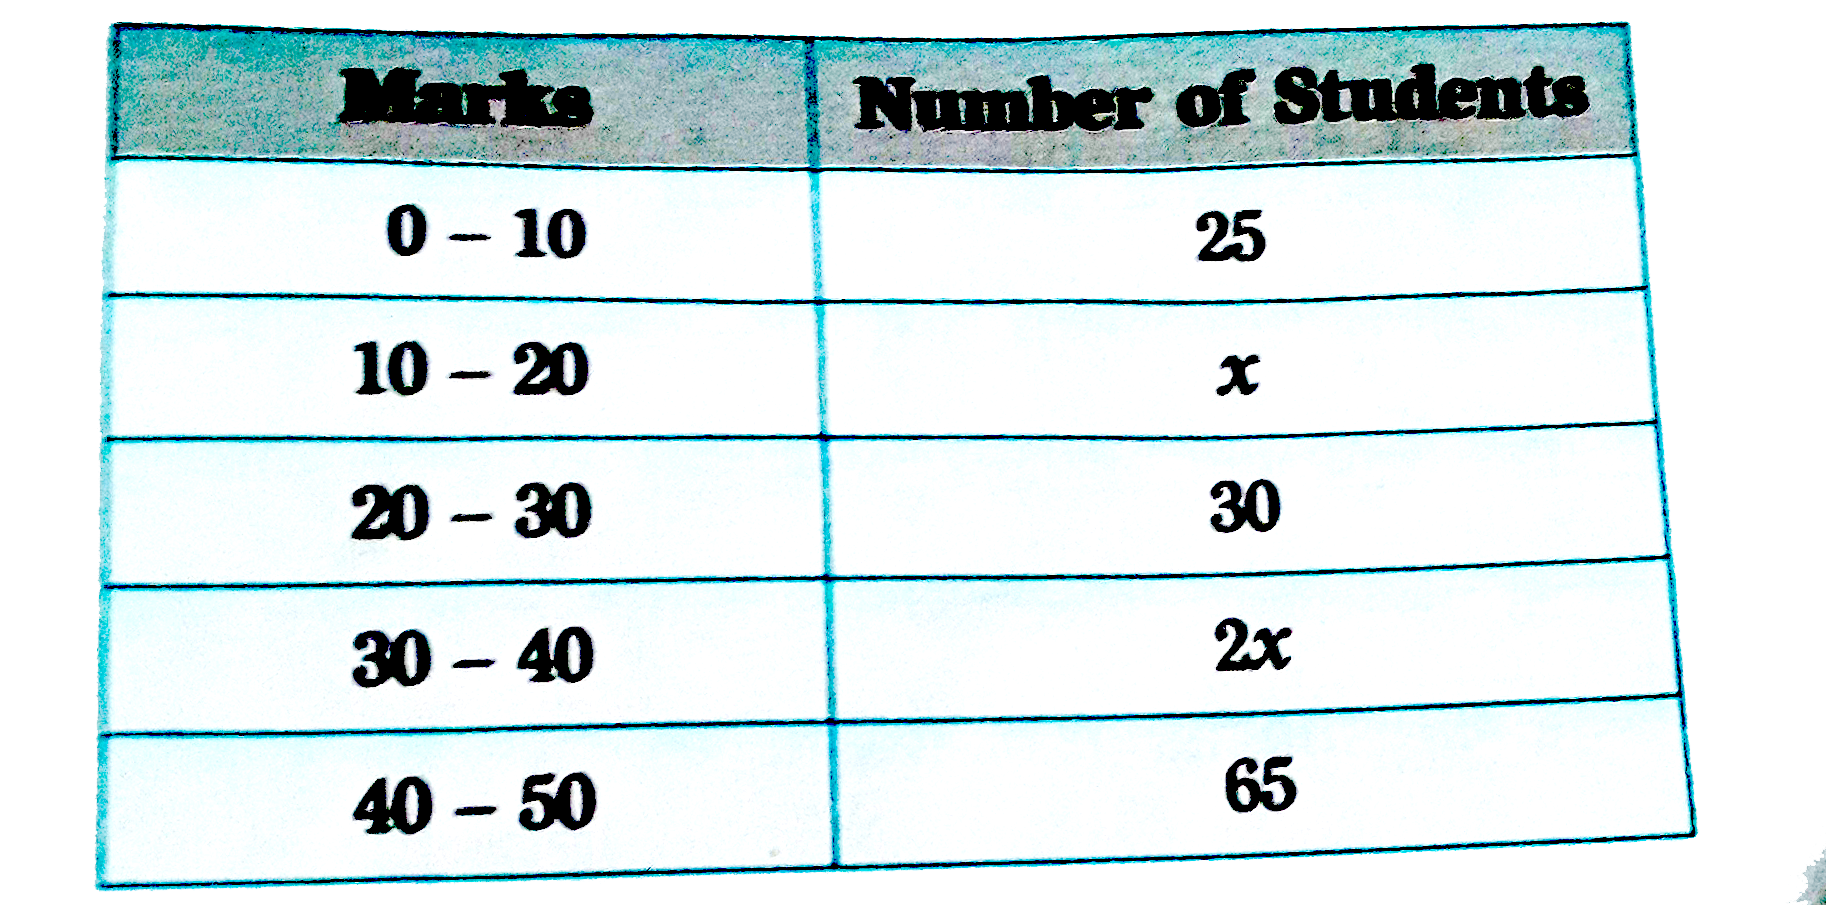
Find the value of x.
Also draw a histogram representing the above informations.View SolutionThe following table shows frequency distribution of marks of 100 students of 10th class which they obtianed in a practice examination. Find the median of the marks.
 View Solution


