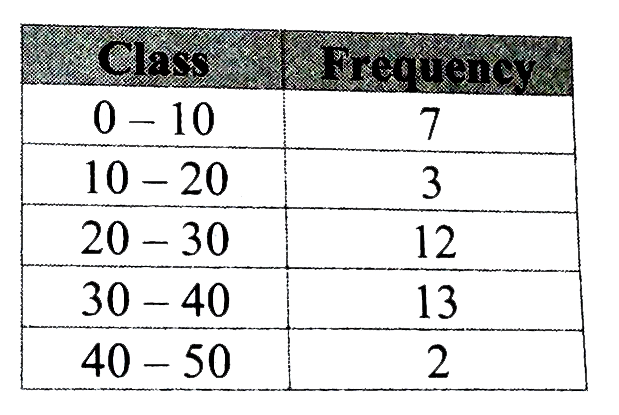
Following is the age distribution of a group of a student . Draw the cumulative frequency curve of 'less than ' type and hence obtain the median value

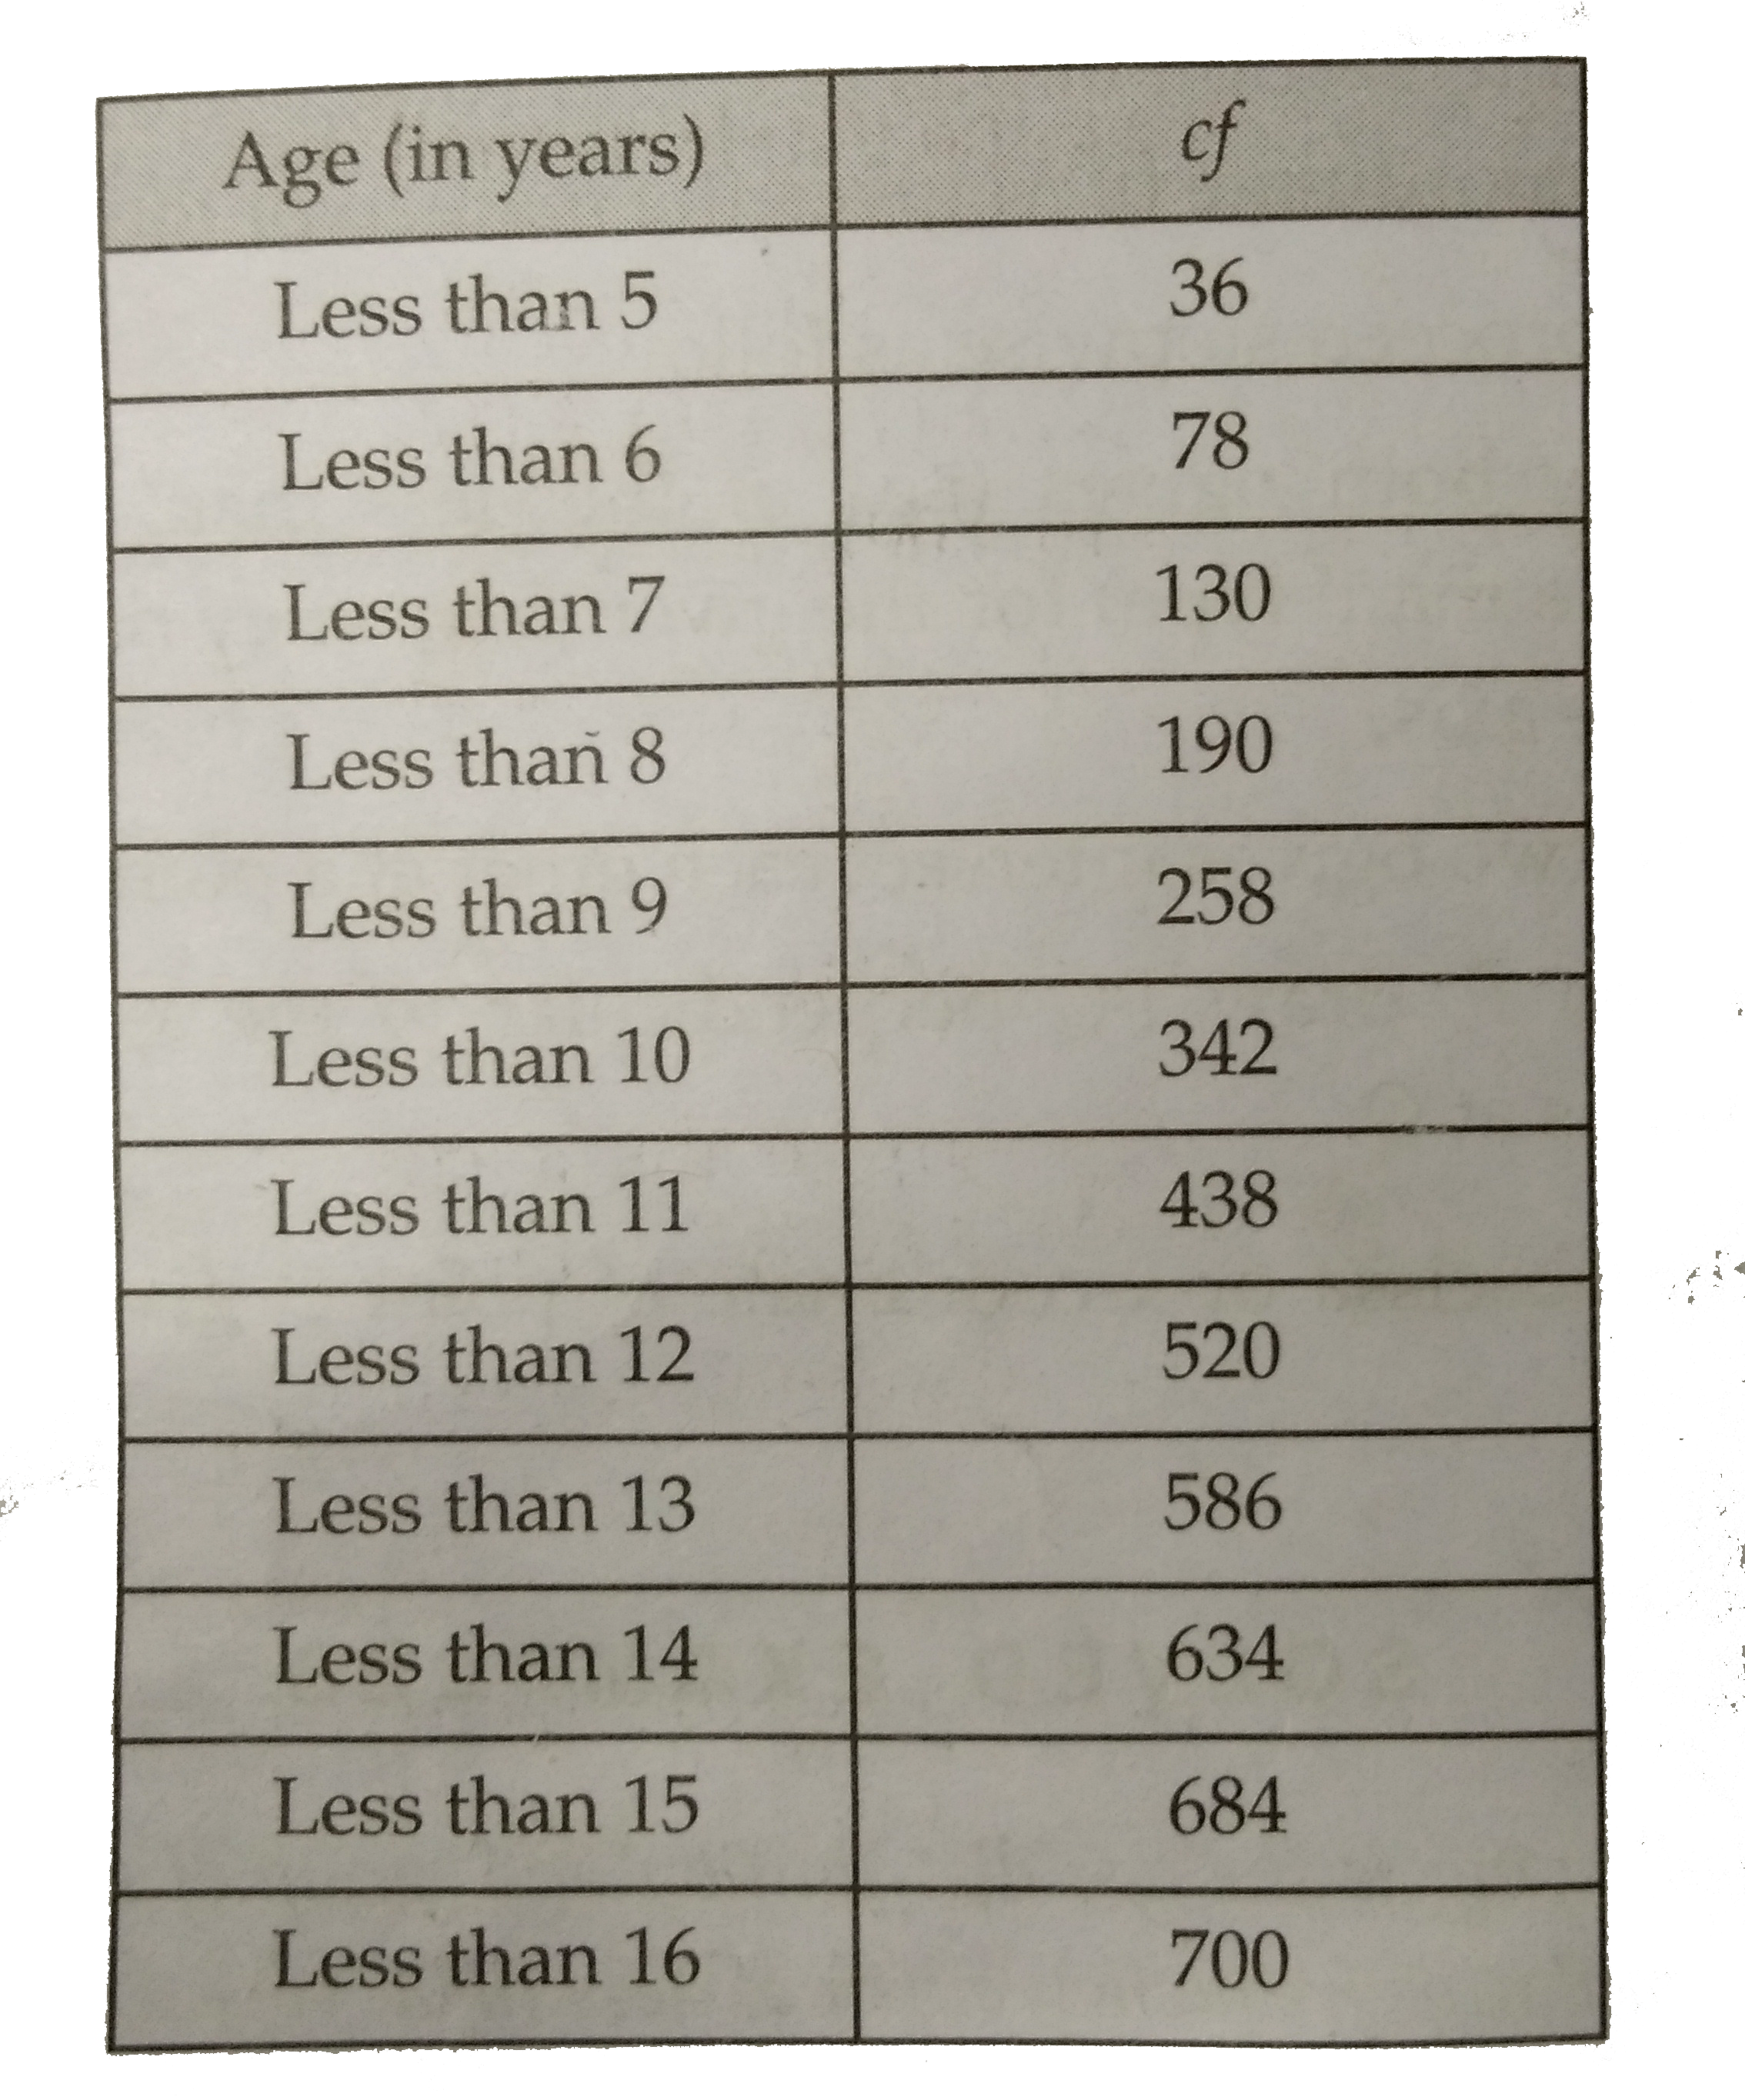
From the given table , we may prepare the ('less than ' type ) cumulative frequency table as shown below
 On a graph paper , we take the scale
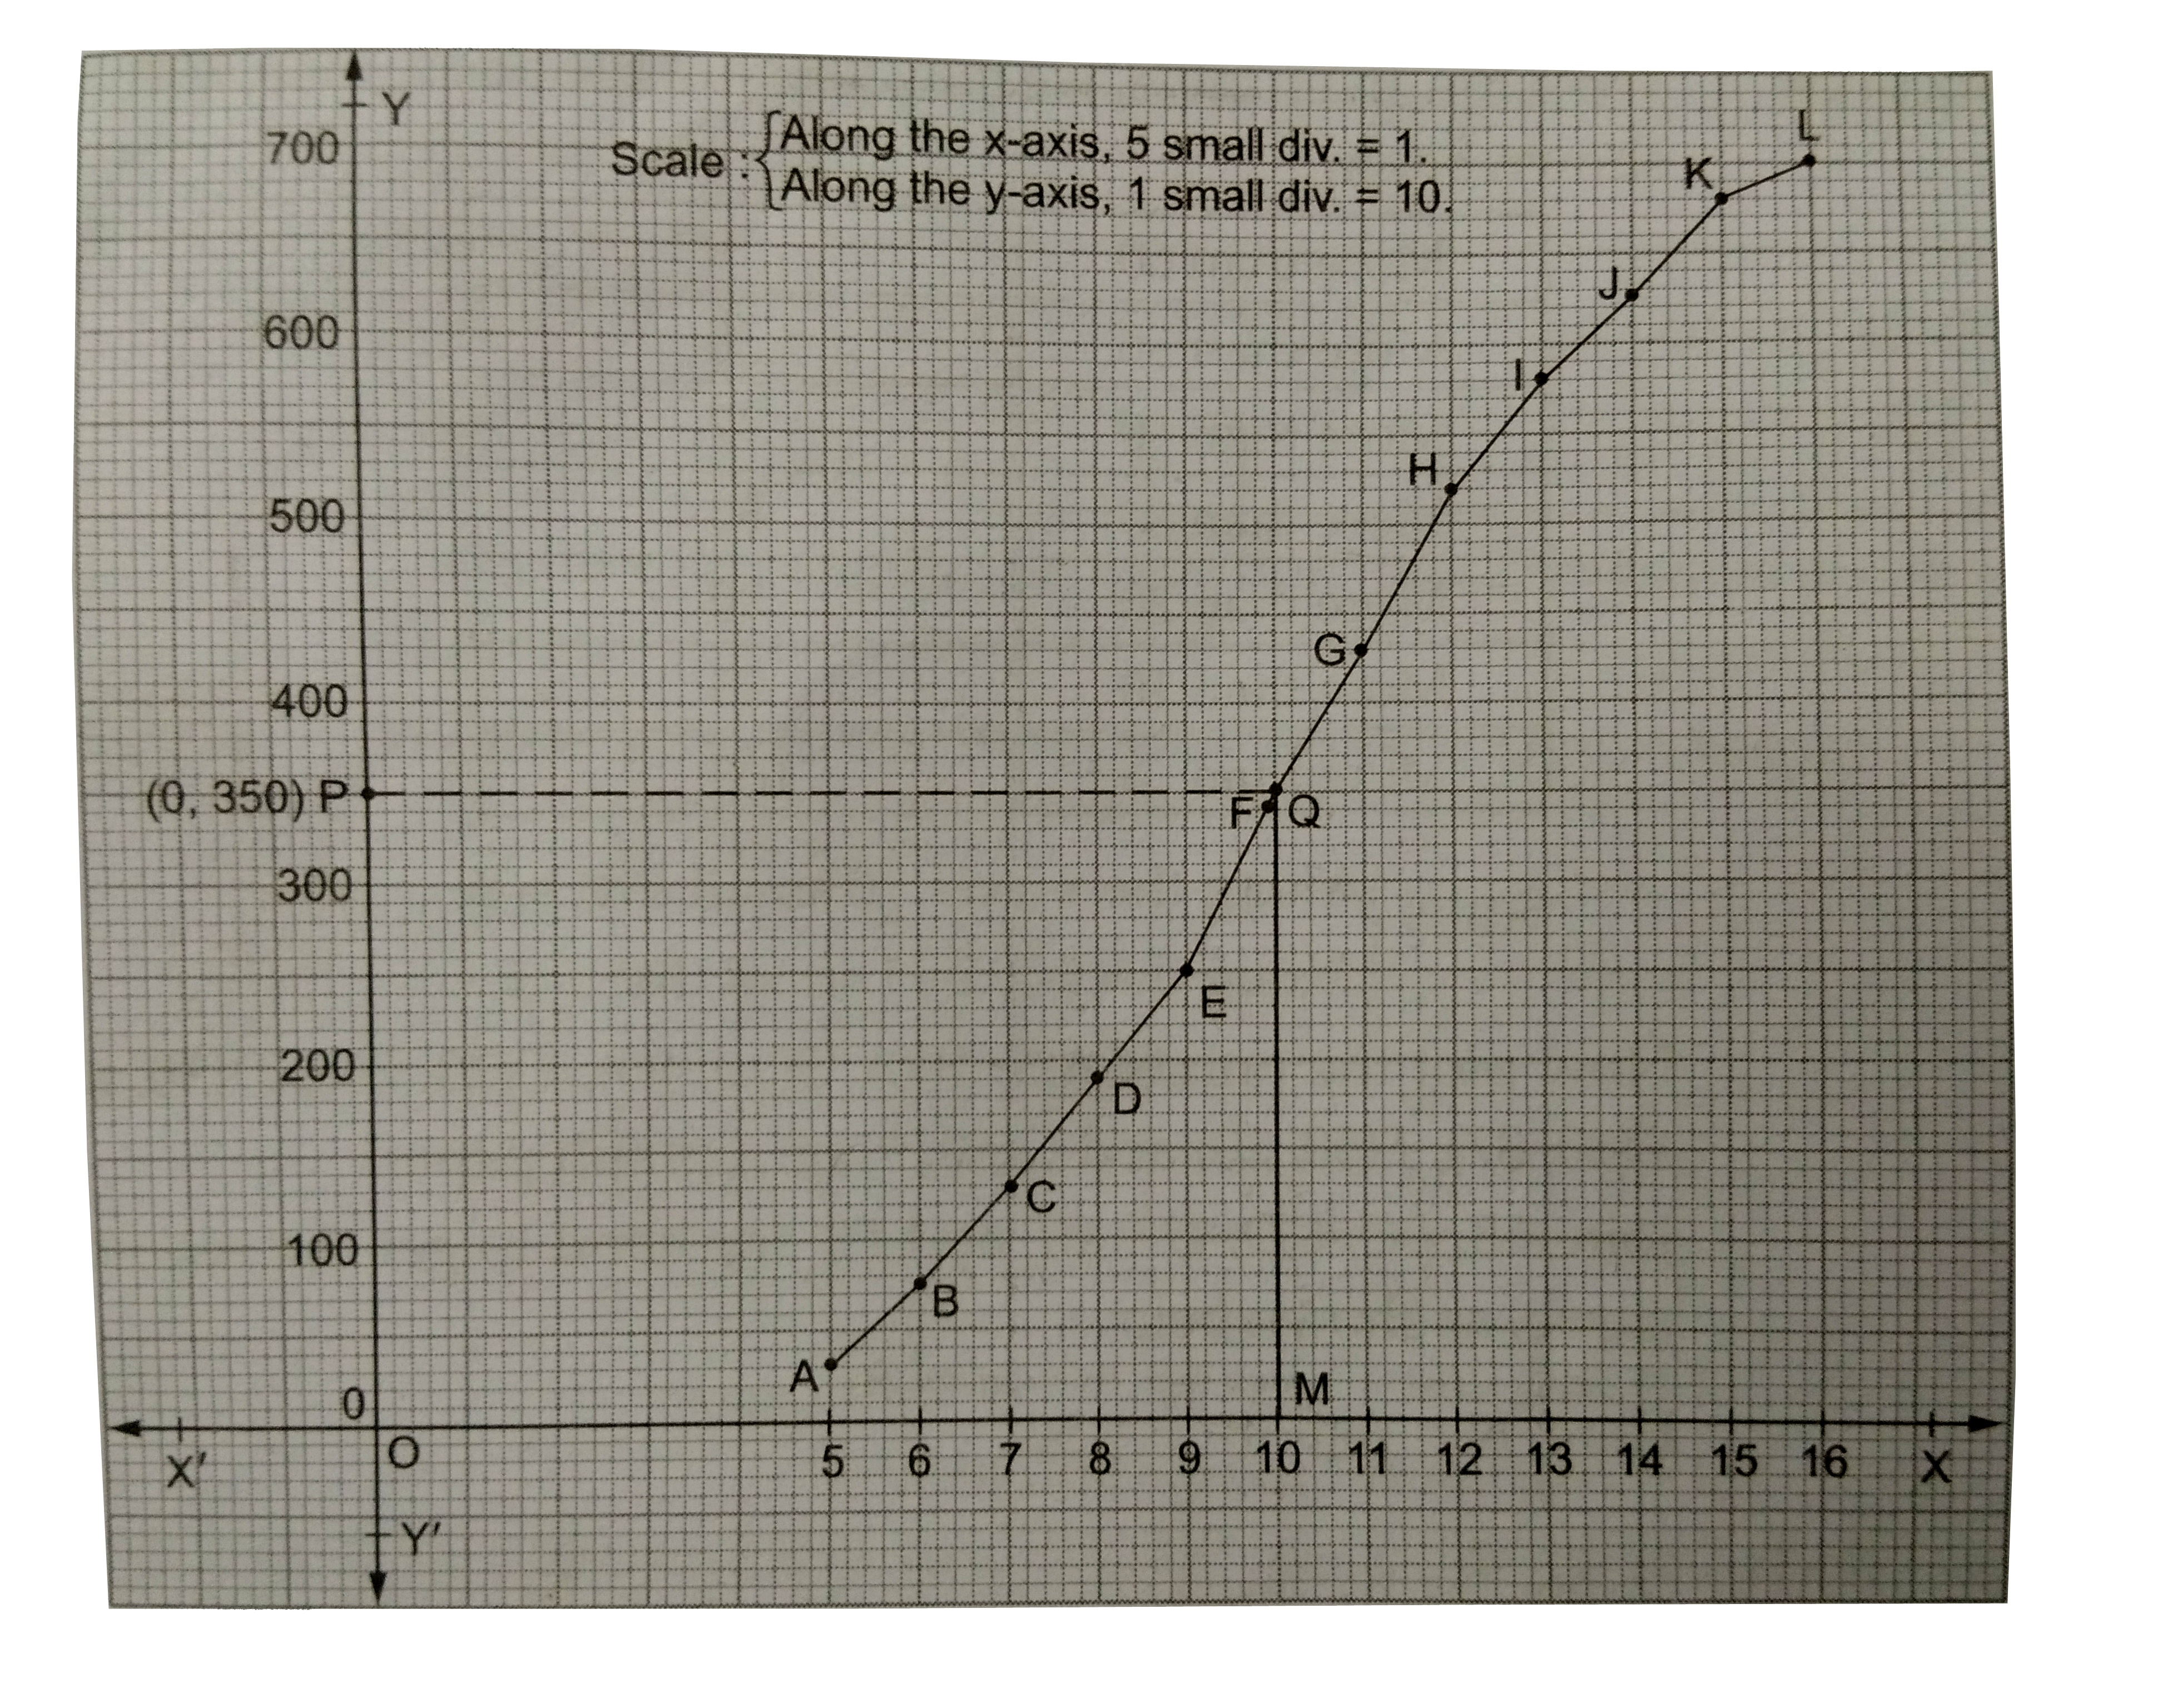
Scale: {Along the x-axis 5small div.=1 Along the y-axis 1 small div.=10 And , plot the points A(5, 36), B(6, 78), C(7, 130),, D(8, 190), E(9, 258), F(l0, 342), G(ll, 438), H(l2, 520), 1(13, 586), ](14, 634), K(15, 684) and L(16, 700).
We join freehand these points st1ccessively a to get the cumulative frequency ct1rve, or an ogive.
Here N=100 ⇒N2=350
Take a point P(0, 350) on the y-axis and draw PQ II x-axis, meeting the curve at Q. Draw QM ⊥ x-axis, intersecting the x-axis at M whose coordinates are (10, 0).
Hence, median = 10 years

Topper's Solved these Questions
- BOOK - RS AGGARWALCHAPTER - MEAN,MEDAN,MODE OF GROUPED,DATA CUMULATIVE FREQUENCY GRAPH AND OGIVE EXERCISE - MISCELLANEOUS QUESTIONS ON MEAN,MODE AND MEDIAN1videos
MEAN,MEDAN,MODE OF GROUPED,DATA CUMULATIVE FREQUENCY GRAPH AND OGIVE
- BOOK - RS AGGARWALCHAPTER - MEAN,MEDAN,MODE OF GROUPED,DATA CUMULATIVE FREQUENCY GRAPH AND OGIVE EXERCISE - Exercise 18A2videos
MEAN,MEDAN,MODE OF GROUPED,DATA CUMULATIVE FREQUENCY GRAPH AND OGIVE
- BOOK - RS AGGARWALCHAPTER - MEAN,MEDAN,MODE OF GROUPED,DATA CUMULATIVE FREQUENCY GRAPH AND OGIVE EXERCISE - Test Yourself18videos
MEAN,MEDAN,MODE OF GROUPED,DATA CUMULATIVE FREQUENCY GRAPH AND OGIVE
- BOOK - RS AGGARWALCHAPTER - LINEAR EQUATIONS IN TWO VARIABLES EXERCISE - QUESTION2videos
LINEAR EQUATIONS IN TWO VARIABLES
- BOOK - RS AGGARWALCHAPTER - PERIMETER AND AREA OF PLANE FIGURES EXERCISE - TEST YOURSELF (SHORT -ANSWER QUESTIONS)1videos
PERIMETER AND AREA OF PLANE FIGURES
Similar Questions
What is cumulative frequency of marks less than 15
View SolutionFor the following frequency distribution, draw a cumulative frequency curve of more than type and hence obtain the median value:
 View Solution
For the following frequency distribution draw a cumulative frequency curve of 'more than type' and hence obtain the median value [Class0−1010−2020−3030−4040−5050−6060−70Frequency515202317119]
View SolutionThe following is the distribution of weights (in kg) of 40 persons.

Construct a cumulative frequency distribution (of the less than type) table for the data above.View SolutionCumulative frequency indicates ' less than' or more than' value of the series.
View SolutionFrom following table, what is the cumulative frequency of less than type for the class 30-40 ?
 View Solution
Make the frequency table and the cumulative frequency curve for following data
View SolutionIn Case Of Less Than Cumulative Frequency Series
View SolutionDraw a less than cumuative frequency curve (ogive) for the following distribution :
 View Solution
Median OF grouped data || Cumulative frequency distribution table || Different types OF cumulative frequency table less than type and more than or equal to type || Median=L+(n/2-COF/F)h
View Solution

