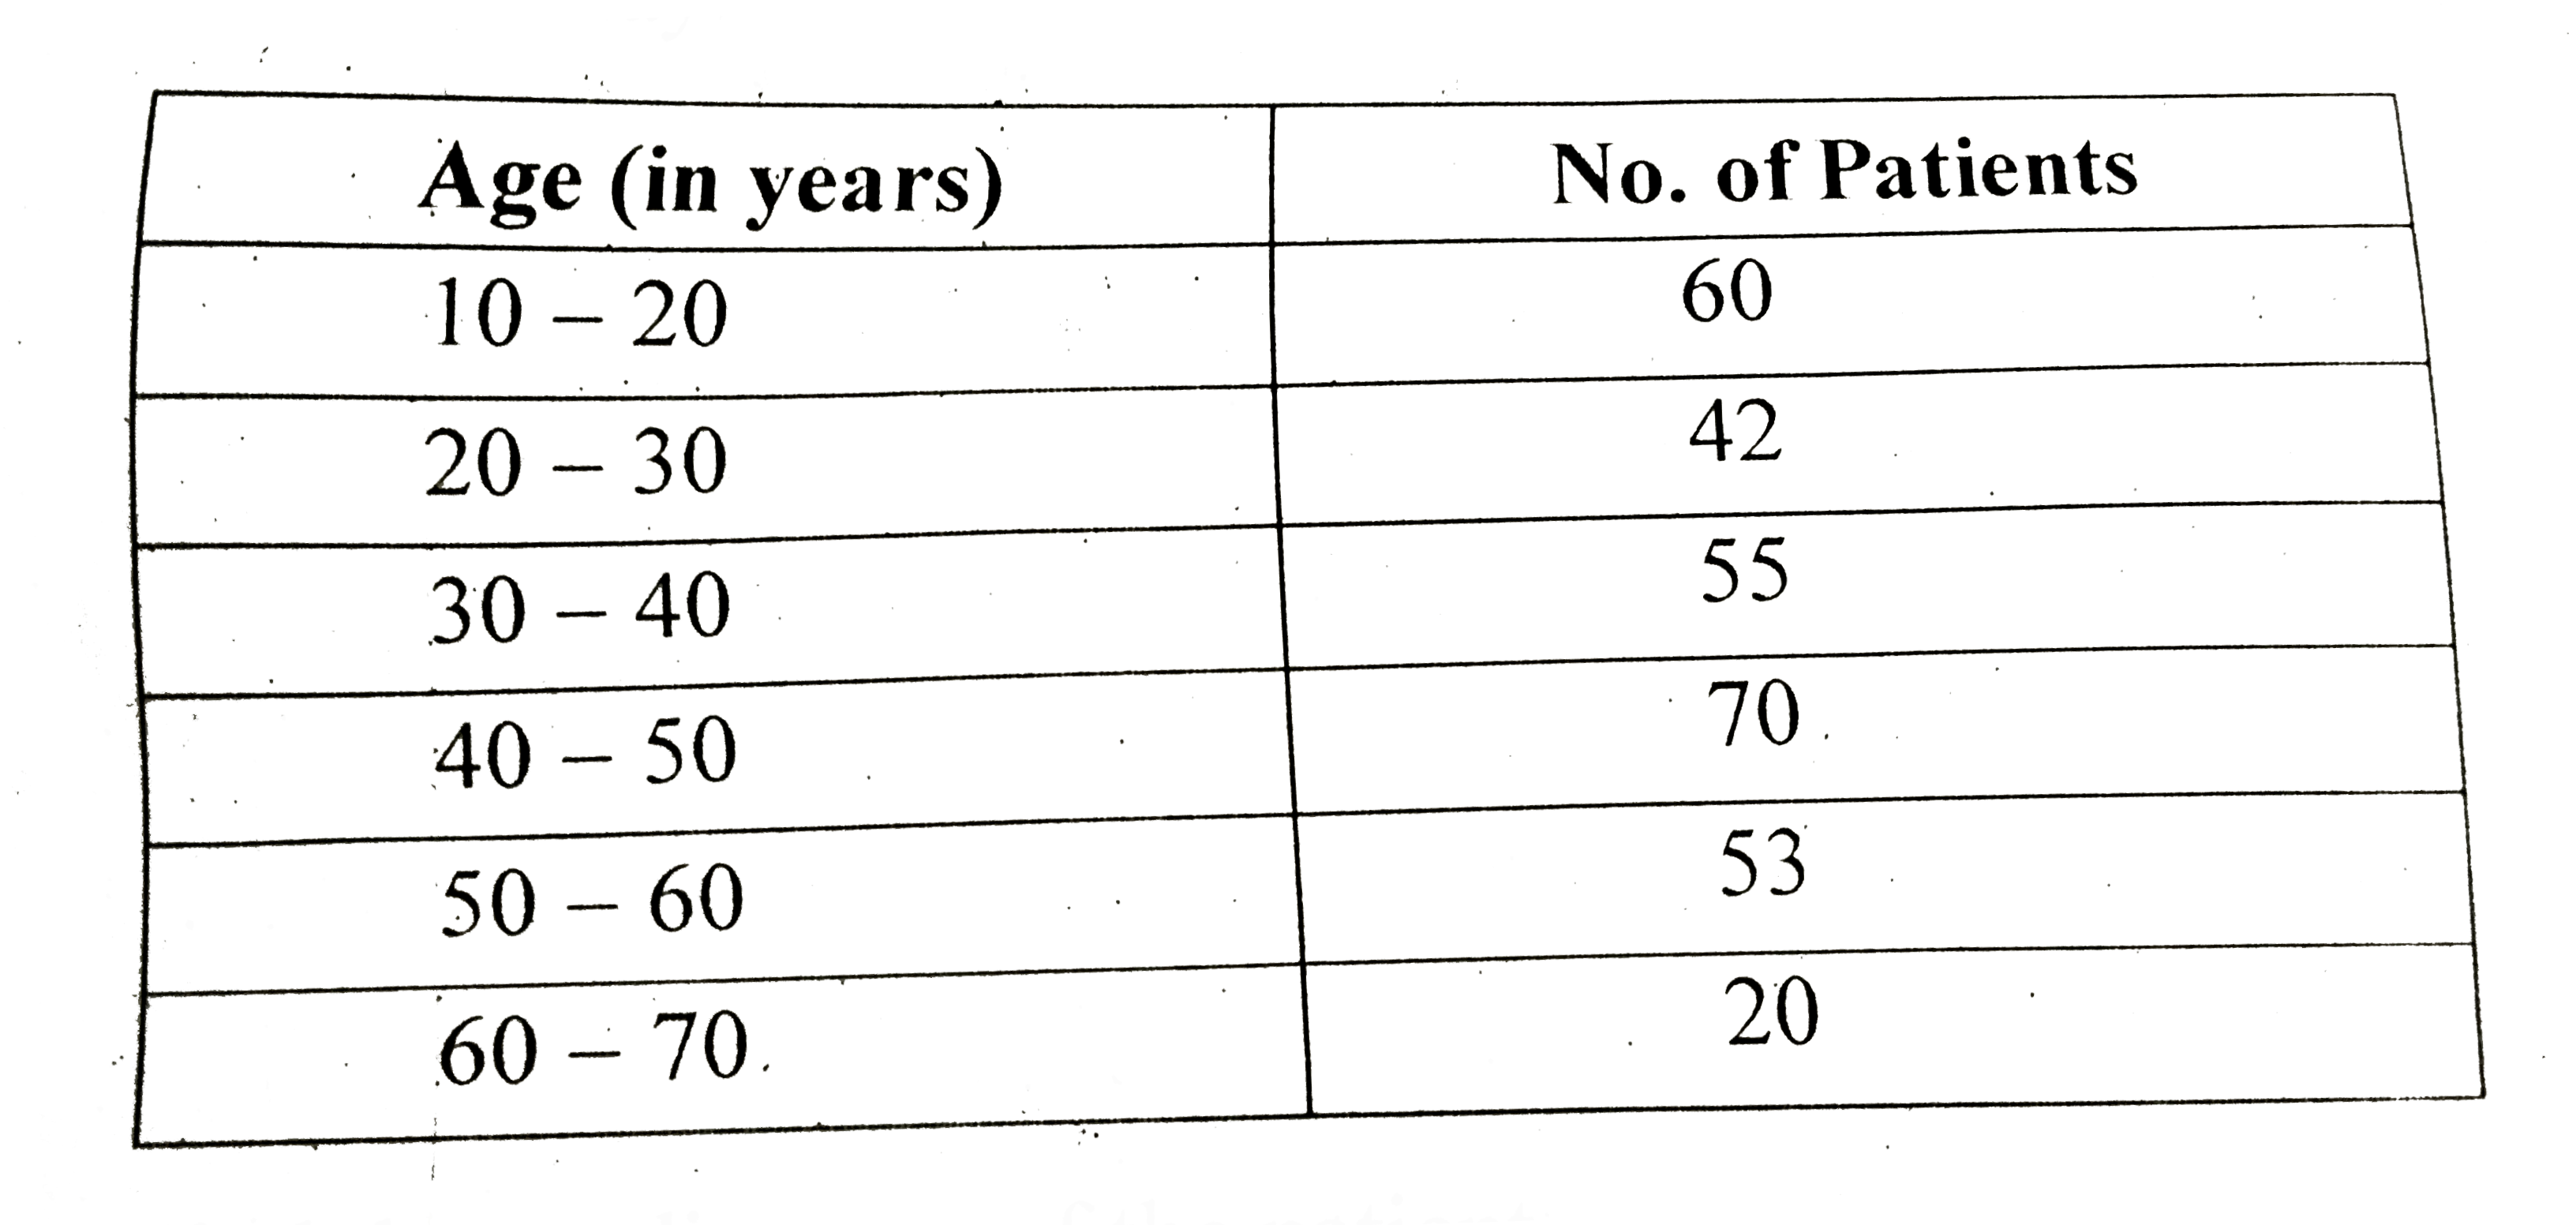
The following table shows the ages of the patients admitted in hospital during a month :

Find the mode and the means of the data given above.Compare and interpret the two measure of central tendency.
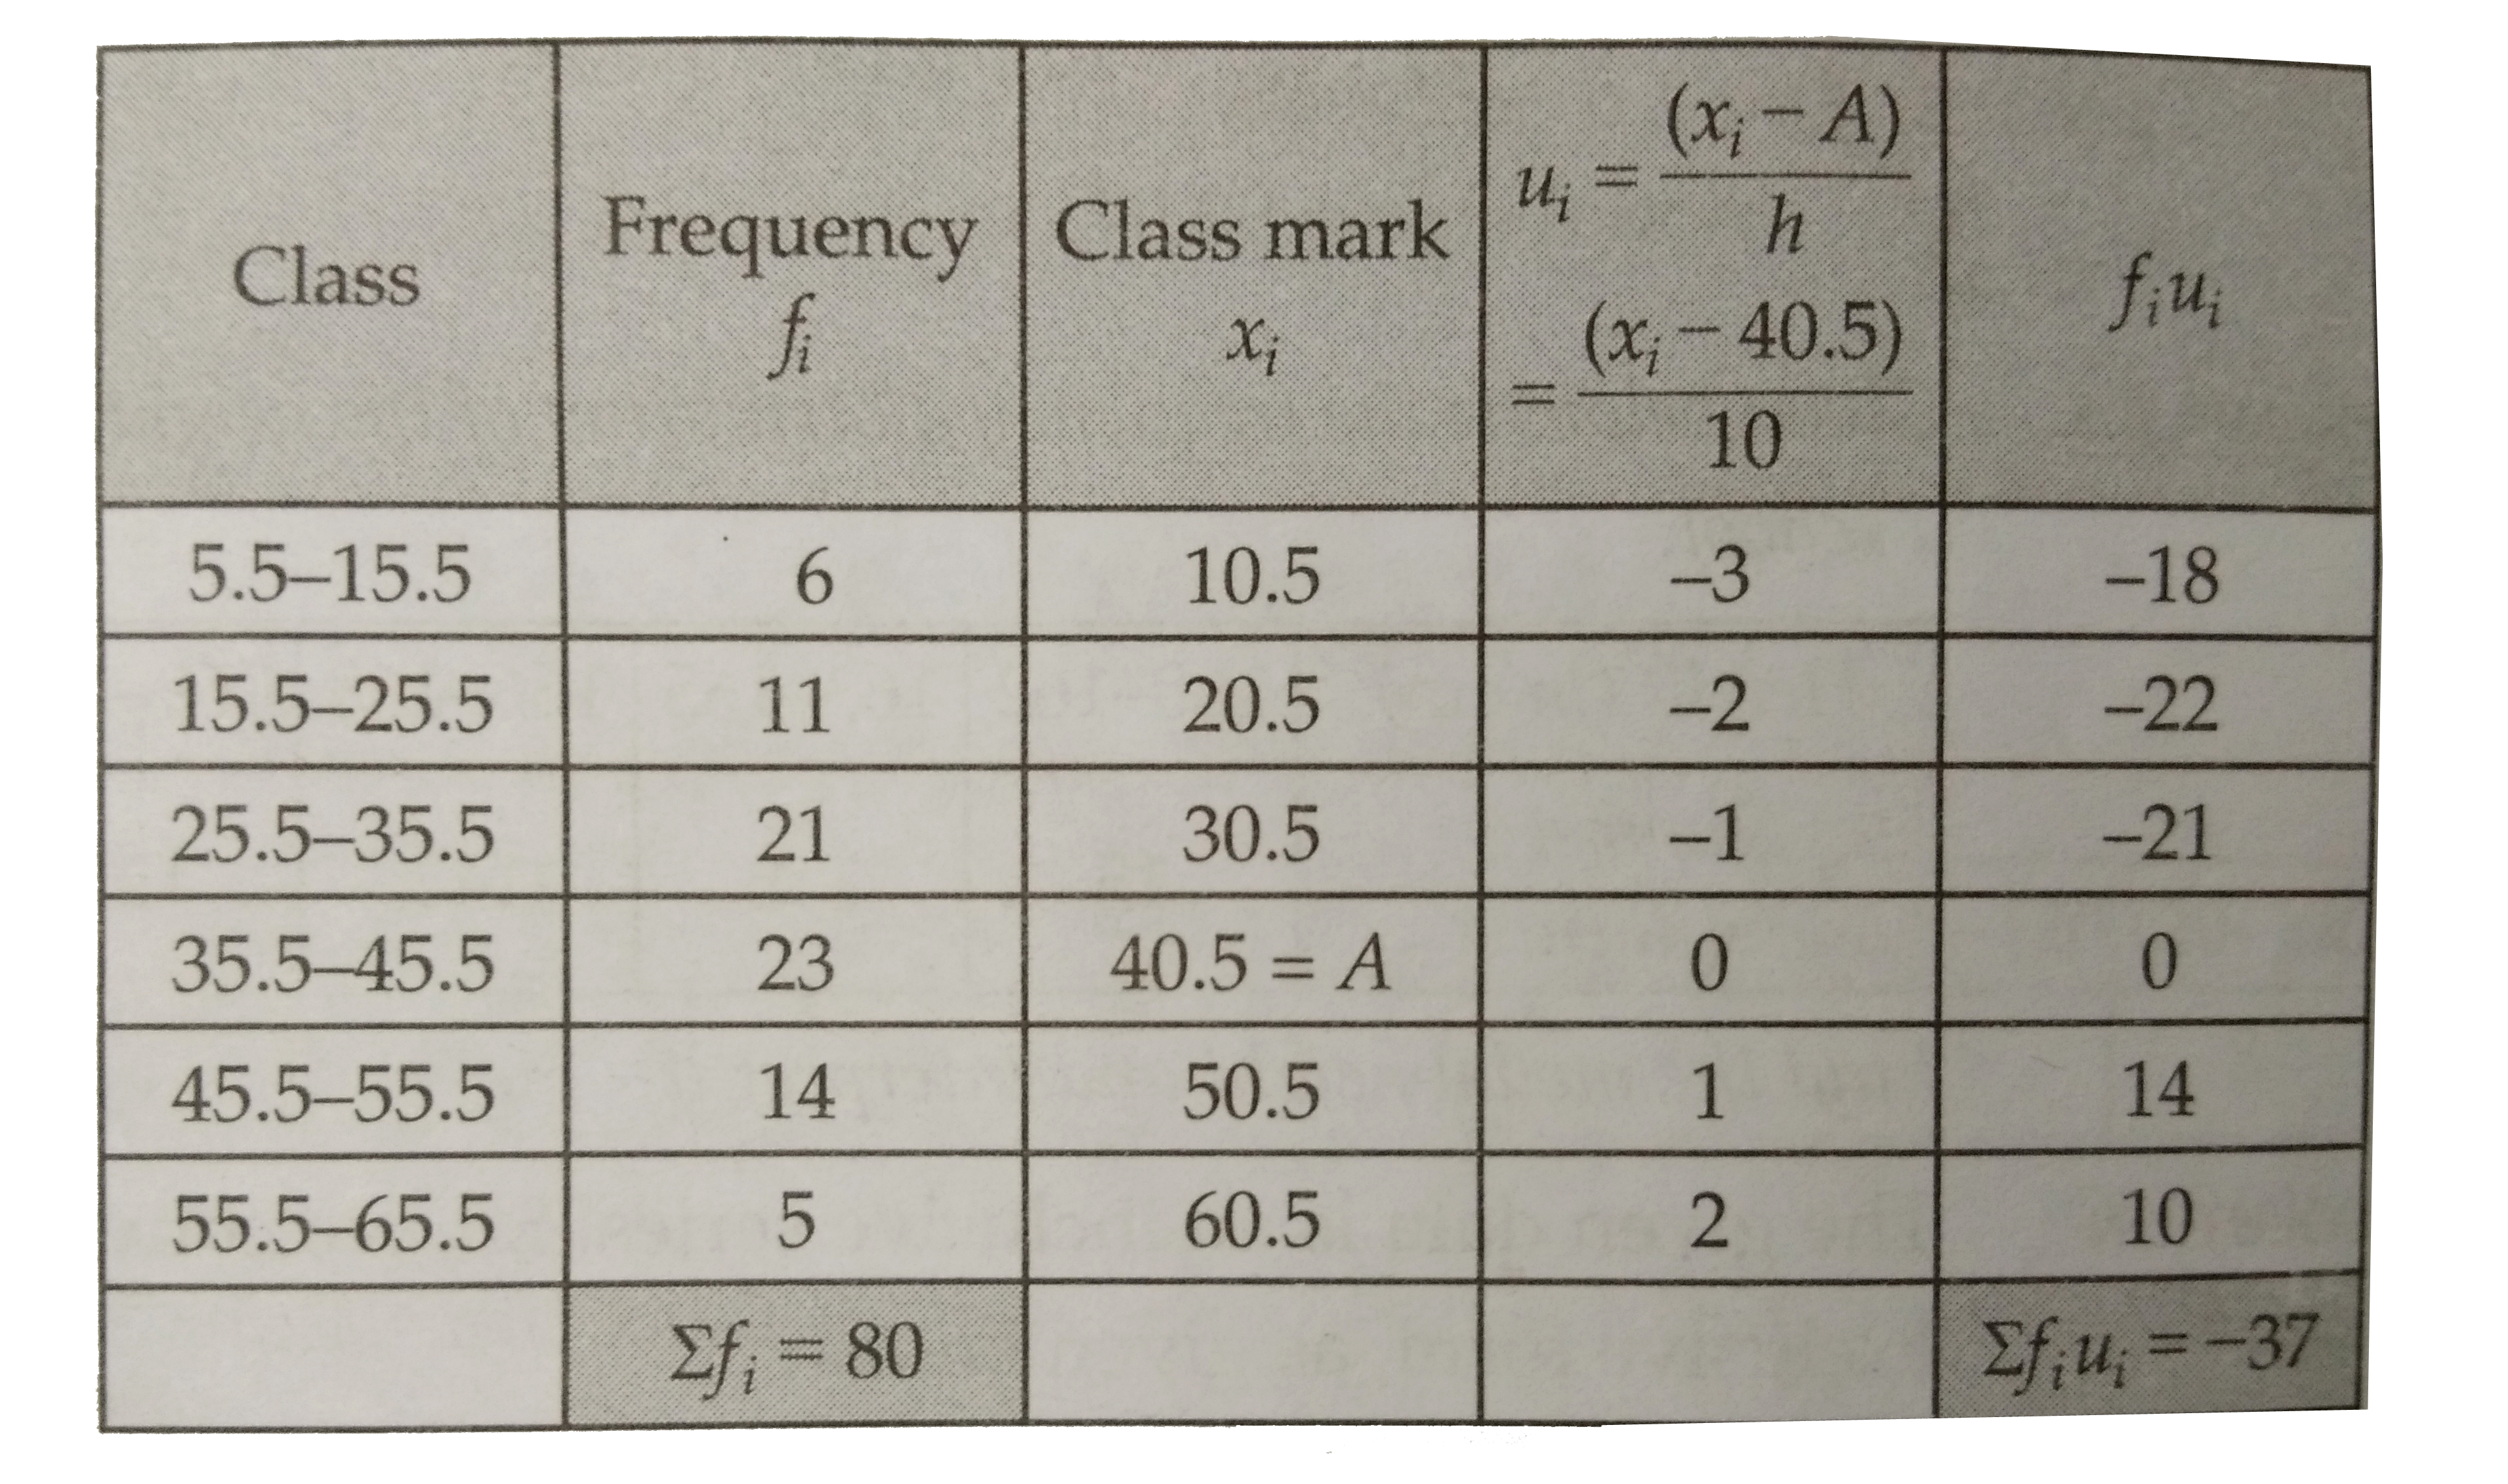
The given data is an inclusive series.Making it an exclusive sesries , we get 
Thus ,A= 40.5 ,h =10 ,Σfi=80 Σfiui=−37
Mean,¯x=A+{h×ΣfiuiΣfi}
=40.5+{10×−3780}=40.5−378
=40.5−4.63=35.87 Also , the modal class of the given data is 35.5-45.5, as it has the maximum frequecy
∴xk=35.5,fk≡23,,fk−1=21,fk+1=14andh=10
Mode, M0=xk+{h×(fk−fk−1)(2fk−fk−1−fk+1)}
35.5+{10×(23−31)(2×23−21−14)}=35.5+(10×211)
=35.5+1.82=37.32 Clearly mode gt mean
Topper's Solved these Questions
- BOOK - RS AGGARWALCHAPTER - MEAN,MEDAN,MODE OF GROUPED,DATA CUMULATIVE FREQUENCY GRAPH AND OGIVE EXERCISE - MISCELLANEOUS QUESTIONS ON MEAN,MODE AND MEDIAN1videos
MEAN,MEDAN,MODE OF GROUPED,DATA CUMULATIVE FREQUENCY GRAPH AND OGIVE
- BOOK - RS AGGARWALCHAPTER - MEAN,MEDAN,MODE OF GROUPED,DATA CUMULATIVE FREQUENCY GRAPH AND OGIVE EXERCISE - Exercise 18A2videos
MEAN,MEDAN,MODE OF GROUPED,DATA CUMULATIVE FREQUENCY GRAPH AND OGIVE
- BOOK - RS AGGARWALCHAPTER - MEAN,MEDAN,MODE OF GROUPED,DATA CUMULATIVE FREQUENCY GRAPH AND OGIVE EXERCISE - Test Yourself18videos
MEAN,MEDAN,MODE OF GROUPED,DATA CUMULATIVE FREQUENCY GRAPH AND OGIVE
- BOOK - RS AGGARWALCHAPTER - LINEAR EQUATIONS IN TWO VARIABLES EXERCISE - QUESTION2videos
LINEAR EQUATIONS IN TWO VARIABLES
- BOOK - RS AGGARWALCHAPTER - PERIMETER AND AREA OF PLANE FIGURES EXERCISE - TEST YOURSELF (SHORT -ANSWER QUESTIONS)1videos
PERIMETER AND AREA OF PLANE FIGURES
Similar Questions
The following table shows the ages of the patients admitted in a hospital during a year:Find the mode and the mean of the data given above. Compare and interpret the two measures of central tendency.
View SolutionThe following frequency dsitribution table gives the ages of 80 patients treated in a hospital during a month. Find the mode of the ages of the patients.
 View Solution
The following table shows ages of 300 patients getting medical treatment in a hospital on a particular day:

Find the median age of the patient.View SolutionThe following frequency distribution table gives the ages of 200 patients treated in a hospital in a weak. Find the mode of ages of the patients.
 View Solution
The following frequency distribution table gives the ages of 200 patients treated in a hospital in a week. Find the mode of ages of the patients.
 View Solution
The following table shows the number of patients of differents age groups admitted to a hospital for treatement on a day. Find the median age of the patients.
 View Solution
The following frequency distribution table given the ages of 200 patients treated in a hospital in a week.Find the mode of ages of the pateints.
 View Solution
The following table shows ages of people who went to a particular play of circus in a day.

Find the mode of the ages of the vistiors.View SolutionFind the mean of the data given in the following table :
 View Solution
The following table shows the birth months of 48 babies in a hospital:

Find the probability of months in which 6 babies were bornView Solution

