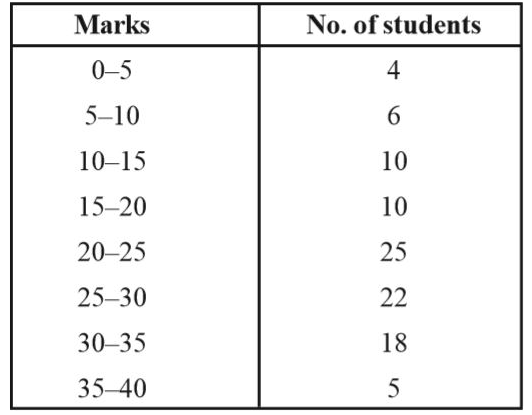
The following table shows the marks obtained by 100 students of Class X in a school during a particular academic session . Find the mode of this distribution

Clearly , the above data can be written as :

Clearly , the modal class is 40-50 , as it has the maximum frequency .
∴xk=40,fk=20,fk−1=12,fk+1=11,h=10
Mode Mo=xk+{h×(fk−fk−1)2fk−fk−1−fk+1
40+{10×(20−12)(2×20−12−11)}
=40+{10×8(40−23)}=40+{10×817}
=40+8017=40+4.71=44.71
Hence , mode =44.71
Topper's Solved these Questions
- BOOK - RS AGGARWALCHAPTER - MEAN,MEDAN,MODE OF GROUPED,DATA CUMULATIVE FREQUENCY GRAPH AND OGIVE EXERCISE - MISCELLANEOUS QUESTIONS ON MEAN,MODE AND MEDIAN1videos
MEAN,MEDAN,MODE OF GROUPED,DATA CUMULATIVE FREQUENCY GRAPH AND OGIVE
- BOOK - RS AGGARWALCHAPTER - MEAN,MEDAN,MODE OF GROUPED,DATA CUMULATIVE FREQUENCY GRAPH AND OGIVE EXERCISE - Exercise 18A2videos
MEAN,MEDAN,MODE OF GROUPED,DATA CUMULATIVE FREQUENCY GRAPH AND OGIVE
- BOOK - RS AGGARWALCHAPTER - MEAN,MEDAN,MODE OF GROUPED,DATA CUMULATIVE FREQUENCY GRAPH AND OGIVE EXERCISE - Test Yourself18videos
MEAN,MEDAN,MODE OF GROUPED,DATA CUMULATIVE FREQUENCY GRAPH AND OGIVE
- BOOK - RS AGGARWALCHAPTER - LINEAR EQUATIONS IN TWO VARIABLES EXERCISE - QUESTION2videos
LINEAR EQUATIONS IN TWO VARIABLES
- BOOK - RS AGGARWALCHAPTER - PERIMETER AND AREA OF PLANE FIGURES EXERCISE - TEST YOURSELF (SHORT -ANSWER QUESTIONS)1videos
PERIMETER AND AREA OF PLANE FIGURES
Similar Questions
Knowledge Check
- Question 1 - Select One
The table shows the marks obtained by 25 students in a class test. Find the mean of the marks obtained
 A7.72B7.65C7.4D7
The distribution given below show the marks of 100 students of a class:
then find Ogive medium of data View Solution
the following table shows the marks obtained by 41 students of a classFind the median and mean marks Using empirical formula, calculate its mode.
 View Solution
The following table represent marks obtained by 100 students in a test.

Find mean marks of the students.View SolutionThe following table shows frequency distribution of marks secured by 100 students in a particular examination. Find the mean of the marks.
 View Solution
The following table shows marks in English secured by students of Class X in your school in their examination. Calculate mean marks using Direct Method.
Marks0−1010−2020−3030−4040−50Number of Students 20 24 40 36 20View SolutionThe following table shows marks in English secured by students of Class X in your school in their examination. Calculate mean marks using Direct Method.
Marks0−1010−2020−3030−4040−50Number of Students 20 24 40 36 20View SolutionThe following table shows frequency distribution of marks of 100 students of 10th class which they obtianed in a practice examination. Find the median of the marks.
 View Solution


