When two plants L and M were exposed to different light intensities and temperature , they showed changes in their rates of photosynthesis , which have been represented in the following graph.
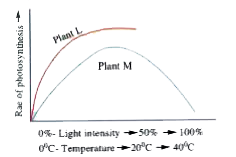
The graph indicates that Solution in Telugu
Plant L is a C3 plant for which the light saturation point is 100% of full sunlight .
Plant M is a C4 plant for which the optimum temperature is around 20∘C
Plant M is a C3 plant which is more affected at higher temperature and higher light intensity as compared to plant L
Plant L is a C4 plant and cannot function at light intensities above the saturation point
The correct Answer is:C
Step by step video, text & image solution for When two plants L and M were exposed to different light intensities and temperature , they showed changes in their rates of photosynthesis , which have been represented in the following graph. The graph indicates that by Biology experts to help you in doubts & scoring excellent marks in Class 12 exams.
Topper's Solved these Questions
- BOOK - AAKASH SERIESCHAPTER - PHOTOSYNTHESIS IN HIGHER PLANTS EXERCISE - Exercise - II33videos
PHOTOSYNTHESIS IN HIGHER PLANTS
- BOOK - AAKASH SERIESCHAPTER - PHOTOSYNTHESIS IN HIGHER PLANTS EXERCISE - Exercise - III27videos
PHOTOSYNTHESIS IN HIGHER PLANTS
- BOOK - AAKASH SERIESCHAPTER - ORGANISMS AND POPULATIONSEXERCISE - EXERCISE-III (PREVIOUS AIPMT/NEET QUESTIONS)35videos
ORGANISMS AND POPULATIONS
- BOOK - AAKASH SERIESCHAPTER - PLANT GROWTH AND DEVELOPMENT EXERCISE - EXERCISE -III (PREVIOUS AIPMT/NEET QUESTIONS)27videos
PLANT GROWTH AND DEVELOPMENT
Similar Questions
In an experiment demonstrating the evolution of oxygen in Hydrilla , sodium bicarbonate is added to water in the experiment ste- up . What would happen if all other conditions are favourable ?
03:56View SolutionPhosphoenol pyruvate (PEP) is the primary CO2 acceptor in :
03:04View SolutionAsymptote in a logistic growth curve is obtained when
View SolutionRoot hairs develop from the rgion of :
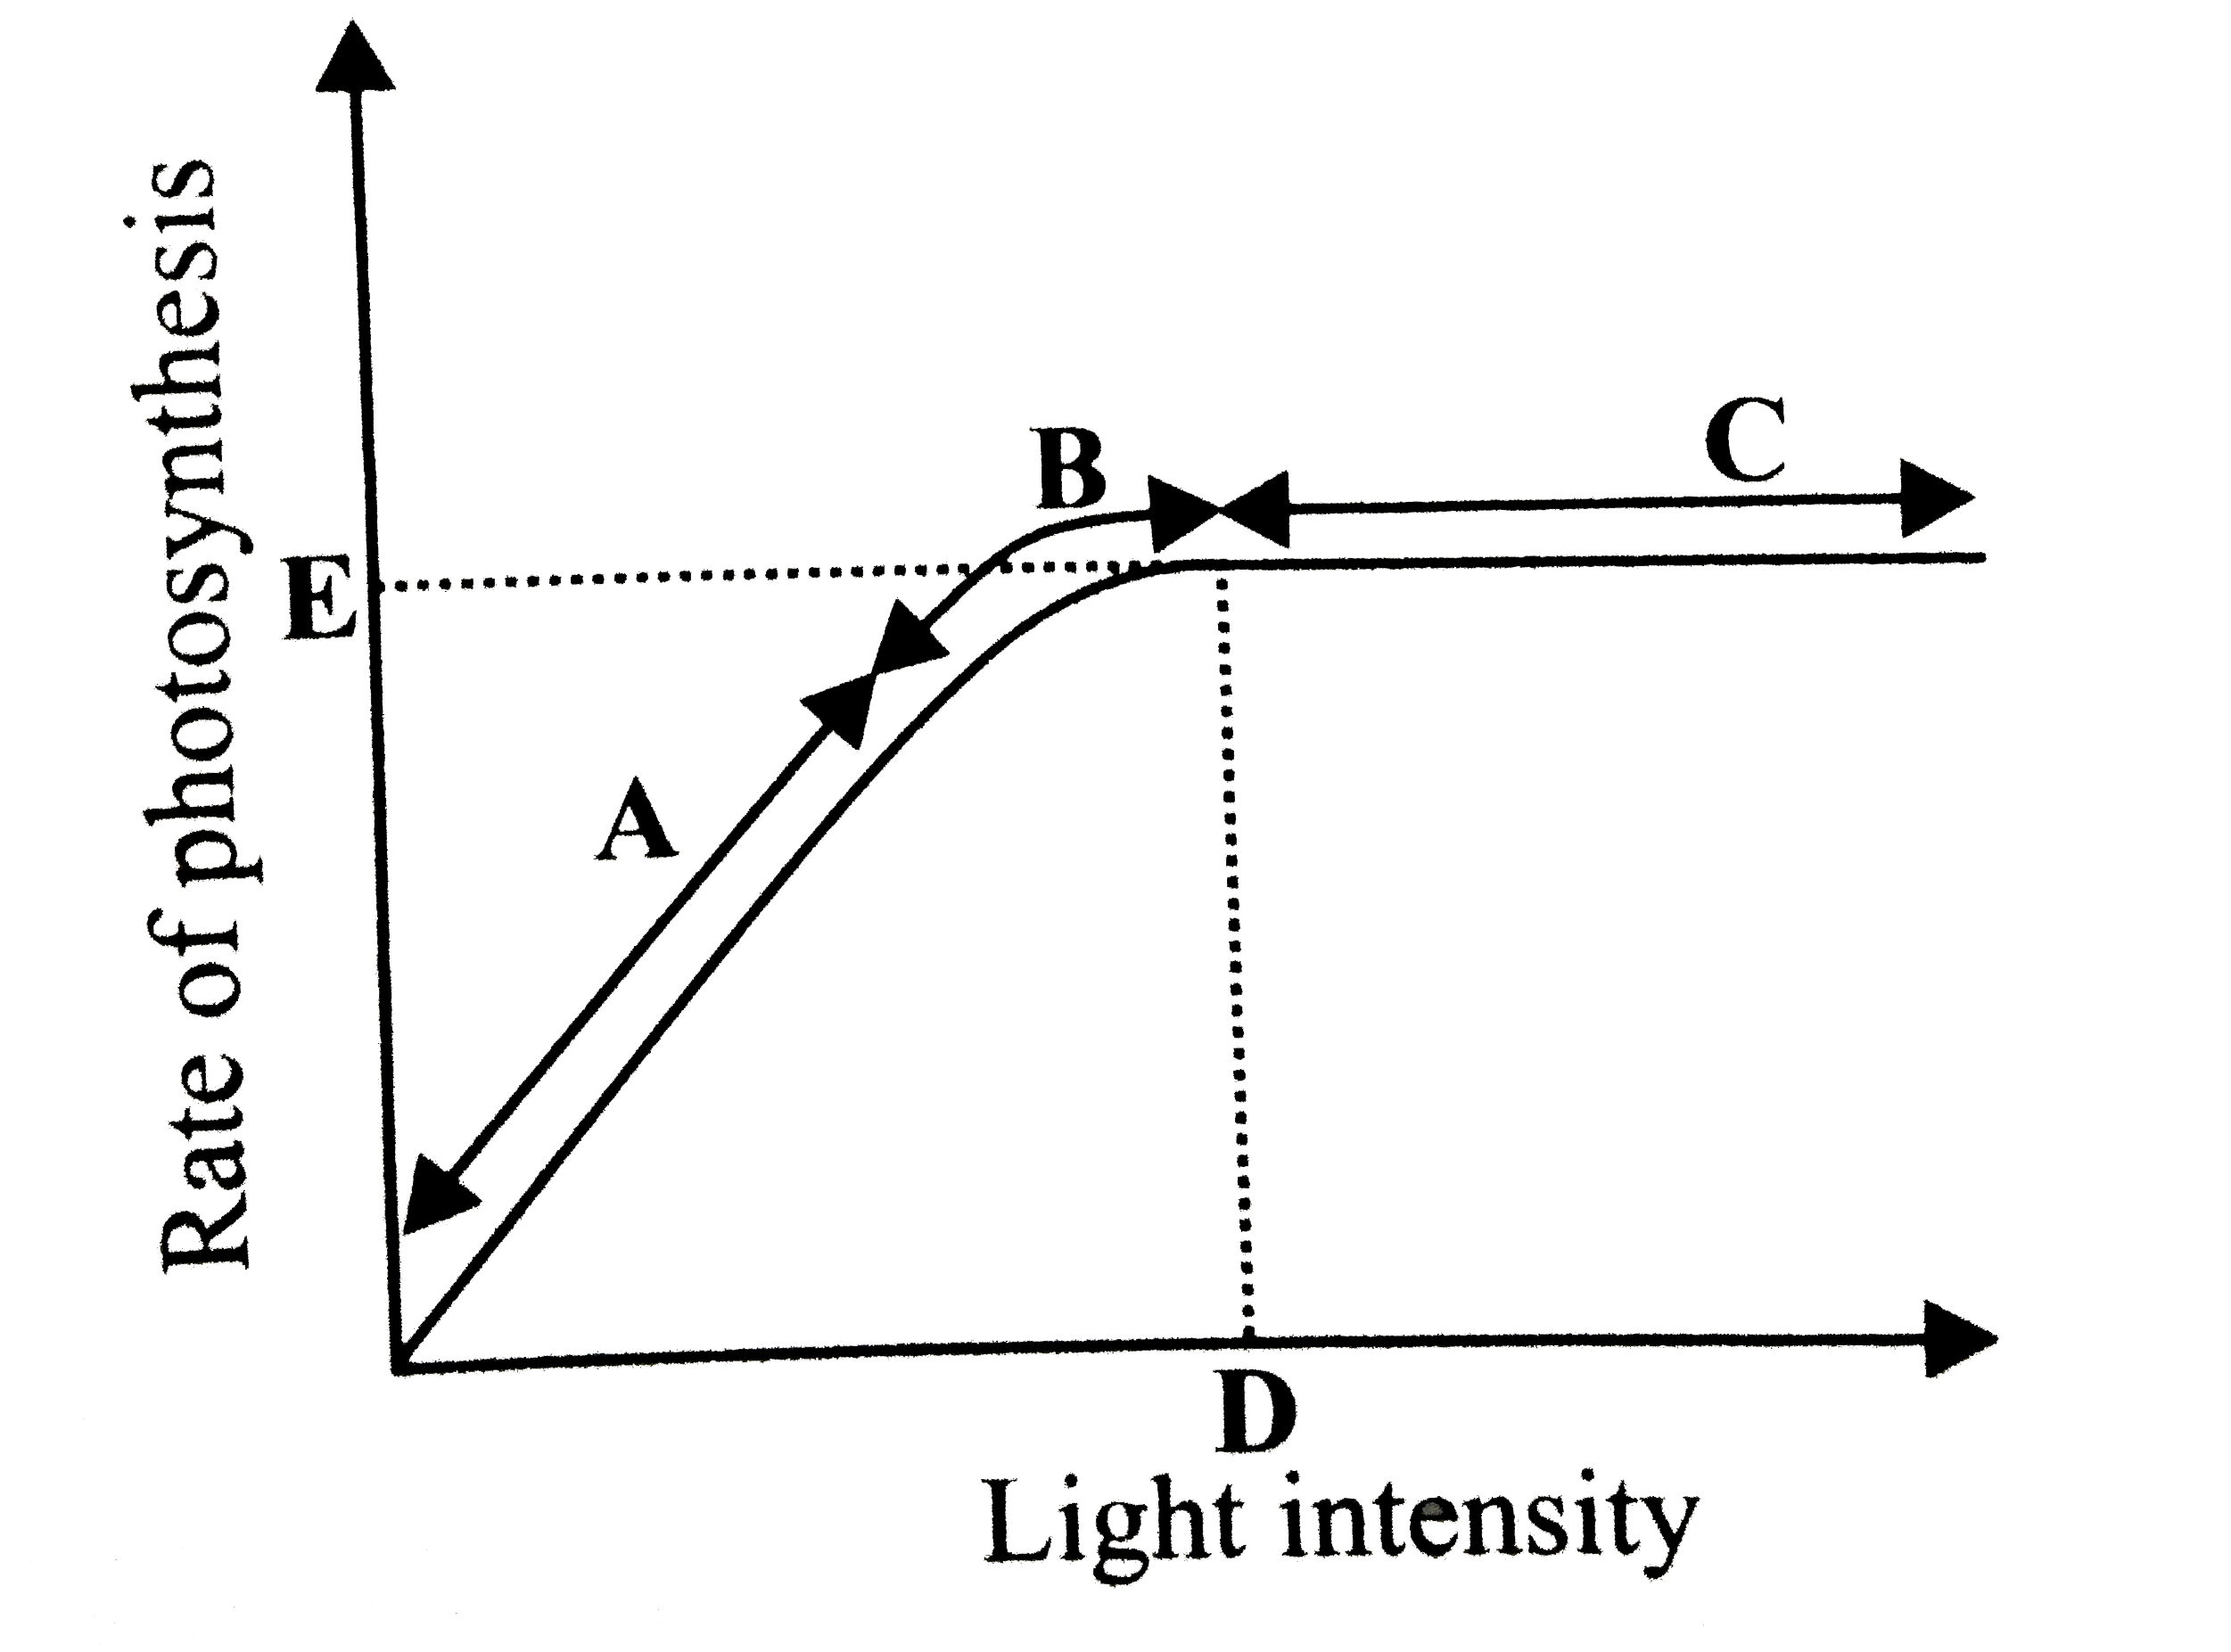
01:57View SolutionStudy the given graph showing the efect of light intensity on the rate of photosynthesis. Which of the following statemetns regarding this is correct?
 03:04View Solution
When two plants L and M were exposed to different light intensities and temperature they showed changes in their rates of photosynthesis. Which have been represented in the following graph.
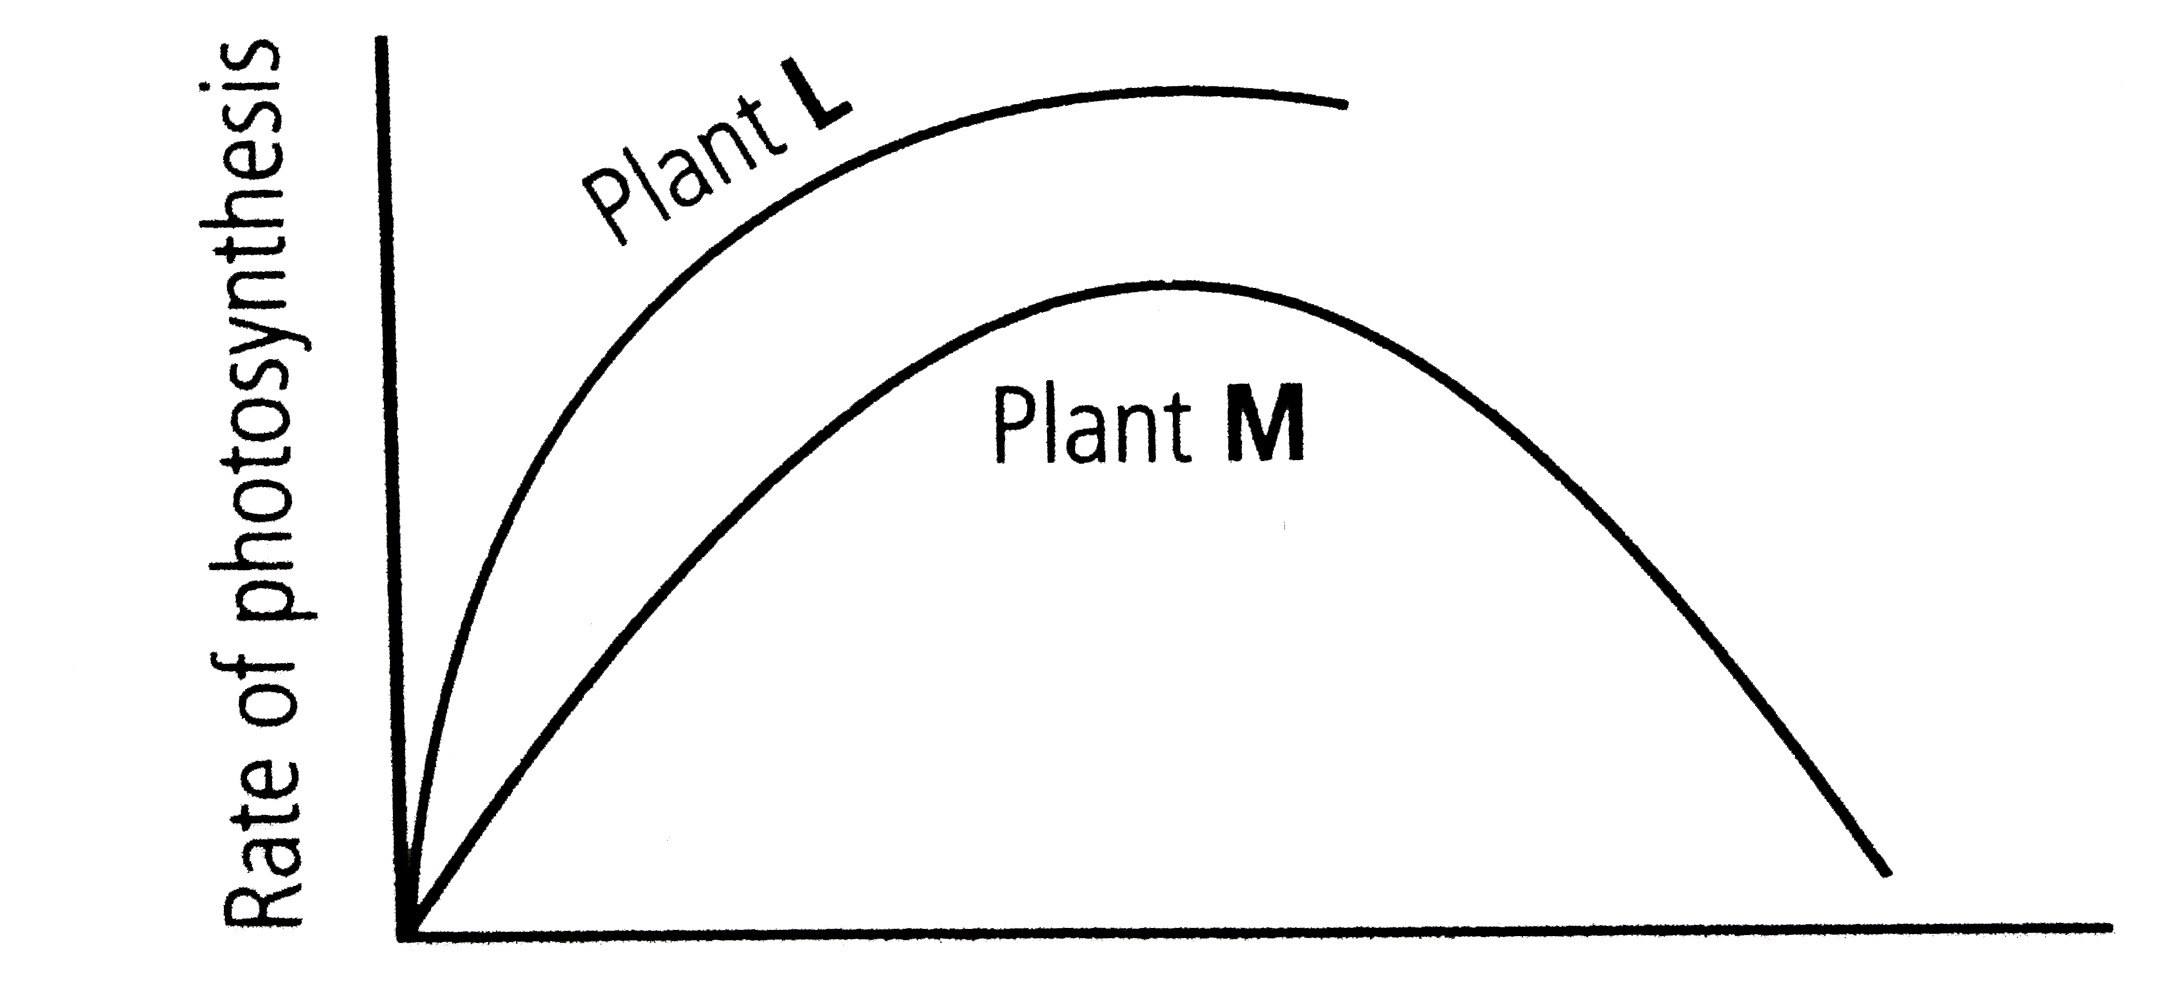
The graph indicates that06:06View SolutionIdentify the graph which correctly represents the spectral intensity versus wavelength graph at two temperatures T and T (TleT)
04:13View SolutionThe graph showing rate of photosynthesis at different wavelength of light is called
View SolutionThe rate of photosynthesis is the highest when a plant is exposed to
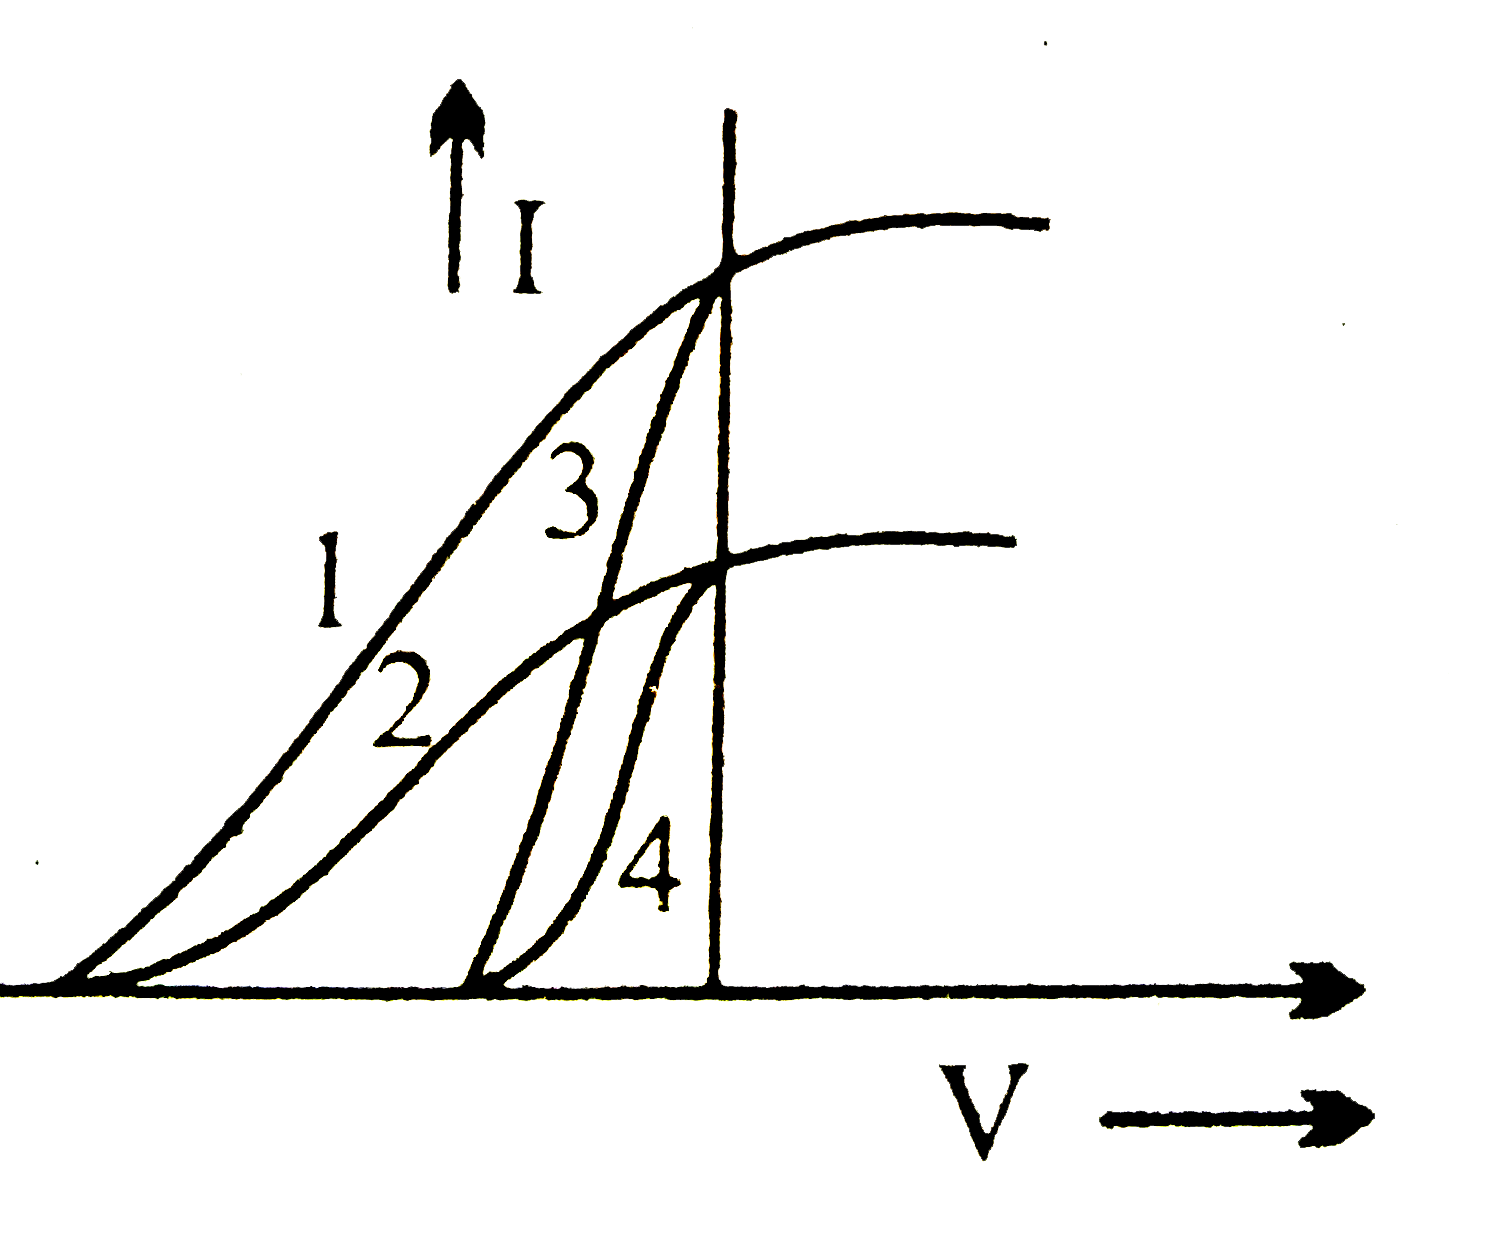
05:16View Solutionनिम्न ग्राफ दो विभिन्न प्रकाश संवेदी पदार्थो एवं विभिन्न तीव्रताओं के आपतित विकिरण के लिए आरोपित वोल्टता (V) के विरुद्ध प्रकाश-विद्युत धारा में परिवर्तन को प्रदर्शित करता है। पदार्थो के युग्मो की पहचान कीजिए जो विभिन्न पदार्थो किन्तु सामान तीव्रता के आपतित विकिरण के सांगत है।
 03:27View Solution
विश्लेषक से निर्गत प्रकाश की तीव्रता का परिवर्तन प्रदर्शित करने वाला ग्राफ बनाइए।
02:02View SolutionWhich of the following graphs correctly gives the relationship between the rate of photosynthesis and light intensity
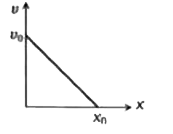
View Solutionदिये गये ग्राफ में विस्थापन के सापेक्ष वेग के परिवर्तन को दिखाया गया है, तो निम्न में से कौनसा ग्राफ सही रूप में विस्थापन के सापेक्ष त्वरण में परिवर्तन को दर्शाता है
 02:07View Solution
Graph by intensity of light and leaves of plants CO_2 Shows the relationship between donor and acceptability of light when the intensity of light is zero CO_2 Why is delivery higher
04:16View SolutionThe graph showing rate of Photosynthesis at different wavelengths of light is called
View Solution

