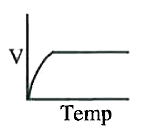
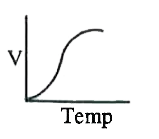
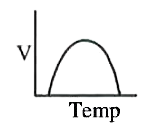
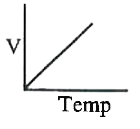
Which one of the given graphs shows the effect of temperature on the velocity of a typical enzymatic reaction?Solution in Telugu


The correct Answer is:C
Step by step video, text & image solution for Which one of the given graphs shows the effect of temperature on the velocity of a typical enzymatic reaction? by Biology experts to help you in doubts & scoring excellent marks in Class 11 exams.
Updated on:21/07/2023Topper's Solved these Questions
- BIOMOLECULESBOOK - AAKASH SERIESCHAPTER - BIOMOLECULESEXERCISE - EXERCISE - III (Previous AIPMT/NEET Questions)
84 Videos
- BIOMOLECULESBOOK - AAKASH SERIESCHAPTER - BIOMOLECULESEXERCISE - EXERCISE - III (Previous AIPMT/NEET Questions) (Enzymes)
11 Videos
- BIOMOLECULESBOOK - AAKASH SERIESCHAPTER - BIOMOLECULESEXERCISE - EXERCISE - II (Nucleic acids)
59 Videos
- BIOLOGICAL CLASSIFICATIONBOOK - AAKASH SERIESCHAPTER - BIOLOGICAL CLASSIFICATIONEXERCISE - EXERCISE-III (Previous AIPMT/NEET Question)
37 Videos
- CELL CYCLE AND CELL DIVISIONBOOK - AAKASH SERIESCHAPTER - CELL CYCLE AND CELL DIVISIONEXERCISE - Exercise-III
18 Videos
Similar Questions
Anaphase promoting complex (APC) is a protein degradation machinery necessary for proper mitosis of animal cells. If APC is defective in a human cell, which of the following is (2017) expected to occur ?
View SolutionSelect the option which is not correct with respect to enzyme action:
View SolutionPurine without ketonic group is
View SolutionWhich among the following are the smallest living known without a definite cell wall, pathogenic to plants as well as animals and can survive without oxygen ?
View SolutionWhich of the following options gives the correct sequences of events during mitosis?
View SolutionThe given graph shows the variation of velocity with displacement. Which one of the graphs given below correctly represents the variation of acceleration with displacement ?

View SolutionWhich of the following graphs describes the typical dependence of the rate constant of a reaction on temperature ?
View SolutionWhich one of the given graphs shows the effect of pH on the velocity of a typical enzymatic reaction (V) ?
View SolutionWhich graph represents the effect of pHk/temp on the velocity of a typical enzymatic reaction (V)
View SolutionShow on a graph, the variation of resistivity with temperature for a typical semiconductor.
View SolutionShow on a graph the variation of resistivity with temperature for a typical semiconductor
View Solutionनिम्न में से कौन सा ग्राफ एक प्रारूपिक एन्जाइम अभिक्रिया के वेग (V) पर pH के प्रभाव को दर्शाता है?
View Solutionदिये गये ग्राफ में से कौन सा एक प्रारूपिक एन्जाइम अभिक्रिया के वेग पर ताप के प्रभाव को दर्शाता है?
View SolutionShow on a graph, the variation of resistivity with temperature for a typical semiconductor.
View SolutionWhich one of the given graphs shows the effect of pH on the velocity of a typical enzymatic reaction (V) ?
View SolutionThe following graph shows the relationship between subtrate concentration and rate of enzymatic reaction. What is the effect of subtrate concentration on rate of reaction ? And identify A.
View Solution