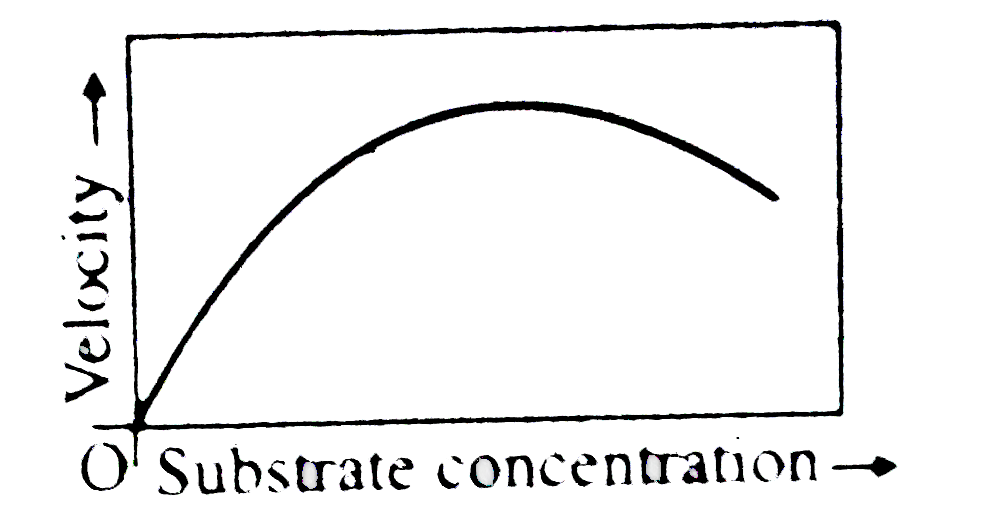
The following graph shows the relationship between subtrate concentration and rate of enzymatic reaction. What is the effect of subtrate concentration on rate of reaction ? And identify A.Solution in Malayalam
Step by step video & image solution for The following graph shows the relationship between subtrate concentration and rate of enzymatic reaction. What is the effect of subtrate concentration on rate of reaction ? And identify A. by Biology experts to help you in doubts & scoring excellent marks in Class 11 exams.
Topper's Solved these Questions
Similar Questions
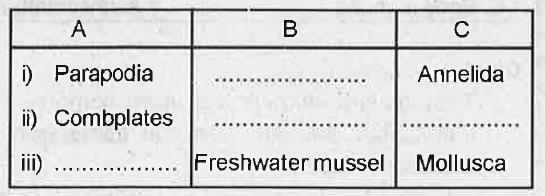
Fill in the blanks.
 01:39View Solution
Name the double walled membrane of human heart. (Cuticle, Pleura, Pericardium, Sarcolemma)
03:51View SolutionWhich of the following graphs shows the relationship between the rate of an enzymatic activity and substrate concentration (S) ?
04:33View SolutionThe given graph shows the effect of substrate concentration on the rate of reaction of the enzyme green gram-phosphatase

What dose the graph indicate01:39View SolutionThe given graph shows the effect of substrate concentration on the rate of reaction of the enzymes green gram-phosphatase. What does the graph indicate ?
 View Solution
Which of the following graphs shows the relationship between the rate of an enzymatic activity and substrate concentration (S) ?
View SolutionThe given graph shows the effect of substrate concentration on the rate of reaction of the enzyme green-gram-phosphatase What does the graph indicate?
View SolutionFor the reaction between A and B, the relationship between the concentration of A and B and rate is given by the reaction is
02:14View SolutionWhat is rate law?Give a relation between rate of reaction and concentration of reactant?
05:00View SolutionWhich of the following graphs shows the relationship between the rate of an enzymatic activity and substrate concentration (S) ?
05:48View SolutionThe concentration of a substrate is allowed to increase continuously. Explain the effect of this rise on the rate of enzymatic reaction.
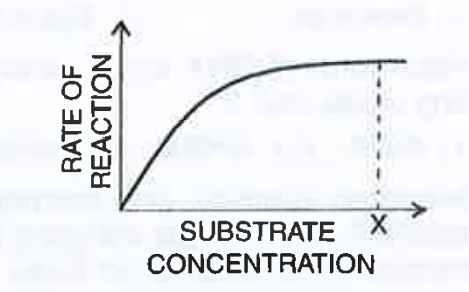
02:07View SolutionThe given graph is showing the relationship between the rate of enzyme reaction and concentration of substrate. At concentration of substrate greater than X, the
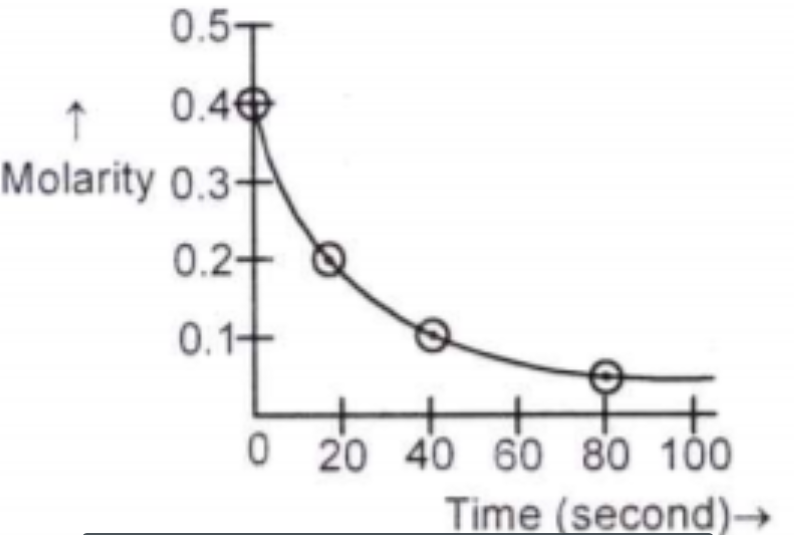
01:12View SolutionA reaction follows the given concentration-time graph The rate for this reaction at 20 s will be
 03:43View Solution
Following graph is a plot of the rate of reaction concentration of the reactant. What is the order of the reaction.
06:01View SolutionThe given graph is showing the relationship between the rate of enzyme reaction and concentration of substrate. At concentration of substrate greater than X, the
 02:29View Solution

