The activity R of and unknown radioactive nuclide is measured at hourly intervals. The result found are tabulated as follows

(i) Plot the graph of R versus t and calculate half-life from the graph.
(ii) Plot the graph of In (RR0) versus r and obtain the value of half-life from the graph.
Text Solution
In the table given below we have listed values of R(MBq) and in (RR0)

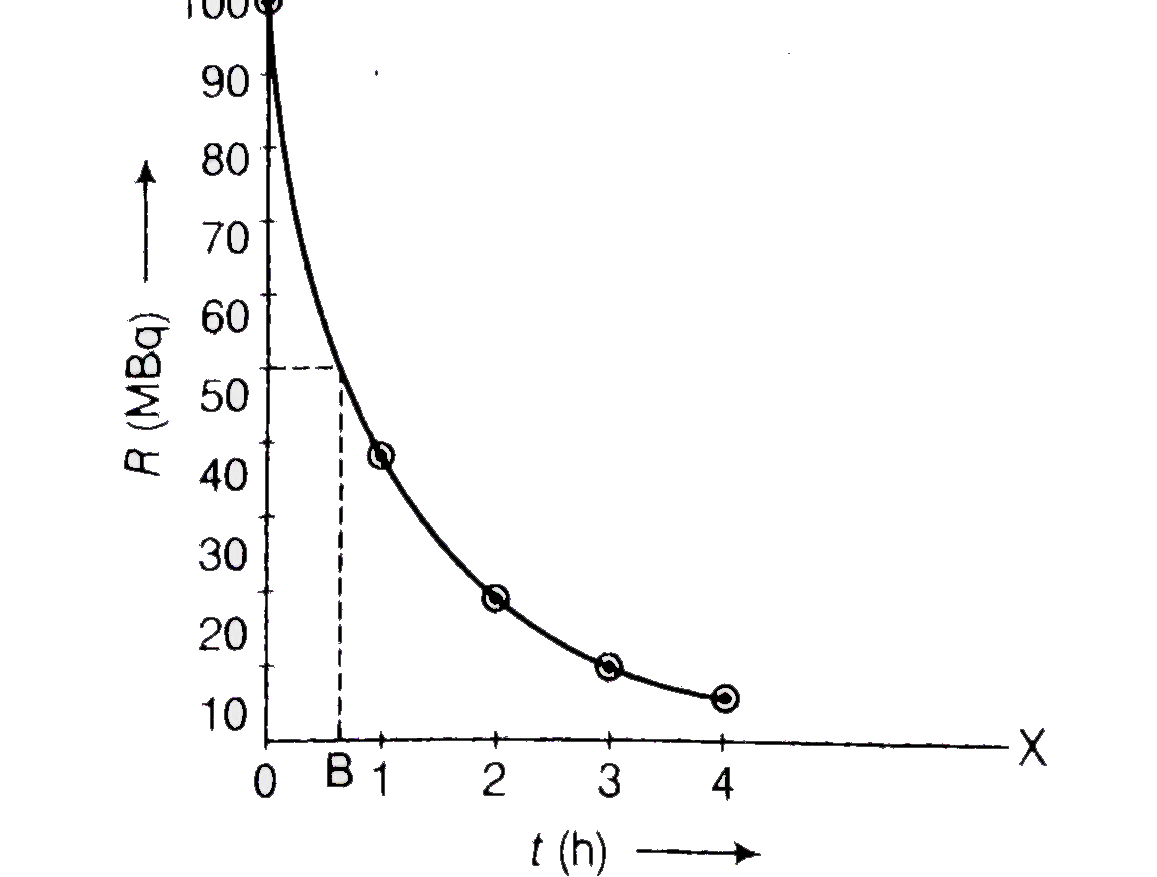
(i) When we plot the graph of R versus r. we obtain an expoential curve as shown.

from the graph we can say that activity R reduces to 50% in t=OB=40 min
So t1/2=40 min
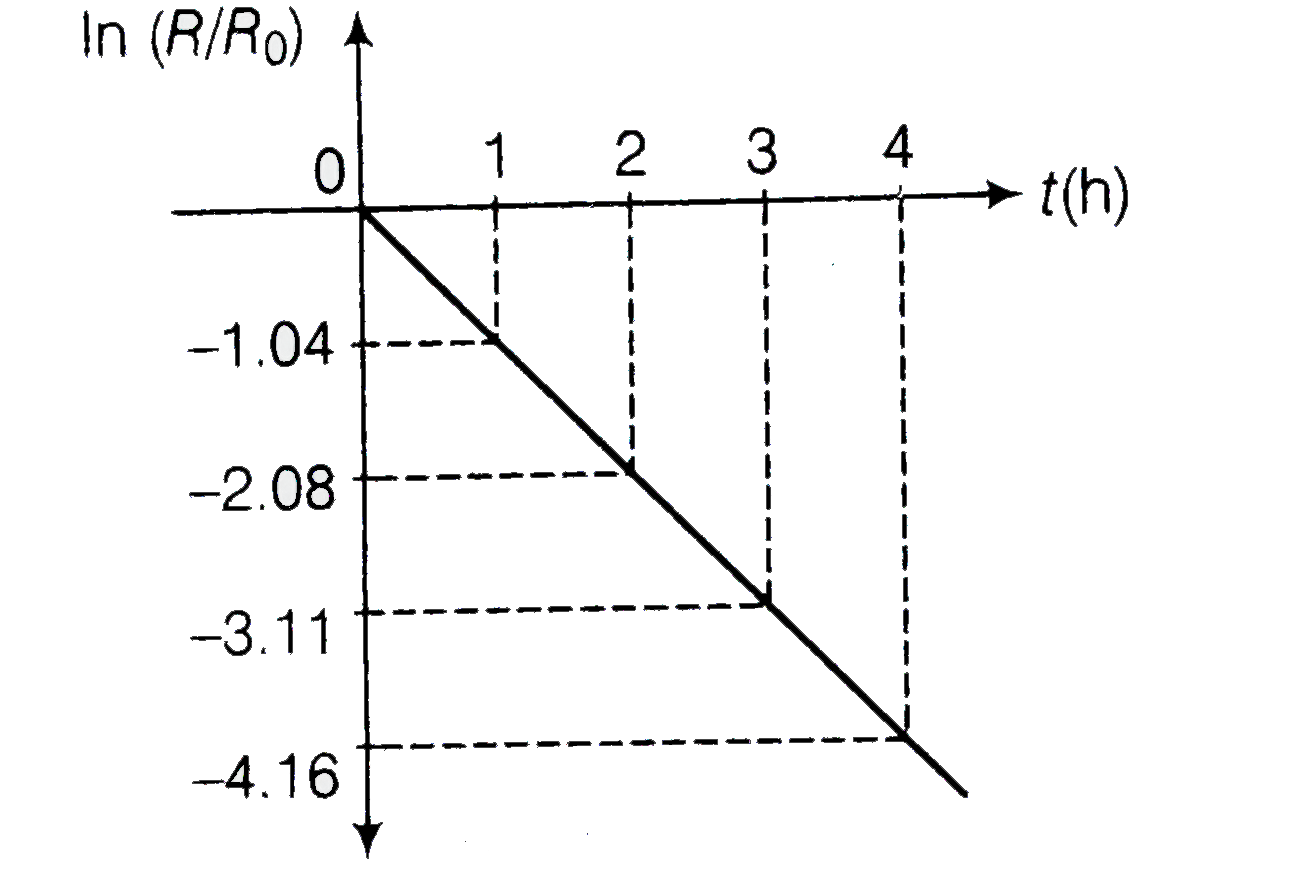
(ii) The adjacent figure shows the graph of in (R/R0) versus t

Slope of this graph =−λ
from the graph λ=−(−4.16−3.111)⇒=1.05h−1
Half-life T1/2=0.693λ=0.0=6931.05=0.66h
=39.6 min=40 min
|
Topper's Solved these Questions
Similar Questions
Knowledge Check
The graph of 1n(RR0) versus 1nA(R=radius of a nucleus and A= its mass number) is
AA straight lineBA parabolaCAn ellipseDNone of themThe graph of 1n(RR0) versus 1nA(R=radius of a nucleus and A= its mass number) is
AA straight lineBA parabolaCAn ellipseDNone of themFor a planet, the graph of T2 against r3 is plotted. The slope of the graph is
A4πGMB4π2GMCGM4π2DGM4π
Draw E and V versus r on the same graph for a point charge.
View SolutionDraw E and V versus r on the same graph for a point charge.
View SolutionPlot a graph between |E| and r for the cause r<R and r>R
View SolutionIf R is the radius and A is the mass number, then log R versus log A graph will be
View SolutionThe graph shows the log of activity (logR) of a radioactive material as a function of time t in minutes

The half -life (in minutes) for the decay is closest to
View Solution
