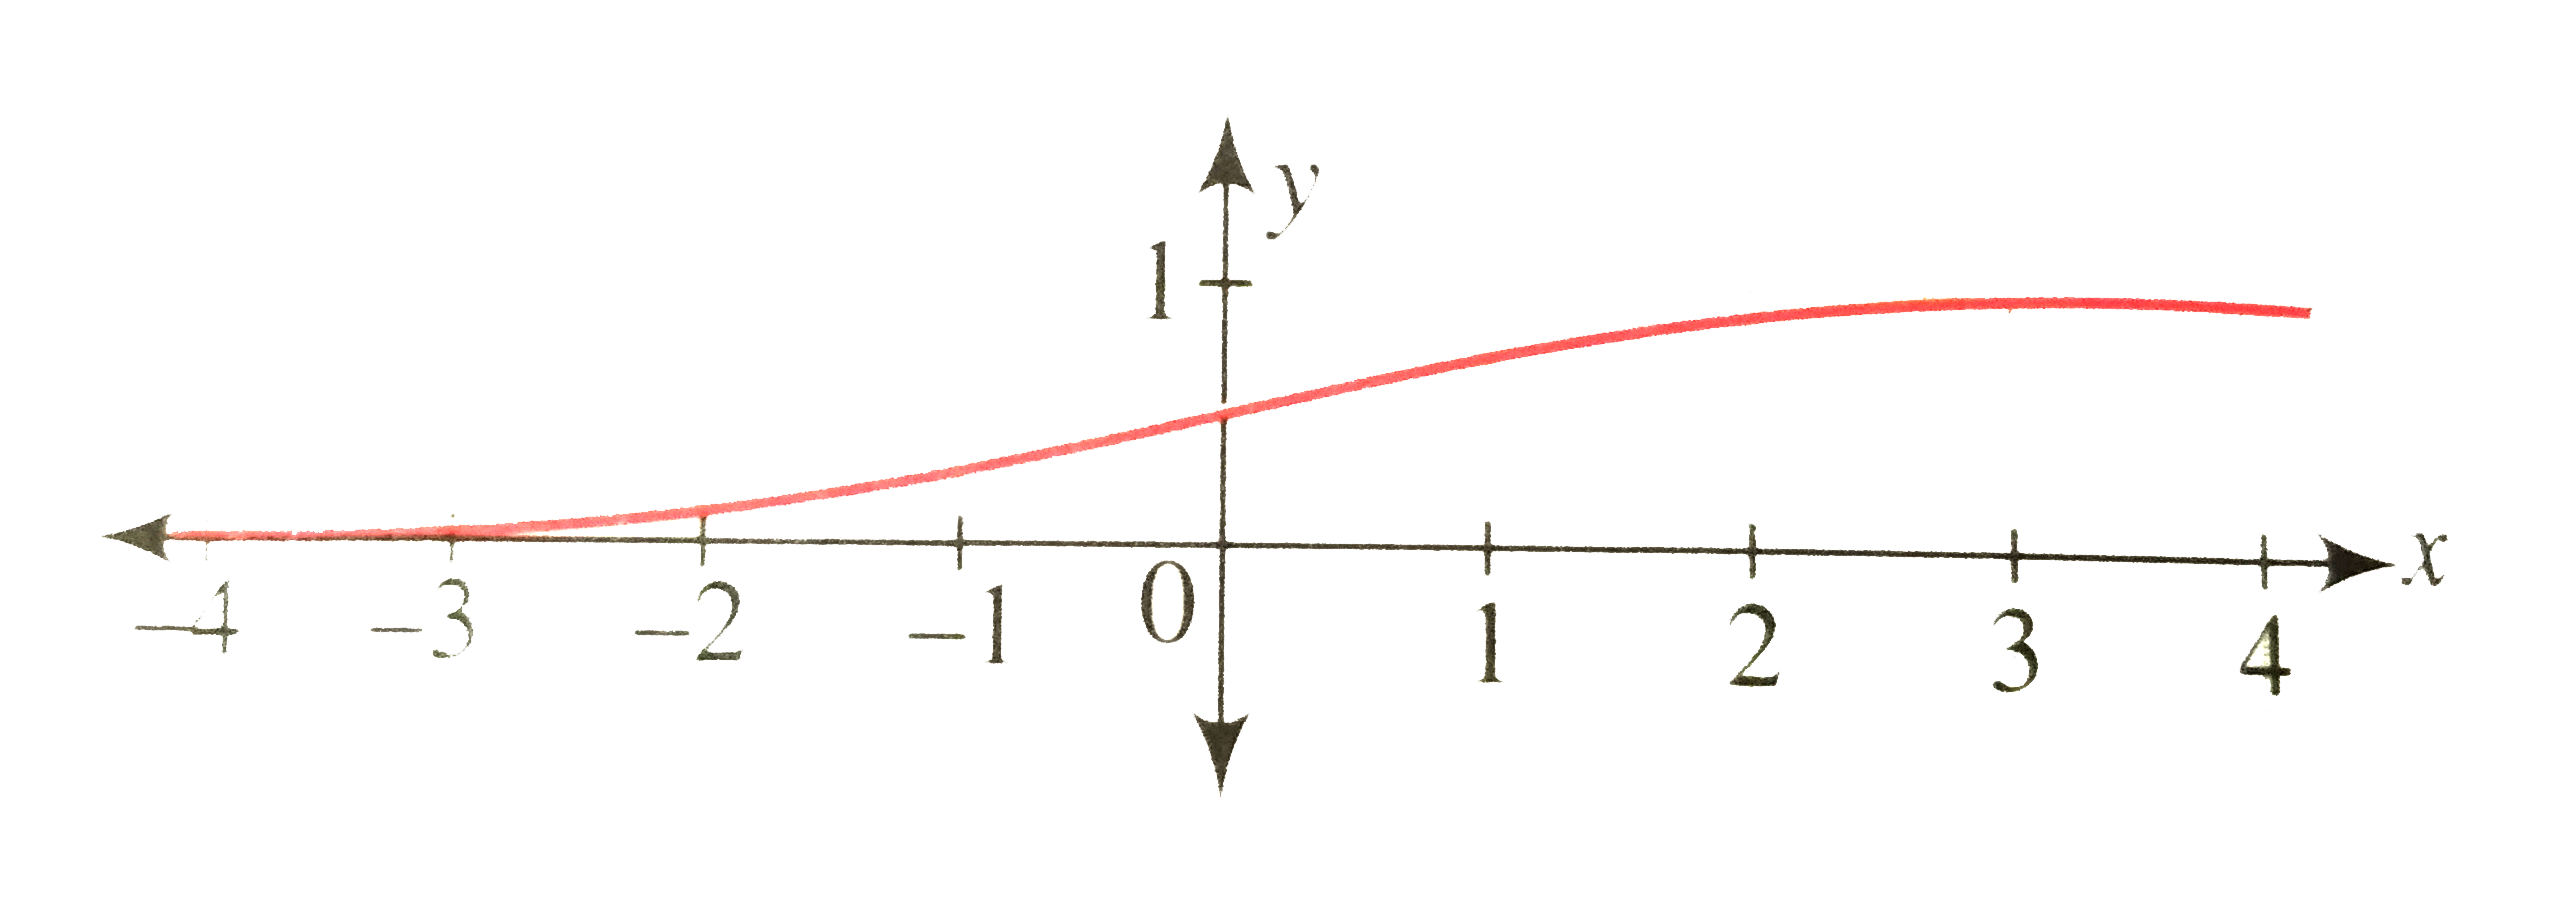
Draw the graph of . Also find the point of inflection.
Video Solution
Text Solution
So is an increasing function.
Also, and
Hence the graph of is as shown in the following figure.

Clearly, from the graph, y=0 and y=1 are asymptotes.
Also
So is the point of inflection where the curve its concavity as shown in the figure.
|
Topper's Solved these Questions
Similar Questions
Draw the graph of f(x)=esinx.
View SolutionDraw the graph of y=sin−1(logex). Also find the point of inflection.
View SolutionDraw the graph of f(x)=√1−e−x2
View SolutionDraw the graph of y=ex+e−2x
View SolutionDraw the graph of f(x)=|x−1|x−1.
View SolutionDraw the graph of y=f(x)=x+1x2+1
View SolutionDraw the graph of f(x)=x3−xx2−1.
View SolutionDraw the graph of f(x)=2|x−1|x2+1.
View SolutionDraw the graph of f(X)=loge(1−logex). Find the point of inflection
View SolutionDraw the graph of f(x)=(x−1)|(x−2)(x−3)|.
View Solution
