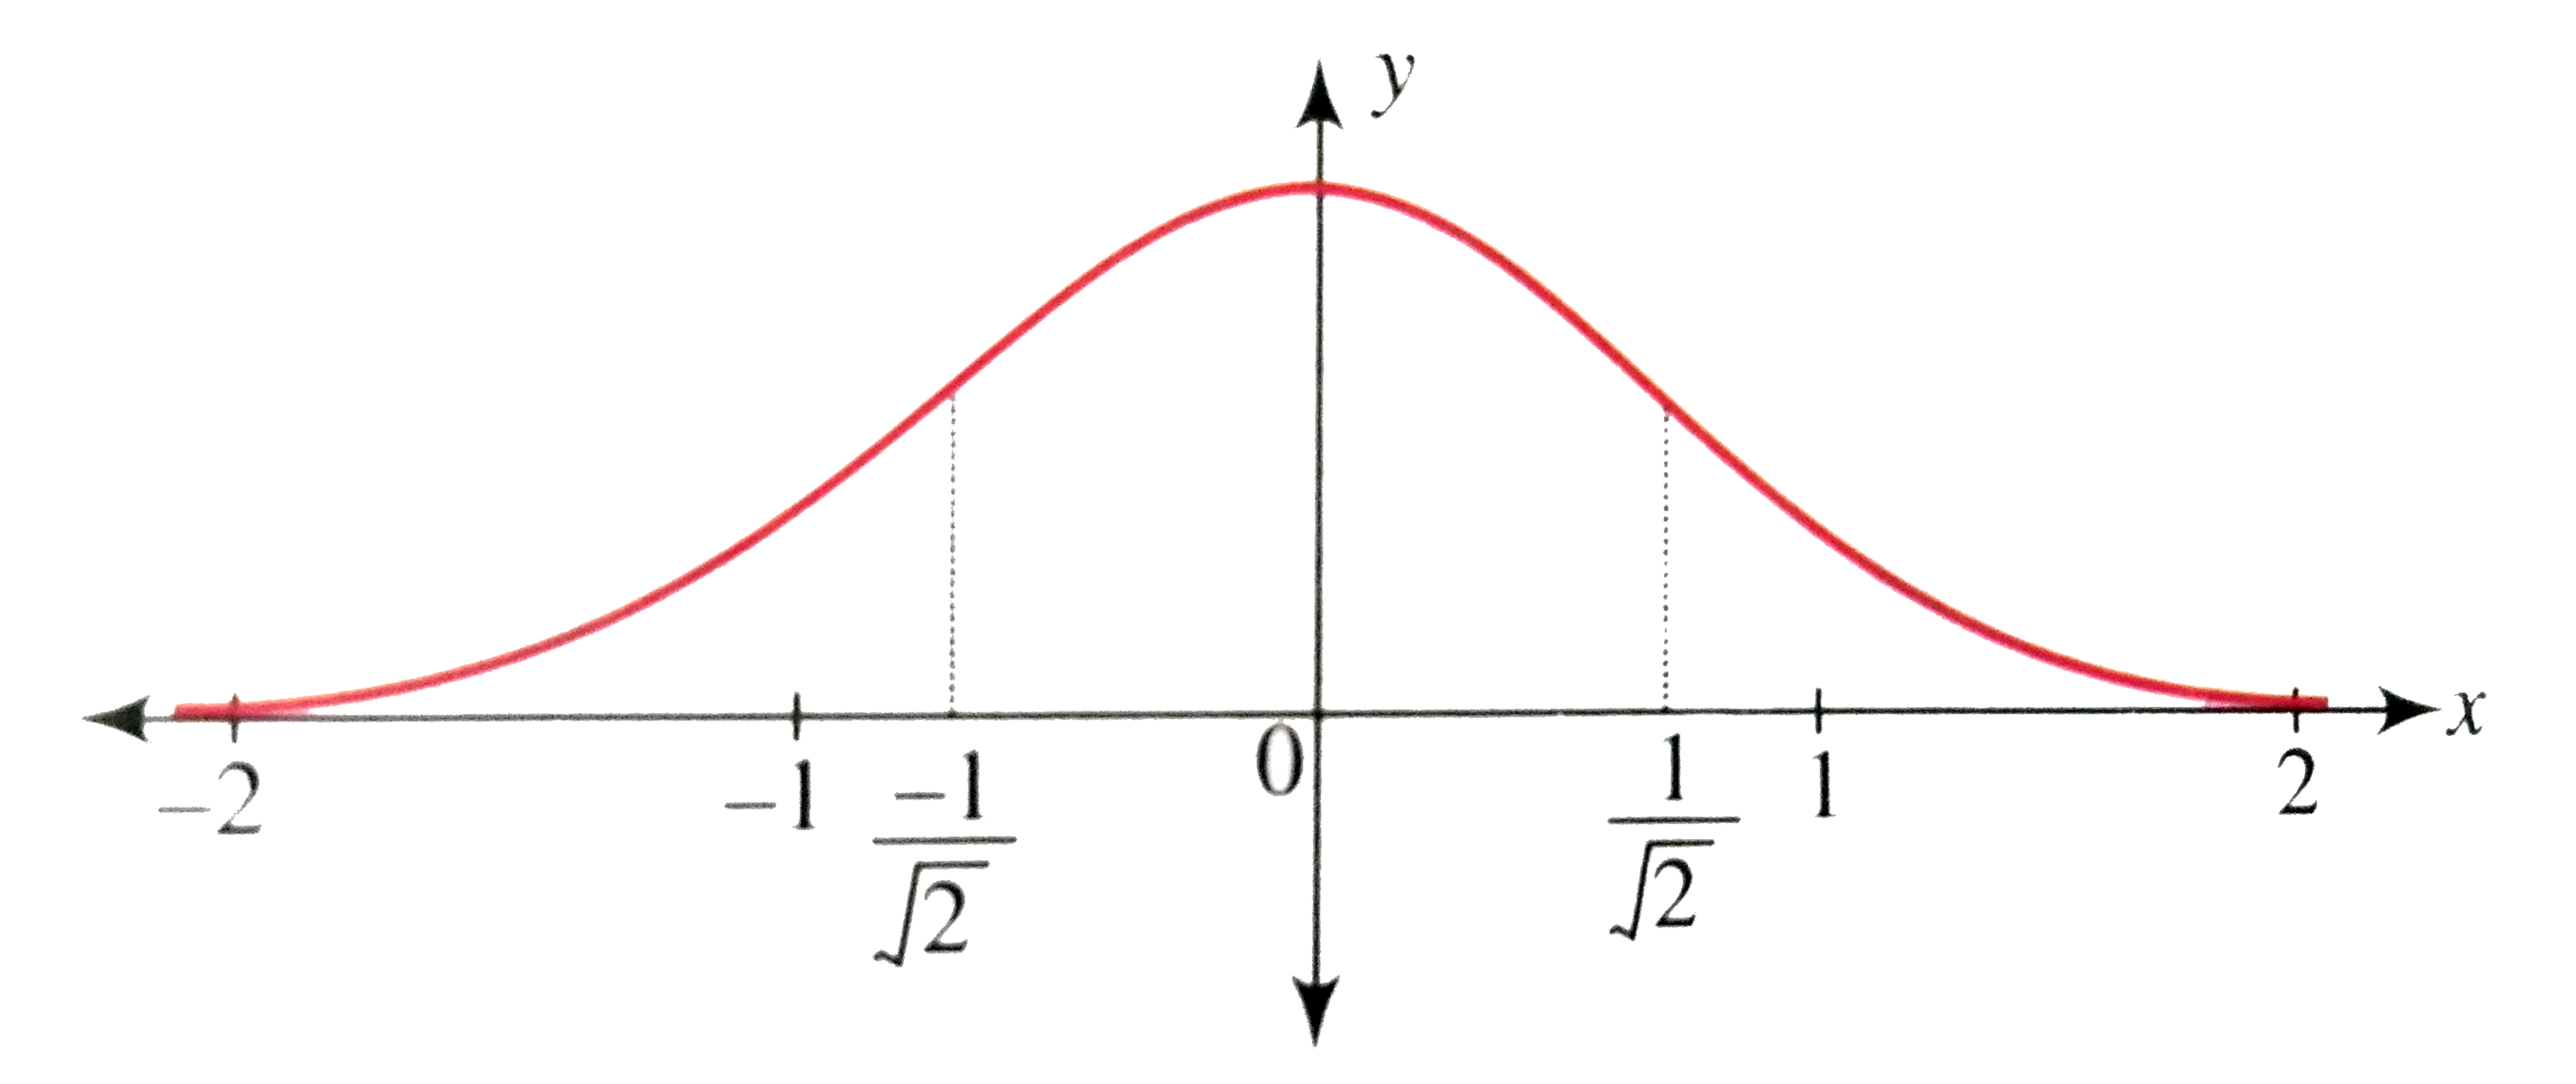
Draw the graph of f(x)=e−x2. Discuss the concavity of the graph.
Video Solution
Text Solution
We have y=f(x)=e−x2
Since, −∞<−x2≤0, we have 0<e−x2≤1
fx>0 for x<0 where f(x) increases and f′(x)<0 for x>0 where f(x) decreases.
f''(x)=−2e−x2+4x2e−x2=2e−x2(2x2−1)
f''(x)∴x=±1√2, where the graph changes concavity.
|x|>1√2 where the graph is concave upward.
The graph of the function is as shown in the figure.

|
Topper's Solved these Questions
Similar Questions
Draw the graph of y=ex+e−2x
View SolutionDraw the graph of f(x)=esinx.
View SolutionDraw the graph of f(x)=√1−e−x2
View SolutionDraw the graph of f(x)=(x+2)|x−1|.
View SolutionDraw the graph of f(x)=x|x|.
View SolutionDraw the graph of f(x)=1x2−2x+2.
View SolutionDraw the graph of f(x)=sec−1(secx)
View SolutionDraw the graph of y=ex−e−x2.
View SolutionDraw the graph of y=f(x)=x+1x2+1
View SolutionDraw the graph of y=loge(x2−1)
View Solution
