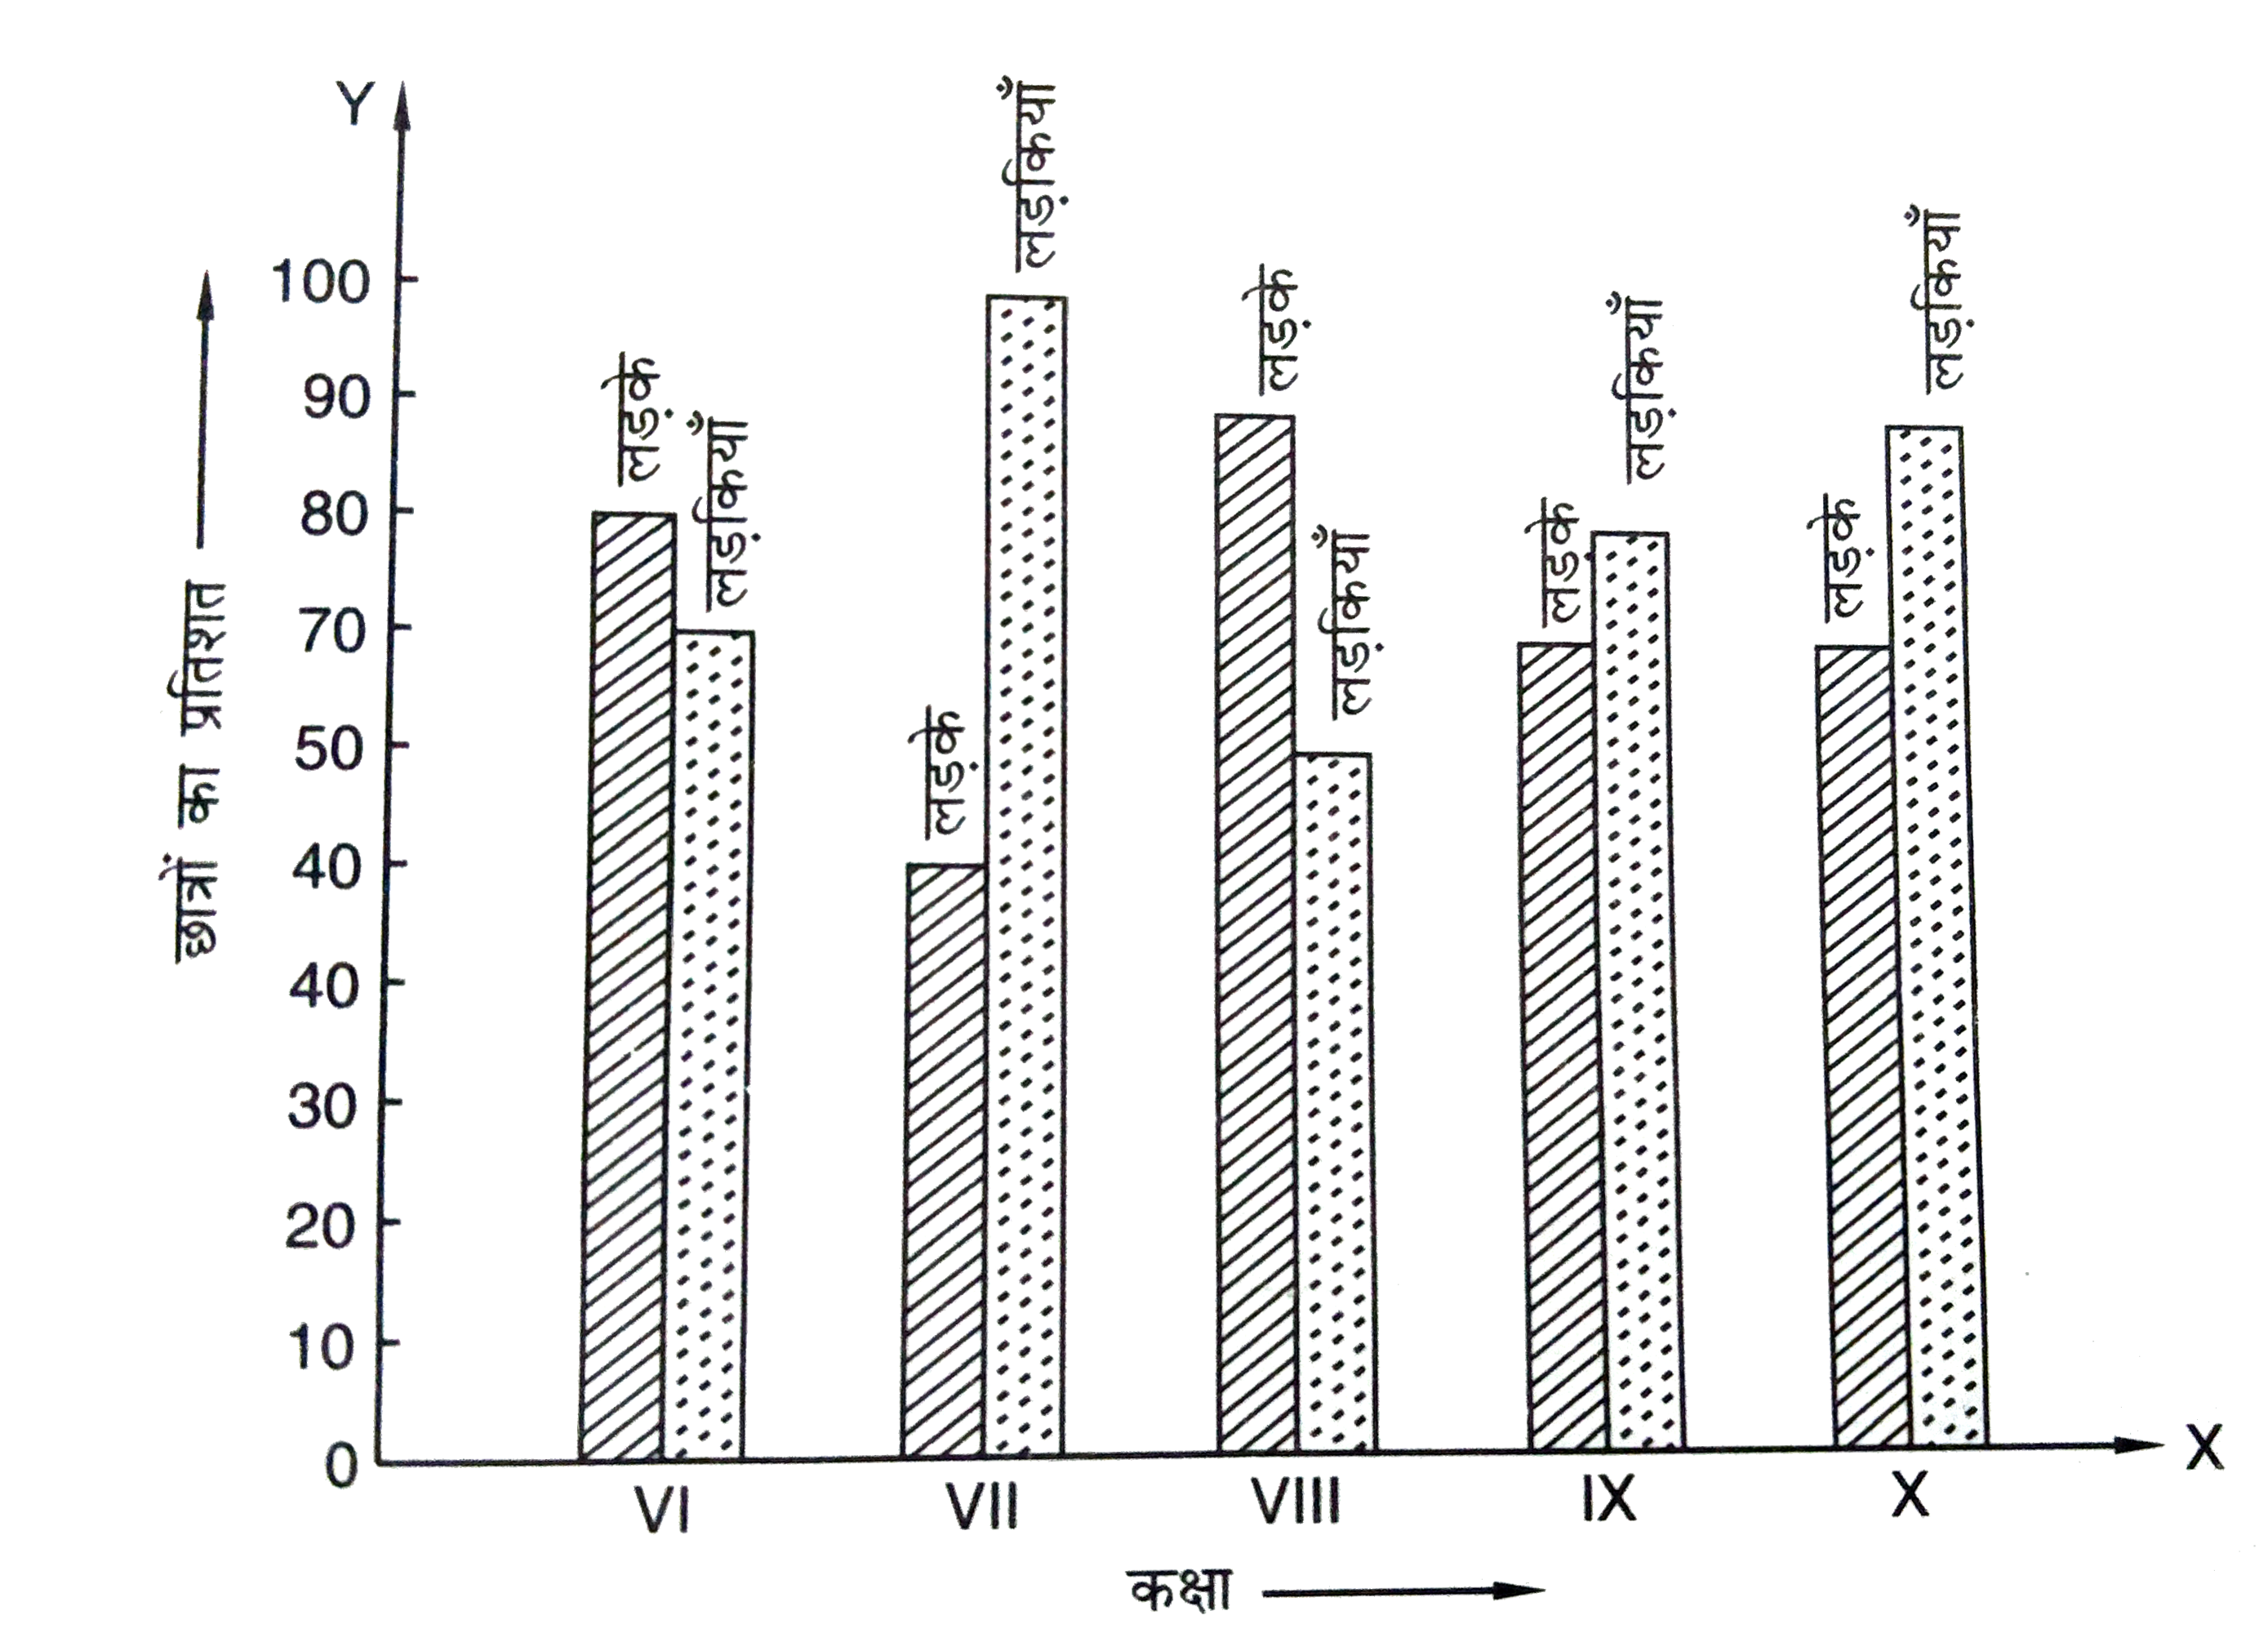
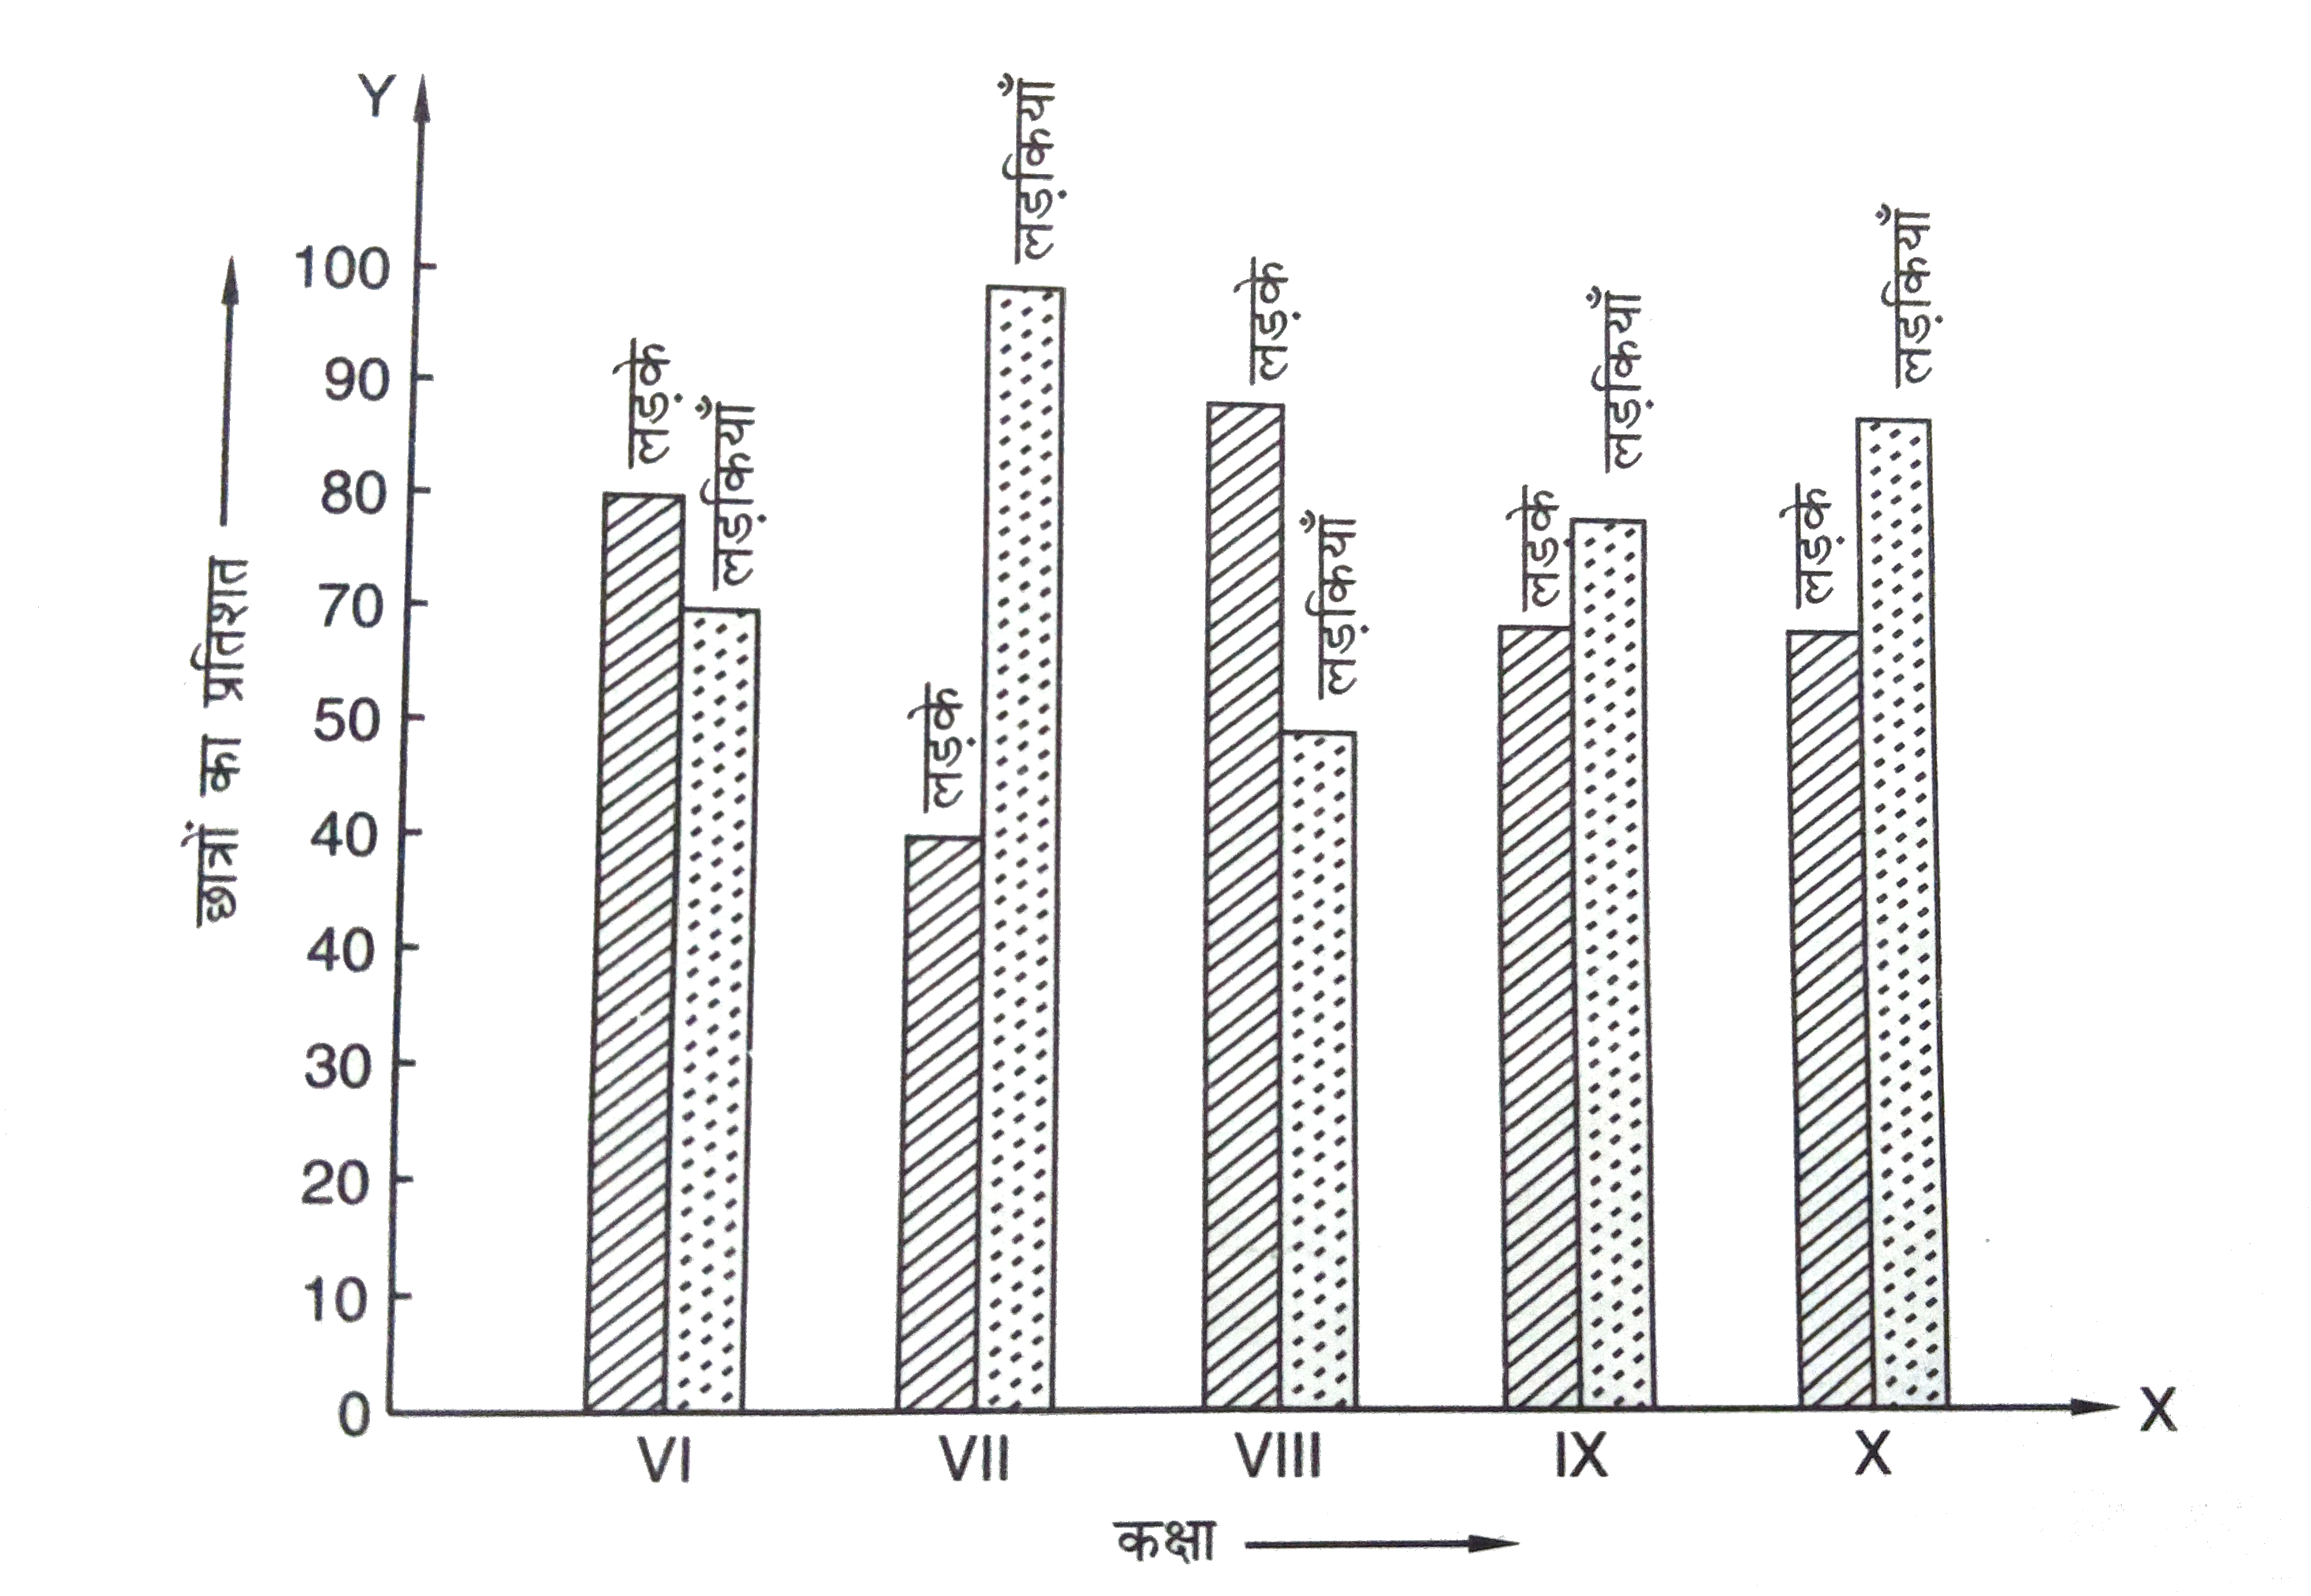
The following bar graph shows the results of an annual examination in a secondary school. Read the bar graph (Figure) and choose the correct alternative in each of the following: The pair of classes in which the results of boys and girls are inversely proportional are: (a) VI, VIII (b) VI, IX (c) VIII, IX (d) VIII, X The class having the lowest failure rate of girls is VII (b) X (c) IX (d) VIII The class having the lowest pass rate of students is VI (b) VII (c) VIII (d) IX
Step by step video & image solution for The following bar graph shows the results of an annual examination in a secondary school. Read the bar graph (Figure) and choose the correct alternative in each of the following: The pair of classes in which the results of boys and girls are inversely proportional are: (a) VI, VIII (b) VI, IX (c) VIII, IX (d) VIII, X The class having the lowest failure rate of girls is VII (b) X (c) IX (d) VIII The class having the lowest pass rate of students is VI (b) VII (c) VIII (d) IX by Maths experts to help you in doubts & scoring excellent marks in Class 9 exams.
Updated on:21/07/2023Topper's Solved these Questions
Similar Questions
Show that (x−2) is a factor of the polynomial f(x)=2x3−3x2−17x+30 and hence factorize f(x).
View SolutionA floral design on the floor of a building consists of 280 tiles. Each tile is in the shape of a parallelogram of altitude 3 cm and base 5 cm. Find the cost of polishing the design at the rate of 50 paise per cm2 .
View SolutionThe following bar graph shows the results of an annual examination in a secondary school. Read the bar graph (Figure) and choose the correct alternative in each of the following: The pair of classes in which the results of boys and girls are inversely proportional are: (a) VI, VIII (b) VI, IX (c) VIII, IX (d) VIII, X The class having the lowest pass rate of students is: VII (b) X (c) IX (d) VIII The class having the lowest pass rate of students is: VI (b) VII (c) VIII (d) IX
View SolutionComplete the following reaction : i. ii. iii. iv. v. vi vii. viii ix. x.
View SolutionThe following table shows the number of students in different classes of a high school. Draw a histogram to represent the given data.
ClassesVIVIIVIIIIXXNumber of students3742355048
View Solutionनिम्न दंड आलेख किसी माध्यमिक विद्यालय के वार्षिक परीक्षा परिणाम को दर्शाता है । दंड आलेख को पढ़कर सही उत्तर का चुनाव करो :

(i) उन कक्षाओं के जोड़े जिसमे लड़के और लड़कियों के परिणाम व्युत्क्रम अनुपात में होते है ।
View Solutionनिम्न दंड आलेख किसी माध्यमिक विद्यालय के वार्षिक परीक्षा परिणाम को दर्शाता है । दंड आलेख को पढ़कर सही उत्तर का चुनाव करो :

(ii) वह कक्षा जिसमे लड़कियों की असफलता दर सबसे कम हो :
View SolutionWhat is the ratio of students participating in Song from Class VII and IX together to the students participating in Play from class VI and VIII together ?
View SolutionThe enrolment of a secondary school in different classes is given below : Class VI VII VIII IX X Enrolment 600 500 400 700 200. Draw a pie chart to represent the above data.
View SolutionThe following bar graph shows the results of an annual examination in a secondary school. Read the bar graph (Figure) and choose the correct alternative in each of the following: The pair of classes in which the results of boys and girls are inversely proportional are:
(a) VI, VIII (b) VI, IX (c) VIII, IX (d) VIII, X

View Solutionਛੇ ਵੱਖ-ਵੱਖ ਜਮਾਤਾਂ ਦੇ ਵਿਦਿਆਰਥੀਆਂ ਦੀ ਸੰਖਿਆ ਹੇਠਾਂ ਦਿੱਤੀ ਗਈ ਹੈ। ਇਹਨਾਂ ਅੰਕੜਿਆਂ ਨੂੰ ਇੱਕ ਛੜ ਗ੍ਰਾਫ ਨਾਲ ਦਰਸਾਓ:
 ਹੇਠ ਲਿਖੇ ਪ੍ਰਸ਼ਨ ਦੇ ਉੱਤਰ ਦਿਉ: ਛੇਵੀਂ ਜਮਾਤ ਦੇ ਵਿਦਿਆਰਥੀਆਂ ਦੀ ਸੰਖਿਆ ਅੱਠਵੀਂ ਜਮਾਤ ਦੇ ਵਿਦਿਆਰਥੀਆਂ ਦੀ ਸੰਖਿਆ ਦਾ ਅਨੁਪਾਤ ਪਤਾ ਕਰੋ।
View SolutionAnswer the given question by studying the following bar graph carefully: What is the ratio of boys to girls in class VIII?
View SolutionThe following graph shows the number of boys and girls in class V, class VI, class VII and class VIII. Study the graph and answer the question.
निम्नलिखित आरेख कक्षा V, कक्षा VI, कक्षा VII और कक्षा VIII में लड़कों और लड़कियों की संख्या दर्शाता है। आरेख का अध्ययन करें और प्रश्न का उत्तर दें। What is the average number of girls in all the classes?
सभी कक्षाओं में लड़कियों की औसत संख्या क्या है?
View SolutionThe given data shows the number of boys in classes V to X of a school. What is the difference between the number of boys in class VI and class IX?
View SolutionThe given bar graph, shows the number of students in different classes. Find the total number of students in the classes VIII to X.
View Solution