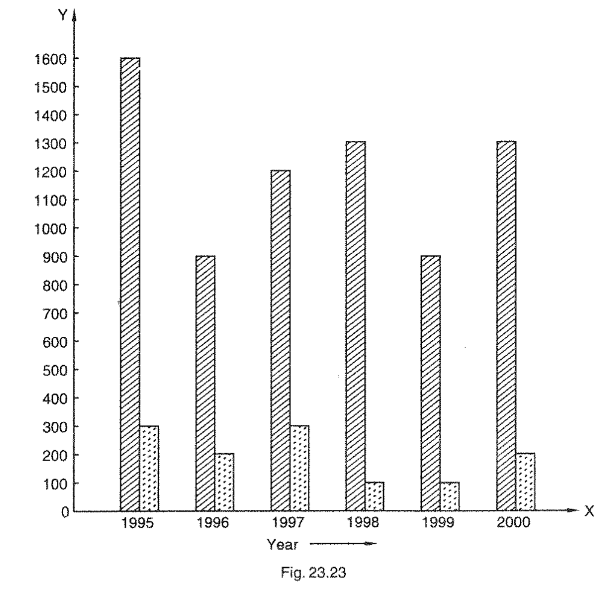
The following bar graph shows the results of an
annual examination in a secondary school. Read the bar graph (Figure) and
choose the correct alternative in each of the following:
The pair of classes in which the results of
boys and girls are inversely proportional are:
(a) VI, VIII (b) VI, IX (c)
VIII, IX (d) VIII, X

Step by step video & image solution for The following bar graph shows the results of an annual examination in a secondary school. Read the bar graph (Figure) and choose the correct alternative in each of the following: The pair of classes in which the results of boys and girls are inversely proportional are: (a) VI, VIII (b) VI, IX (c) VIII, IX (d) VIII, X by Maths experts to help you in doubts & scoring excellent marks in Class 6 exams.
Updated on:21/07/2023Topper's Solved these Questions
Similar Questions
The following bar graph shows the number of persons killed in industrial accidents in a country for some years (Figure) Read the bar graph and choose the correct alternative in each of the following: The year which shows the maximum percentage increase in the number of persons killed in coal mines over the preceding year is:

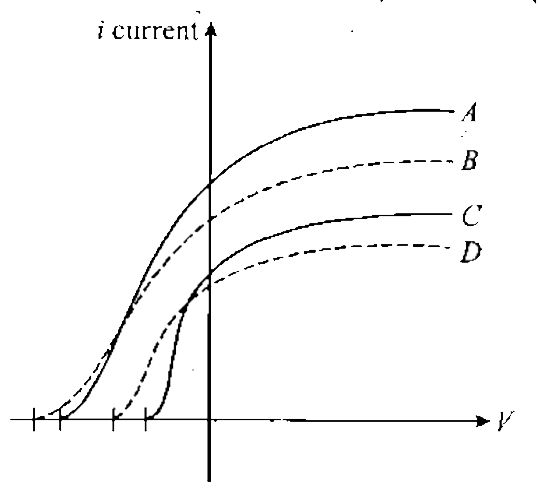
View SolutionThe figure shows the results of an experiment involving photoelectric effect. The graphs A, B,C and D relate to a light beam having different wavelengths. Select the correct alternative.

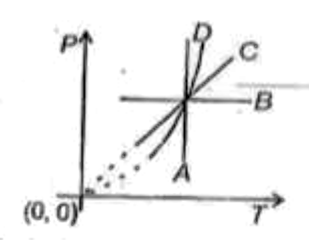
View SolutionFollowing figure shows P-T graph for four processes A, B, C and D.Select the correct alternative

View SolutionThe following data gives the amount of manure (in thousand tonnes) manufactured by a company during some years: year 1992 1993 1994 1995 1996 1997 Manure (in thousand tonnes) 15 35 45 30 40 20 (i) Represent the above data with the help of a bar graph. (ii) Indicate with the help of the bar graph the year in which the amount of manufactured by the company was maximum. (iii) Choose the correct alternative: The consecutive years during which there was maximum decrease in manure production are: (a 1994 and 1995 (b) 1992 and 1993(c) 1996 and 1997 (d) 1995 and 1996
View SolutionThe following data gives the amount of manure (in thousand tonnes) manufactured by a company during some years: Year 1992 1993 1994 1995 1996 1997 Production (in Thousand tonnes) 15 35 45 30 40 20 Represent the above data with the help of a bar graph. Indicate with the help of the bar graph the year in which the amount of manufactured by the company was maximum. Choose the correct alternative: The consecutive years during which there was maximum decrease in manure production are: 1994 and 1995 (b) 1992 and 1993 1996 and 1997 (d) 1995 and 1996
View SolutionThe following data gives the amount of manure (in thousand tonnes) manufactured by a company during some years: Year, 1992, 1993, 1994, 1995, 1996, 1997 Manure (In thousand tonnes), 15, 35, 45, 30, 40, 20 Represent the above data with the help of a bar graph. Indicate with the help of the bar graph the year in which the amount of manure manufactured by the company was maximum. Choose the correct alternative: The consecutive years during which there was maximum decrease in manure production are: 1994 to 1995 (b) 1992 and 1993 1996-1997 (d) 1995 and 1996
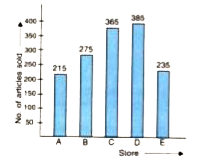
View SolutionThe given bar graph shows the number of identical articles sold by 5 different stores A, B, C, D and E during a particular month.

Study the bar graph and answer the following questions :
(i) Which store sold the largest number of articles ?
(ii) By what per cent is the sale of store D more than that of store B ?
(iii) Find the ratio of the total sale of the two highest selling stores to the total sale of the two least selling stores.
(iv) By how much must store E increase its sale to catch up with its nearest rival store ?
View SolutionIn a school, there are five sections of class IX. The number of students in each section is given below. Construct a bar graph representing this data: Section: A B C D E No. of Students 40 48 52 45 30
View SolutionIn a quadrilateral, define each of the following:
(i) Sides (ii) Vertices (iii) Angles (iv) Diagonals (v) Adjacent angles (vi) Opposite Sides (vii)Opposite sides (viii) Opposite angles (ix) Interior (x)Exterior
View SolutionThe number of girl students in each class of a co-educational middle school is depicted by the pictograph Observe this pictograph and answer the following questions :(a) Which class has the minimum number of girl students?(b) Is the number of girls in Class VI less than the number of girls in Class V?(c) How many girls are there in Class VII?
View Solution
