Read the following bar graph and answer the following questions: What information is given by the bar graph? Which state is the largest producer of rice? Which state is the largest producer of wheat? Which state has total production of rice and wheat as its maximum? Which state has the total production of wheat and rice minimum?
Step by step video & image solution for Read the following bar graph and answer the following questions: What information is given by the bar graph? Which state is the largest producer of rice? Which state is the largest producer of wheat? Which state has total production of rice and wheat as its maximum? Which state has the total production of wheat and rice minimum? by Maths experts to help you in doubts & scoring excellent marks in Class 6 exams.
Updated on:21/07/2023Topper's Solved these Questions
Similar Questions
Read the bar graph and answer the following questions.
What information is given by the bar graph?

View SolutionWhich state is the largest producer of mineral oil ?
View SolutionRead the given bar graph and answer the question that follow :

What information is represented by the bar graph?
View SolutionRead the following bar graph given in Figure and answer the following questions: What information is given by this bar graph? Which two states have same production in 1993-94? Name the state having same production in both the years? Which state has minimum production?
View SolutionRead the following bar graph given in Figure and answer the following questions: What information is given by this bar graph? Which two states have same production in 1993-94? Name the state having same production in both the years? Which state has minimum production?
View SolutionObserve the bar graph given below :

Read the bar graph carefully and answer the following questions :
What information is given by the bar graph?
View SolutionRead the following bar graph (Figure) and answer the following questions: What information is given by the bar graph? What was the production of cement in the year 1980-81? What is the minimum and maximum productions of cement and corresponding years?
View SolutionRead the bar graph given in Figure and answer the following questions: What information is given by the bar graph? What was the crop-production of rice in 1970-71? What is the difference between the maximum and minimum production of rice?
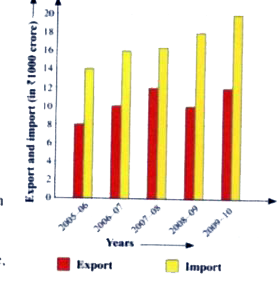
View SolutionRead the following bar graph and answer the following questions: What information is given by the bar graph? In which year the export is minimum ? In which year the import is maximum ? In which year the difference of the values of export and import is maximum?
View SolutionRead the following bar graph shown in Figure and answer the following questions: What is the information given by the bar graph? In which month was the sale of the book maximum? In which month was the sale of the book minimum? What is the total sale of the book during these five months?
View Solution
